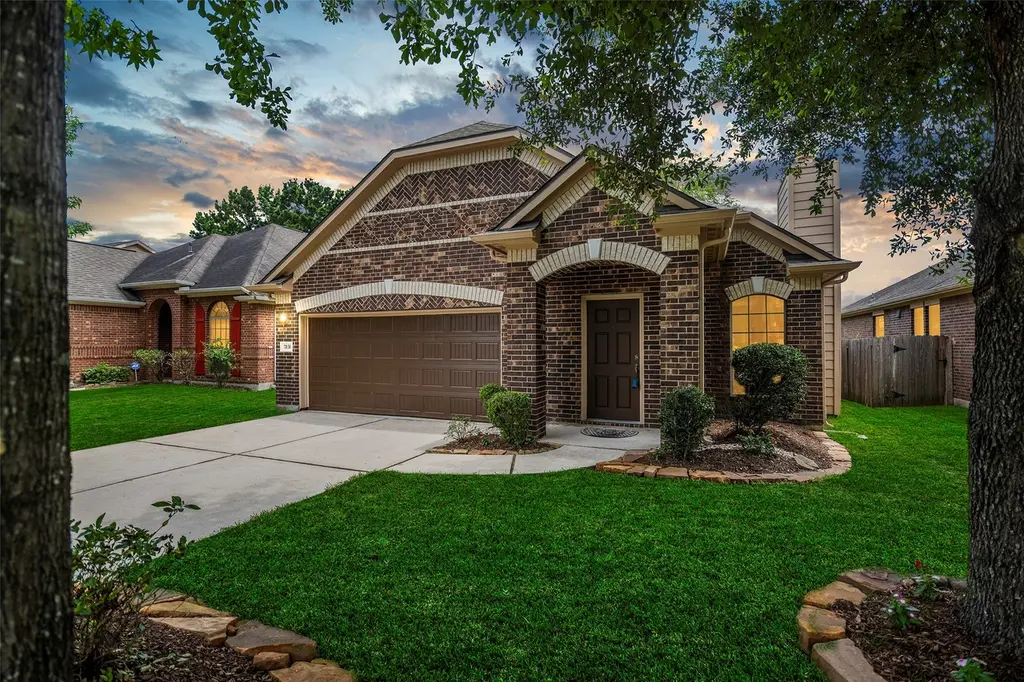
7131 Durango Creek Dr · The Woodlands, TX
Flood risk 1/10 · Minimal
- FEMA flood zone
- X (unshaded)
- Chance of flooding over 30 yrs
- 0.0%
- Est. flood insurance / yr
- $507 – $1,088
Fire risk 4/10 · Minor
- Est. fire insurance / yr
- $1,222 – $2,270
Heat risk 9/10 · Severe
- Hot days now (above 111°F)
- 7 days/yr
- Hot days in 30 yrs
- 26 days/yr
Wind risk 8/10 · Major
- Chance of severe wind over 30 yrs
- 99.0%
Air-quality risk 2/10 · Minimal
- Unhealthy air days now
- 2 days/yr
- Unhealthy air days in 30 yrs
- 2 days/yr
Risk factors via First Street. Map © Google.
Why this score? — see what drove the C+ grade
The composite is a weighted blend of 9 inputs, each scored 0–100. Each bar is that input's sub-score; the figure is the points it added to the 100-point composite (weight × sub-score).
- Cash flow +21.3/30.0
- Appreciation +10.0/10.0
- DSCR +6.8/10.0
- 1% rule +5.9/10.0
- ARV discount +5.7/15.0
- Livability +4.5/5.0
- Schools +3.9/10.0
- Rent growth +2.6/5.0
- Condition / age +2.5/5.0
$239,000
🖨 Deal sheet 📄 Offer letter ✓ Due diligence
Listing remarks MLS
Durango Creek One Story! This home features 3 bedrooms, 2 baths. Master with high ceiling, garden tub, tile shower, large walk-in closet & his and her sinks! Open kitchen with breakfast bar, gas stovetop and great counterspace. Living area with gas fireplace! Tile compliment the foyer, kitchen and bath areas. Covered back porch, gutters and fenced backyard. 2 car attached garage. Great location and schools!
Key facts
- Gas fireplace
- Open-concept layout
- Garden tub
Tags
Property features AI
Finance
- HOA & community: Homeowners association with RealManage; Annual association fee of $498 (covers common areas)
Exterior
- Parking: Attached 2-car garage; Driveway; Garage with automatic door opener
- Security: Smoke detectors
- Utilities: Public water; Public sewer
- Home design: Residential property; Faces north; Built in 2010; Slab foundation
- Construction: Brick and cement siding construction; Composition roof
- Exterior features: Covered patio; Deck; Patio; Porch; Fully fenced private yard; Back yard fencing; Subdivision location; Concrete road surface
Interior
- Kitchen: Dishwasher; Gas cooktop; Gas oven; Microwave; Disposal; Laminate counters
- Bedrooms: Primary bedroom on first floor (12 x 10); Bedroom on first floor (10 x 10); Bedroom on first floor (10 x 10)
- Flooring: Plank flooring; Tile; Vinyl
- Bathrooms: 2 full bathrooms
- Heating & cooling: Central heating (gas); Central electric air conditioning; Programmable thermostat
- Interior features: Entrance foyer; High ceilings; Kitchen/family room combo; Kitchen/dining combo; Double vanity; Separate shower; Tub with shower; Ceiling fans; Programmable thermostat; Gas log and wood-burning fireplace (1 total)
- Laundry & utility: Washer hookup; Electric dryer hookup
Neighborhood map
What this means for you Summary
Snapshot
- This is a 3-bed/2.0-bath single-family listed at $239k.
Deal economics
- At list price, monthly cash flow is $352 ($4k/yr) — positive.
- The deal already cash-flows at list — no discount required.
- Meets the 1% rule at list price ($3k rent vs $239k).
- Recommended offer: $235k (1.5% below list) — sets the bar for market timing.
- Cap rate 8.1% vs local median 2.3% in The Woodlands — top-decile yield for the area; either an underpriced asset or a hidden risk that comps aren't pricing in. Stress-test before assuming the spread holds.
Location & tenants
- Location reads 91/100 on livability (#1 in TX, #47 nationally) — a professional / high-income tenant draw. Strengths: amenities A+, commute A+, employment A+; Watch: cost of living D-.
- Magnolia ISD (rural): math 42% / reading 45% proficiency, ranked #247 of 826 in TX (top 30%) — families likely to look elsewhere, expect single-tenant / working-renter base with shorter leases.
- Zoned schools: Bear Branch El (math 48% / reading 51%, grade D, #865 of 4,322 statewide, top 21%, 579 students, 28% FRL); Bear Branch J H (math 44% / reading 46%, grade D, #479 of 1,662 statewide, top 29%, 1,076 students, 37% FRL); Magnolia H S (math 47% / reading 62%, grade C-, #379 of 1,632 statewide, top 26%, 2,248 students, 31% FRL).
- Market conditions: Rents flat; 1604 active listings in the ZIP; 7 comparable units currently listed for rent nearby; rentals leasing fast (median 11d on market — plan ~1-2 weeks tenant-placement turnaround); high-income renter base; 13,259 units permitted in Montgomery County in 2024 (1,402 in 5+ unit buildings).
Forward outlook
- In year one you build about $26k of equity ($2k loan paydown + $24k appreciation (10.0% local appreciation)).
- Montgomery County population projected at +65% by 2050 — long-run rental-demand tailwind backs the buy-and-hold thesis.
- At projected returns (10.0% appreciation + 0.3% rent growth), your $67k cash investment doubles in ~3 years — after that, you're playing with house money.
- By year 2, paydown + projected appreciation supports a ~$41k cash-out refi (75% LTV) — recoverable capital for the next deal without selling this one.
Negotiation context
- It's been on market 20 days — a 2% lower offer ($235k) is reasonable based on typical stale-listing flexibility.
- 2 sale attempts since 10y ago with the ask held roughly flat each time — persistent listings suggest the price (not the market) is what's stuck; bring a comps-based counter.
Risks & watch-outs
- Climate carrying-cost: severe wind risk, 99% chance of damaging wind over 30y; extreme-heat days projected 7→26/yr by 2055 (HVAC capex compounding) — expect insurance premiums to compound above CPI over the hold.
Questions for the listing agent
- What does the HOA fee cover, when was the last increase, and are there any pending special assessments or reserve-fund shortfalls?
- Is there a deadline driving the sale (1031 exchange, divorce, estate, relocation)? That informs how much negotiation room exists.
- Schools are A-rated — typically a magnet for longer-tenancy family renters. What's the average tenant stay here, and is there a school-zone premium baked into asking?
- What's the average days-on-market for RENTAL listings here right now (not sales)? A rising rental-DOM trend means longer vacancies and softer asking-rent achievability than the comps imply.
- What's the recent tenant-quality profile in this submarket — average credit score on applications, eviction rate, late-payment / NSF rate, and stable-employment percentage? A property-management company in the area should have these aggregated.
- How much new for-sale + rental construction is in the pipeline within 1–3 miles? Heavy new supply typically softens prices + rents 12–24 months out; constrained supply supports both.
Investment metrics
- 1% rule
- 1.09% ✓
- Cap rate
- 8.06%
- Cash-on-cash
- 6.31%
- DSCR
- 1.28
- GRM
- 7.7
CMA / ARV
- ARV (on-the-fly)
- $229,571
- Comps found
- 12
Show comp detail 12 sales within ~0.75 mi
| Address | Dist | Beds/Ba | Sqft | Sold | Price | $/sf | Match |
|---|---|---|---|---|---|---|---|
| 7222 Casita Dr | 0.10mi | 3/2.0 | 1,374 (+4%) | 11mo | $274,000 | $199 | 80 |
| 7002 Durango Creek Dr | 0.18mi | 3/2.0 | 1,248 (-6%) | 5mo | $235,000 | $188 | 78 |
| 7306 Winter Song Dr | 0.14mi | 4/2.0 (+1) | 1,333 (+0%) | 14mo | $209,900 | $157 | 76 |
| 33515 Forest West St | 0.14mi | 3/2.0 | 1,521 (+15%) | 0mo | $235,000 | $155 | 69 |
| 7023 Casita Dr | 0.14mi | 3/2.0 | 1,485 (+12%) | 8mo | $270,000 | $182 | 67 |
| 7107 Cool Springs Ct | 0.23mi | 4/2.0 (+1) | 1,333 (+0%) | 22mo | $225,000 | $169 | 66 |
| 33156 Wedgewood Dr | 0.48mi | 3/2.0 | 1,344 (+1%) | 13mo | $199,900 | $149 | 65 |
| 711 Hinsdale | 0.27mi | 3/2.0 | 1,421 (+7%) | 15mo | $245,900 | $173 | 64 |
| 6710 Durango Creek Dr | 0.51mi | 3/2.0 | 1,268 (-4%) | 7mo | $245,000 | $193 | 63 |
| 7318 Casita Dr | 0.13mi | 3/2.0 | 1,490 (+12%) | 16mo | $265,000 | $178 | 60 |
| 6835 Durango Creek Dr | 0.32mi | 3/2.0 | 1,495 (+13%) | 8mo | $254,900 | $171 | 57 |
| 6626 Dillon Dr | 0.55mi | 3/2.0 | 1,488 (+12%) | 9mo | $255,000 | $171 | 47 |
Match score weights: distance 35% · size 25% · config 20% · recency 20%. Top-matched comps best support the ARV.
Projected returns pro-forma
10.0% appreciation · 0.32% rent growth · sell at horizon
- IRR
- 27.8%
- Equity multiple
- 3.18×
- Total profit
- $145,807
- Equity at exit
- $215,310
- IRR
- 23.5%
- Equity multiple
- 6.97×
- Total profit
- $399,496
- Equity at exit
- $464,324
Cash invested: $66,920 (down + closing). Projections, not guarantees.
Landlord ↔ Tenant lean methodology
- Overall (STATE)
- 87 Strongly Landlord-Friendly
- State Texas
- 87 Strongly Landlord-Friendly · R+5
- County
- — inherits STATE
- City
- — inherits STATE
ZIP-level market 77354
- Home prices YoY
- 2.4%
- Rents YoY
- 0.3%
- Active inventory
- 1604
- Price-to-rent
- 7.7×
Monthly cashflow live
- Estimated rent
- $2,603 high interval (Pro) →
- Mortgage (P&I)
- −$1,253
- Tax from tax record
- −$309 /mo · $3,711/yr
- Insurance
- −$100
- HOA
- −$42
- Vacancy / Maint / Mgmt
- −$547
- Net cashflow
- $352
Break-even live
UW: 25.0% down · 7.5% · 30yr · 1.5% tax · 5.0% vac · 8.0% maint · 8.0% mgmt
Financing live
Cash to close
- Down payment
- $59,750
- Closing costs
- $7,170
- Reserves months
- —
- Total cash needed
- —
Loan-product check · same deal, 3 products live
Conventional
25% down · 7.5% · 30yr
- Down + closing
- —
- Monthly P&I
- —
- Monthly cashflow
- —
- DSCR
- —
- Eligible?
- —
Personal DTI + credit; lowest rate.
DSCR
20% down · 8.5% · 30yr
- Down + closing
- —
- Monthly P&I
- —
- Monthly cashflow
- —
- DSCR
- —
- Eligible?
- —
No personal income docs; deal must DSCR.
Hard money
10% down · 12.0% · 12mo
- Down + closing
- —
- Monthly P&I
- —
- Monthly cashflow
- —
- DSCR
- —
- Eligible?
- —
Short-term bridge; refi at stabilization.
Rent comps 7 comps
| Address | Beds | Baths | Sqft | Rent | $/sqft | DOM | Units | Dist |
|---|---|---|---|---|---|---|---|---|
| 33200 Forest West St Magnolia, TX | 1.0–3.0 | 1.5–2.5 | 1307 | $4,065 | $3.11 | 1d | 22 | 0.34mi |
| 33124 Magnolia Cir Magnolia, TX | 2.0 | 2.0 | 1122 | $1,875 | $1.67 | 44d | 1 | 0.64mi |
| 39300 Cimarron Way Magnolia, TX | 2.0 | 2.0 | 1172 | $1,353 | $1.15 | 11d | 1 | 1.05mi |
| 33154 Oak Heights Pl Magnolia, TX | 3.0–4.0 | 2.5 | 1812 | $2,195 | $1.21 | 5d | 7 | 1.11mi |
| 10333 Research Forest Dr Unit 3047 Magnolia, TX | 3.0 | 2.0 | 1377 | $2,383 | $1.73 | 11d | 1 | 1.20mi |
| 10333 Research Forest Dr Unit 3228 Magnolia, TX | 3.0 | 2.0 | 1377 | $2,340 | $1.70 | 3d | 1 | 1.25mi |
| 10333 Research Forest Dr Unit 10366 Magnolia, TX | 3.0 | 2.0 | 1377 | $2,372 | $1.72 | 10d | 1 | 1.25mi |
HOA detail
- Monthly dues
- $42 · $504/yr
- Likely covers
- gas
Listing history 13 events
-
2026-06-18days on market $239,000 Active 20 DOM
-
2026-06-17days on market $239,000 Active 19 DOM
-
2026-06-16days on market $239,000 Active 18 DOM
-
2026-06-15days on market $239,000 Active 17 DOM
-
2026-06-13days on market $239,000 Active 15 DOM
-
2026-06-09days on market $239,000 Active 11 DOM
-
2026-06-08days on market $239,000 Active 10 DOM
-
2026-06-07days on market $239,000 Active 9 DOM
-
2026-06-04days on market $239,000 Active 6 DOM
-
2026-06-03days on market $239,000 Active 5 DOM
-
2026-06-02days on market $239,000 Active 4 DOM
-
2026-06-01days on market $239,000 Active 3 DOM
-
2026-05-31days on market $239,000 Active 2 DOM
ⓘ Source: listings_history table (triggers on properties + properties_extension) + one-shot
backfill from property_details.listing_events for pre-trigger history.
Tax reassessment forecast TX · Resets to sale price
- Current annual tax
- $3,711 · $309/mo
- Projected year-2 tax
- $4,374 · $364/mo
- Expected delta
- +$662/yr (+$55/mo · 17.8%)
ⓘ Screening estimate from a state-policy table — verify with the county assessor before closing.
Climate risk First Street
- Flood 1/10 Low FEMA zone X (unshaded) · 0% chance over 30 yrs
- Wildfire 4/10 Moderate
- Heat 9/10 Extreme 7 d/yr ≥111°F today · 26 d/yr by 30 yrs out
- Wind 8/10 Severe 99% chance of damaging wind over 30 yrs
- Air quality 2/10 Low 2 unhealthy d/yr today · 2 by 30 yrs out
Nearby sold comps map
Loading sold comps map…
Walkable amenities ~0.75 mi
Loading nearby amenities…
Taxation est. · year 1
- Rental income
- $31,230
- − Mortgage interest
- −$13,388
- − Property taxes
- −$3,711
- − Insurance
- −$1,195
- − Repairs & maintenance
- −$2,498
- − Management
- −$2,498
- − HOA
- −$504
- − Depreciation
- −$6,953
- Taxable income
- $483
- Est. tax owed @ 24.0%
- −$116
- After-tax cash flow
- $4,106/yr
For passive investors: Depreciation is non-cash, so a rental often shows a tax loss while cash-flowing — sheltering income. Rental losses are passive: they offset passive income freely, and up to $25,000/yr can offset ordinary (W-2) income if you actively participate and your MAGI is under $100k (phasing out to $0 by $150k); unused losses carry forward. On sale, claimed depreciation is recaptured at up to 25%, and gains may owe capital-gains tax (a 1031 exchange can defer both). Figures are a year-1 estimate at your 24.0% rate — not tax advice; consult a CPA.
Schools (NCES district)
- District
- Magnolia ISD
- NCES district ID
- 4828740
- Math proficiency
- 42% ▼ -7.00%
- Reading proficiency
- 45% ▼ -4.00%
- Median HH income
- $71,692
- Composite
- 39.46/100
- National rank
- #3958
- State rank
- #247 of 826 in TX
Livability — The Woodlands
- Score
- 91/100
- State rank
- #1
- US rank
- #47
Category grades
Schools grade is shown separately in the Schools card above.
Census & demographics
- County
- Montgomery County · 663,713 people
- City population
- 106,505
- Metro
- Houston-The Woodlands-Sugar Land, TX
- Population (ZIP)
- 44,900
- Household income
- $112,504
- Rent vs Own
- Severe rent burden
- 586.0
Population outlook (Montgomery County) Hauer SSP2
- Today (2025)
- 713,896 people
- By 2030
- 805,263 · +12.8%
- By 2040
- 992,708 · +39.1%
- By 2050
- 1,179,590 · +65.2%
- By 2075
- 1,628,084 · +128.1%
- By 2100
- 1,937,880 · +171.5%
Race, ethnicity, and origin ACS 2023
- Neighborhood character
- Predominantly White (66%)
- Race & ethnicity
- White 66% Hispanic / Latino 25% Two or more races 18% Black 3% Asian 1%
- Hispanic origin (detail)
- Mexican 14% Puerto Rican 1%
- Common ancestry
- Lithuanian 4% Slovak 2% Italian 2%
- Foreign-born
- 11% · Canada, Vietnam
- Languages at home
- 83% English-only · Spanish 15% Other Indo-European 1% German/W. Germanic 1%
Political lean MEDSL · Montgomery
- 2024 margin
- Solid R (+45.5) · D 26.8% · R 72.3%
- 2008→2024 swing
- +7.2pp toward D · 2008: -52.7pp · 2024: -45.5pp
- All cycles
- 2024: R+45.5 2020: R+43.8 2016: R+51.4 2012: R+60.7 2008: R+52.7
Not yet ingested
- Civics
- —
Market trends
- HPI YoY
- ▲ 12.09%
- Current HPI
- 512.87
- Rent YoY
- ▲ 0.32%
- Metro
- Houston-The Woodlands-Sugar Land, TX
- State GDP YoY
- ▲ 3.95%
- F500 in state
- 110
Industry mix (Fortune 500 HQ in TX)
| Industry | F500 HQs | Revenue |
|---|---|---|
| Energy | 16 | $1,198B |
|
||
| Technology | 5 | $198B |
|
||
| Engineering / Construction | 4 | $72B |
|
||
| Energy Services | 3 | $60B |
|
||
| Utilities | 3 | $41B |
|
||
| Healthcare | 2 | $330B |
|
||
Price history
+41.4% since first listed6 events — show timeline
- 2026-05-29 Listed $239,000 HARMLS
- 2016-07-26 Sold (MLS) — HARMLS
- 2016-07-07 Pending — HARMLS
- 2016-06-24 Pending — HARMLS
- 2016-05-29 Listed $169,000 HARMLS
- 2010-05-10 Sold (Public Records) — Public Records
Property tax history
+13.2%/yrLatest (2025): $3,711 · +0.4% YoY. Source: county tax records.
Cash-flow waterfall
monthlySold comps — $/sqft
last 12 mo · ≤1 miLoading sold comps…