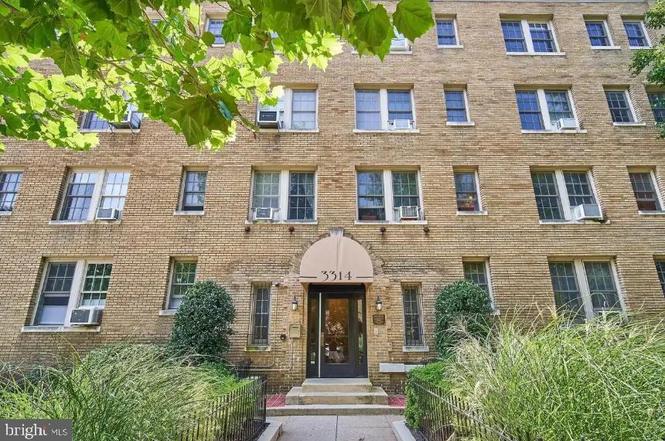
3314 Mount Pleasant St NW #23 · Washington, DC
Flood risk 1/10 · Minimal
- FEMA flood zone
- X (unshaded)
- Chance of flooding over 30 yrs
- 0.0%
- Est. flood insurance / yr
- $507 – $1,088
Fire risk 1/10 · Minimal
- Est. fire insurance / yr
- $631 – $1,173
Heat risk 7/10 · Major
- Hot days now (above 105°F)
- 7 days/yr
- Hot days in 30 yrs
- 15 days/yr
Wind risk 4/10 · Minor
- Chance of severe wind over 30 yrs
- 15.0%
Air-quality risk 4/10 · Minor
- Unhealthy air days now
- 4 days/yr
- Unhealthy air days in 30 yrs
- 5 days/yr
Risk factors via First Street. Map © Google.
Why this score? — see what drove the D grade
The composite is a weighted blend of 9 inputs, each scored 0–100. Each bar is that input's sub-score; the figure is the points it added to the 100-point composite (weight × sub-score).
- Cash flow +12.7/30.0
- ARV discount +7.5/15.0
- 1% rule +5.8/10.0
- DSCR +3.8/10.0
- Livability +3.7/5.0
- Schools +3.6/10.0
- Rent growth +2.6/5.0
- Condition / age +2.5/5.0
- Appreciation +0.0/10.0
$192,000
🖨 Deal sheet 📄 Offer letter ✓ Due diligence
Key facts
- $371 HOA
- Built 1922
- Listed 43 days
Property features AI
Finance
- Financial info: Condominium ownership interest
- HOA & community: Monthly condo fee of $371.35; Condo fee covers common area maintenance, exterior building maintenance, gas, heat, sewer, trash and water; Community amenities include common grounds and laundry facilities; Pets allowed with size/weight restrictions
Exterior
- Parking: Off-street parking
- Utilities: Public water; Public sewer (public septic); Natural gas for heating and cooling fuel; Electric hot water
- Home design: Condominium unit (Unit/Flat); Mid-rise building (5–8 floors); Building name: MOUNT PLEASANT; Entry on floor 1
- Construction: Brick construction
- Exterior features: Tidal water: no; Above-grade and below-grade structures present
Interior
- Kitchen: No specific appliances listed
- Bedrooms: One bedroom on the main level
- Bathrooms: One full bathroom (main level)
- Heating & cooling: Radiator heating (natural gas); Ceiling fan(s) and window unit(s) for cooling; Electric hot water
- Interior features: No basement; Living area per assessor: 594 finished above-grade square feet
- Laundry & utility: Washer/dryer hookup in unit
Neighborhood map
What this means for you Summary
Snapshot
- This is a 1-bed/1.0-bath condo listed at $192k.
Deal economics
- At list price, monthly cash flow is $-20 ($-240/yr) — negative.
- To cash-flow at today's rent, offer at most $188k (1.8% below list).
- Meets the 1% rule at list price ($2k rent vs $192k).
- Recommended offer: $186k (3.0% below list) — sets the bar for market timing.
- Cap rate 6.2% vs local median 2.5% in Washington — top-decile yield for the area; either an underpriced asset or a hidden risk that comps aren't pricing in. Stress-test before assuming the spread holds.
Location & tenants
- Location reads 73/100 on livability (#1 in DC) — a middle-class / working-renter tenant base. Strengths: amenities A+, commute A+, employment A+; Watch: crime F, cost of living F.
- District Of Columbia Public Schools (urban): math 33% / reading 40% proficiency, ranked #8 of 32 in DC (top 25%) — families likely to look elsewhere, expect single-tenant / working-renter base with shorter leases; 65% free/reduced lunch — lower-income household profile, screen leases tightly.
- Market conditions: Rents flat; 179 active listings in the ZIP; 40 comparable units currently listed for rent nearby; rentals at typical pace (median 17d on market — plan ~3-4 weeks tenant-placement turnaround); high-income renter base; 1,737 units permitted in District of Columbia in 2024 (1,506 in 5+ unit buildings).
Forward outlook
- Local home prices are declining (-3.0%/yr); year-one equity from $1k of loan paydown is wiped out by about $6k of value loss. Plan a longer hold.
- District of Columbia County population projected at +50% by 2050 — long-run rental-demand tailwind backs the buy-and-hold thesis.
Negotiation context
- It's been on market 43 days — a 3% lower offer ($186k) is reasonable based on typical stale-listing flexibility.
Risks & watch-outs
- Watch-outs: built in 1922 — expect roof / HVAC / electrical / plumbing capex.
- Climate carrying-cost: extreme-heat days projected 7→15/yr by 2055 (HVAC capex compounding) — expect insurance premiums to compound above CPI over the hold.
Questions for the listing agent
- What do current leases actually rent for vs. the listed asking? Can we see a recent rent roll and the last 12 months of T-12 income?
- It's been on market 43 days. Have you received any prior offers? Is the seller open to a 3% concession, seller financing, or rate buy-down credit?
- Built in 1922 — when were the roof, HVAC, electrical panel, plumbing, and water heater last replaced?
- What does the HOA fee cover, when was the last increase, and are there any pending special assessments or reserve-fund shortfalls?
- Any open or pending special assessments — roof, HVAC, plumbing, elevator, façade? What's the per-unit balance and payoff schedule, and is the seller paying it off at close or rolling it to the buyer?
- Is there a deadline driving the sale (1031 exchange, divorce, estate, relocation)? That informs how much negotiation room exists.
- Crime grade is F in this area — have there been break-ins, vandalism, or insurance claims at this property in the last 3 years? What carrier currently insures it and at what premium?
- The area grade is low — what's the realistic commute time and amenity access for the typical tenant pool here? Any planned neighborhood developments (good or bad) we should know about?
- What's the average days-on-market for RENTAL listings here right now (not sales)? A rising rental-DOM trend means longer vacancies and softer asking-rent achievability than the comps imply.
- What's the recent tenant-quality profile in this submarket — average credit score on applications, eviction rate, late-payment / NSF rate, and stable-employment percentage? A property-management company in the area should have these aggregated.
- How much new apartment / multifamily construction is in the pipeline within 1–3 miles? Heavy new supply (>2% of stock underway) typically softens rents 12–24 months out; light construction supports rent growth.
Investment metrics
- 1% rule
- 1.08% ✓
- Cap rate
- 6.17%
- Cash-on-cash
- -0.45%
- DSCR
- 0.98
- GRM
- 7.7
CMA / ARV
No comps found within radius.
Projected returns pro-forma
-3.0% appreciation · 0.3% rent growth · sell at horizon
- IRR
- -20.8%
- Equity multiple
- 0.30×
- Total profit
- $-37,649
- Equity at exit
- $28,628
- IRR
- -24.3%
- Equity multiple
- -0.02×
- Total profit
- $-54,838
- Equity at exit
- $16,601
Cash invested: $53,760 (down + closing). Projections, not guarantees.
Landlord ↔ Tenant lean methodology
- Overall (CITY)
- 0 Strongly Tenant-Friendly
- State District of Columbia
- 12 Strongly Tenant-Friendly · D+43
- County
- — inherits STATE
- City Washington
- 0 Strongly Tenant-Friendly · D+43
ZIP-level market 20010
- Rents YoY
- 0.3%
- Active inventory
- 179
- Price-to-rent
- 7.7×
Monthly cashflow live
- Estimated rent
- $2,078 high interval (Pro) →
- Mortgage (P&I)
- −$1,007
- Tax from tax record
- −$204 /mo · $2,450/yr
- Insurance
- −$80
- HOA
- −$371
- Vacancy / Maint / Mgmt
- −$436
- Net cashflow
- $-20
Break-even live
UW: 25.0% down · 7.5% · 30yr · 1.5% tax · 5.0% vac · 8.0% maint · 8.0% mgmt
Financing live
Cash to close
- Down payment
- $48,000
- Closing costs
- $5,760
- Reserves months
- —
- Total cash needed
- —
Loan-product check · same deal, 3 products live
Conventional
25% down · 7.5% · 30yr
- Down + closing
- —
- Monthly P&I
- —
- Monthly cashflow
- —
- DSCR
- —
- Eligible?
- —
Personal DTI + credit; lowest rate.
DSCR
20% down · 8.5% · 30yr
- Down + closing
- —
- Monthly P&I
- —
- Monthly cashflow
- —
- DSCR
- —
- Eligible?
- —
No personal income docs; deal must DSCR.
Hard money
10% down · 12.0% · 12mo
- Down + closing
- —
- Monthly P&I
- —
- Monthly cashflow
- —
- DSCR
- —
- Eligible?
- —
Short-term bridge; refi at stabilization.
Rent comps 40 comps
| Address | Beds | Baths | Sqft | Rent | $/sqft | DOM | Units | Dist |
|---|---|---|---|---|---|---|---|---|
| 3314 Mount Pleasant St NW #35 Washington, DC | 1.0 | 1.0 | 541 | $2,199 | $4.06 | 24d | 1 | 0.01mi |
| 3410 17th St NW Washington, DC | — | 1.0 | 400 | $1,492 | $3.73 | 24d | 1 | 0.12mi |
| 3215 Mount Pleasant St NW Unit 302 Washington, DC | 2.0 | 2.0 | 745 | $4,000 | $5.37 | 24d | 1 | 0.13mi |
| 3215 Mount Pleasant St NW Unit 303 Washington, DC | 2.0 | 1.0 | 730 | $4,000 | $5.48 | 24d | 1 | 0.13mi |
| 1630 Park Rd NW Washington, DC | — | 1.0 | 367 | $1,682 | $4.58 | 3d | 3 | 0.15mi |
| 3420 16th St NW Washington, DC | 1.0 | 1.0 | 715 | $2,188 | $3.06 | 2d | 1 | 0.17mi |
| 3300 16th St NW Unit 0809 Washington, DC | — | 1.0 | 454 | $1,595 | $3.51 | 24d | 1 | 0.18mi |
| 3300 16th St NW Apt 906 Washington, DC | — | 1.0 | 430 | $1,550 | $3.60 | 24d | 1 | 0.18mi |
| 3300 16th St NW Unit 0711 Washington, DC | — | 1.0 | 405 | $1,395 | $3.44 | 12d | 1 | 0.18mi |
| 3300 16th St NW Unit 0702 Washington, DC | — | 1.0 | 405 | $1,395 | $3.44 | 16d | 1 | 0.18mi |
| 3300 16th St NW Unit 0612 Washington, DC | — | 1.0 | 405 | $1,395 | $3.44 | 7d | 1 | 0.18mi |
| 3300 16th St NW Unit 0506 Washington, DC | — | 1.0 | 430 | $1,550 | $3.60 | 22d | 1 | 0.18mi |
| 3355 16th St NW Washington, DC | — | 1.0 | 452 | $1,525 | $3.37 | 16d | 9 | 0.21mi |
| 3435 Brown St NW Unit 24 Washington, DC | 2.0 | 1.0 | 735 | $2,599 | $3.54 | 24d | 1 | 0.21mi |
| 3200 16th St NW Washington, DC | 1.0 | 1.0 | 705 | $2,524 | $3.58 | 18d | 8 | 0.21mi |
| 3620 16th St NW Unit 3620-510 Washington, DC | 1.0 | 1.0 | 453 | $1,700 | $3.75 | 15d | 1 | 0.25mi |
| 3620 16th St NW Unit 3620-209 Washington, DC | — | 1.0 | 453 | $1,495 | $3.30 | 15d | 1 | 0.25mi |
| 3620 16th St NW Unit 3620-212 Washington, DC | — | 1.0 | 453 | $1,700 | $3.75 | 15d | 1 | 0.25mi |
| 3620 16th St NW Unit 3620-408 Washington, DC | — | 1.0 | 453 | $1,757 | $3.88 | 15d | 1 | 0.25mi |
| 3620 16th St NW Washington, DC | 1.0 | 1.0 | 453 | $1,757 | $3.88 | 24d | 5 | 0.25mi |
| 3146 16th St NW Washington, DC | 2.0 | 1.0 | 610 | $2,249 | $3.69 | 20d | 10 | 0.26mi |
| 1519 Park Rd NW Washington, DC | 1.0 | 1.0 | 521 | $1,900 | $3.65 | 4d | 1 | 0.27mi |
| 3636 16th St NW Washington, DC | 1.0 | 1.0 | 509 | $2,182 | $4.29 | 1d | 1 | 0.28mi |
| 1483 Newton St NW Washington, DC | 2.0 | 1.0 | 526 | $2,192 | $4.17 | 16d | 5 | 0.28mi |
| 3120 16th St NW Unit 15 Washington, DC | 2.0 | 1.0 | 657 | $3,200 | $4.87 | 24d | 1 | 0.30mi |
| 1436 Meridian Pl NW Unit LL06 Washington, DC | 2.0 | 1.0 | 645 | $1,900 | $2.95 | 1d | 1 | 0.30mi |
| 1454 Newton St NW #101 Washington, DC | 2.0 | 1.0 | 690 | $2,700 | $3.91 | 24d | 1 | 0.31mi |
| 3115 Mount Pleasant St NW Washington, DC | 2.0 | 1.0 | 710 | $2,599 | $3.66 | 24d | 1 | 0.31mi |
| 1457 Park Rd NW Washington, DC | — | 1.0 | 490 | $1,395 | $2.85 | 12d | 1 | 0.31mi |
| 1443 Oak St NW Washington, DC | 1.0 | 1.0 | 550 | $1,900 | $3.45 | 24d | 1 | 0.32mi |
| 1515 Ogden St NW Washington, DC | 1.0 | 1.0 | 587 | $1,799 | $3.06 | 1d | 11 | 0.33mi |
| 1451 Park Rd NW Washington, DC | — | 1.0 | 357 | $1,490 | $4.17 | 4d | 1 | 0.33mi |
| 3060 16th St NW #308 Washington, DC | 1.0 | 1.0 | 624 | $1,800 | $2.88 | 18d | 1 | 0.35mi |
| 1445 Ogden St NW Washington, DC | 1.0 | 1.0 | 625 | $1,921 | $3.07 | 24d | 9 | 0.36mi |
| 3625 16th St NW Washington, DC | 1.0 | 1.0 | 601 | $1,850 | $3.08 | 22d | 1 | 0.36mi |
| 1416 Perry Pl NW Washington, DC | — | 1.0 | 425 | $1,600 | $3.76 | 24d | 1 | 0.41mi |
| 1460 Irving St NW Washington, DC | — | 1.0 | 457 | $1,574 | $3.44 | 3d | 6 | 0.42mi |
| 1700 Harvard St NW Washington, DC | 1.0 | 1.0 | 620 | $2,715 | $4.38 | 1d | 12 | 0.42mi |
| 1437 Spring Rd NW #22 Washington, DC | 2.0 | 1.0 | 680 | $1,995 | $2.93 | 14d | 1 | 0.43mi |
| 3517 14th St NW Unit B01 Washington, DC | 1.0 | 1.0 | 608 | $2,500 | $4.11 | 4d | 1 | 0.44mi |
HOA detail condo
- Monthly dues
- $371 · $4,452/yr
- Assessments
- None detected in remarks — confirm with the listing agent.
Listing history 4 events
-
2026-05-22soldstatus $179,500 Closed
-
2026-04-30status Pending
-
2026-03-19$192,000 Active
-
2026-03-12historical $192,000
ⓘ Source: listings_history table (triggers on properties + properties_extension) + one-shot
backfill from property_details.listing_events for pre-trigger history.
Tax reassessment forecast DC · Partial reset (capped growth)
- Current annual tax
- $2,450 · $204/mo
- Projected year-2 tax
- $2,450 · $204/mo
- Expected delta
- $0/yr ($0/mo · 0.0%)
ⓘ Screening estimate from a state-policy table — verify with the county assessor before closing.
Climate risk First Street
- Flood 1/10 Low FEMA zone X (unshaded) · 0% chance over 30 yrs
- Wildfire 1/10 Low
- Heat 7/10 Severe 7 d/yr ≥105°F today · 15 d/yr by 30 yrs out
- Wind 4/10 Moderate 15% chance of damaging wind over 30 yrs
- Air quality 4/10 Moderate 4 unhealthy d/yr today · 5 by 30 yrs out
Nearby sold comps map
Loading sold comps map…
Walkable amenities ~0.75 mi
Loading nearby amenities…
Taxation est. · year 1
- Rental income
- $24,941
- − Mortgage interest
- −$10,755
- − Property taxes
- −$2,450
- − Insurance
- −$960
- − Repairs & maintenance
- −$1,995
- − Management
- −$1,995
- − HOA
- −$4,452
- − Depreciation
- −$5,585
- Taxable loss
- −$3,251
- Est. tax savings @ 24.0%
- +$780
- After-tax cash flow
- $540/yr
For passive investors: Depreciation is non-cash, so a rental often shows a tax loss while cash-flowing — sheltering income. Rental losses are passive: they offset passive income freely, and up to $25,000/yr can offset ordinary (W-2) income if you actively participate and your MAGI is under $100k (phasing out to $0 by $150k); unused losses carry forward. On sale, claimed depreciation is recaptured at up to 25%, and gains may owe capital-gains tax (a 1031 exchange can defer both). Figures are a year-1 estimate at your 24.0% rate — not tax advice; consult a CPA.
Schools (NCES district)
- District
- District Of Columbia Public Schools
- NCES district ID
- 1100030
- Math proficiency
- 33% ▲ 3.00%
- Reading proficiency
- 40% ▲ 5.00%
- Median HH income
- $67,671
- Composite
- 35.84/100
- National rank
- #9606
- State rank
- #8 of 32 in DC
Livability — Washington
- Score
- 73/100
- State rank
- #1
- US rank
- #5327
Category grades
Schools grade is shown separately in the Schools card above.
Census & demographics
- Census place
- Washington, DC
- County
- District of Columbia · 671,873 people
- City population
- 671,873
- Metro
- Washington-Arlington-Alexandria, DC-VA-MD-WV
- Population (ZIP)
- 31,808
- Household income
- $114,126
- Rent vs Own
- Severe rent burden
- 1344.0
Population outlook (District of Columbia County) Hauer SSP2
- Today (2025)
- 821,926 people
- By 2030
- 899,517 · +9.4%
- By 2040
- 1,061,162 · +29.1%
- By 2050
- 1,231,493 · +49.8%
- By 2075
- 1,603,312 · +95.1%
- By 2100
- 1,847,141 · +124.7%
Race, ethnicity, and origin ACS 2023
- Neighborhood character
- Highly diverse neighborhood (Simpson 0.72)
- Race & ethnicity
- White 38% Hispanic / Latino 29% Black 21% Two or more races 13% Asian 6%
- Hispanic origin (detail)
- Mexican 8%
- Common ancestry
- Romanian 3% Slovak 2% Lithuanian 2%
- Foreign-born
- 25% · Canada, Vietnam, Jamaica
- Languages at home
- 64% English-only · Spanish 26% French/Haitian/Cajun 2% Other Indo-European 2%
Political lean MEDSL · District of Columbia
- 2024 margin
- Solid D (+86.1) · D 91.2% · R 5.1% · Other 3.8%
- 2008→2024 swing
- +0.1pp no change · 2008: 85.9pp · 2024: 86.1pp
- All cycles
- 2024: D+86.1 2020: D+86.8 2016: D+88.7 2012: D+84.2 2008: D+85.9
Not yet ingested
- Civics
- —
Market trends
- HPI YoY
- ▼ -1053.82%
- Current HPI
- 380.8513
- Rent YoY
- ▲ 0.30%
- Metro
- Washington-Arlington-Alexandria, DC-VA-MD-WV
- State GDP YoY
- ▲ 1.33%
- F500 in state
- 6
Industry mix (Fortune 500 HQ in DC)
| Industry | F500 HQs | Revenue |
|---|---|---|
| Financial Services | 1 | $153B |
|
||
| Life Sciences / Industrials | 1 | $25B |
|
||
| Industrial Machinery | 1 | $8B |
|
||
Price history
-6.5% since first listed4 events — show timeline
- 2026-05-22 Sold (MLS) $179,500 BRIGHT MLS
- 2026-04-30 Pending — BRIGHT MLS
- 2026-03-19 Listed $192,000 BRIGHT MLS
- 2026-03-12 Coming Soon $192,000 BRIGHT MLS
Property tax history
+0.5%/yrLatest (2025): $2,450 · -1.0% YoY. Source: county tax records.
Cash-flow waterfall
monthlySold comps — $/sqft
last 12 mo · ≤1 miLoading sold comps…