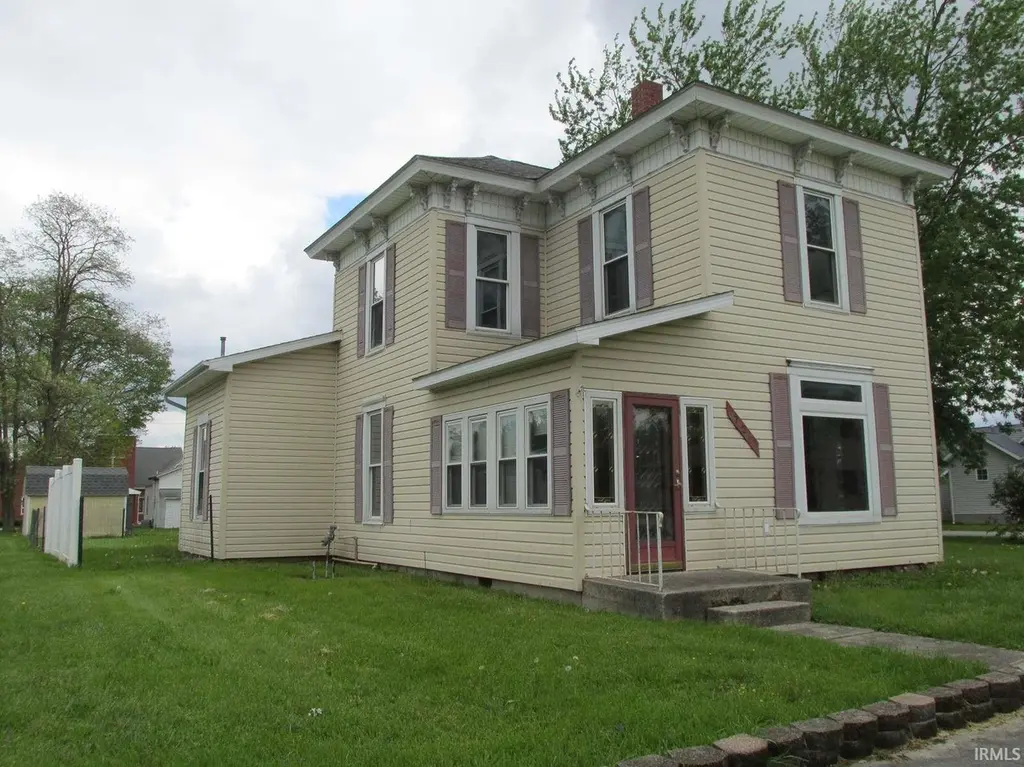
725 N Main St · Warren, IN
Flood risk 1/10 · Minimal
- FEMA flood zone
- X (unshaded)
- Chance of flooding over 30 yrs
- 0.0%
- Est. flood insurance / yr
- $473 – $860
Fire risk 1/10 · Minimal
- Est. fire insurance / yr
- $717 – $1,331
Heat risk 3/10 · Minor
- Hot days now (above 100°F)
- 7 days/yr
- Hot days in 30 yrs
- 17 days/yr
Wind risk 2/10 · Minimal
- Chance of severe wind over 30 yrs
- 0.0%
Air-quality risk 2/10 · Minimal
- Unhealthy air days now
- 1 days/yr
- Unhealthy air days in 30 yrs
- 3 days/yr
Risk factors via First Street. Map © Google.
Why this score? — see what drove the C- grade
The composite is a weighted blend of 9 inputs, each scored 0–100. Each bar is that input's sub-score; the figure is the points it added to the 100-point composite (weight × sub-score).
- ARV discount +15.0/15.0
- Cash flow +14.4/30.0
- 1% rule +4.8/10.0
- DSCR +4.4/10.0
- Livability +3.6/5.0
- Schools +3.1/10.0
- Rent growth +2.5/5.0
- Condition / age +2.5/5.0
- Appreciation +1.4/10.0
$124,900
🖨 Deal sheet (PDF) 📄 Offer letter ✓ Due diligence
Listing remarks MLS
If you have seen this home, you must come back and see it again. Updates such as new kitchen flooring, new ceiling tiles in the dining room and the front porch have recently been done. Here is your chance to own a piece Warren history ! This home was the hotel in Warren across from the old train station and next to the general store. It is now a spacious home with a large kitchen, new roof, newer siding. All but one window in this home has been replaced with Home Guard triple pane windows. This home is very well insulated to help lower your utility costs. Momper Insulation company in 2000. A large 2 car garage was built in 2010 with a concrete floor. There is also a 10 X 12 shed for extra storage. The Williams vented wall furnaces where installed in the last 2 years. This home offers 3 bedrooms, one on the main level, an enclosed front porch, nice corner lot with plenty of parking and nice shade trees. There are a few minor repairs to be made to this home that your handy man can handle. There is a huge walk in closet off of the loft that would be a perfect spot for a full upstairs bathroom or bump the wall out a bit into the loft and you could have a third nice size bedroom upstairs. This is a wonderful opportunity to own a great family home. This home is being sold AS IS .
Key facts
- Fenced yard
- Layout options
- Corner lot
Tags
Property features AI
Exterior
- Parking: Detached off-street garage with 2 spaces
- Utilities: Public water; Public sewer
- Home design: Single-family residence (site-built); Two stories
- Construction: Vinyl siding
- Exterior features: Corner lot; Shed(s)
Interior
- Bedrooms: Total rooms: 7
- Bathrooms: One full bathroom (main level)
- Heating & cooling: Natural gas heating; Ceiling fan(s) for cooling; Window unit(s) for cooling
- Interior features: Walk-in closet(s); Ceiling fan(s); Built-in features; Partial basement
- Laundry & utility: Main-level laundry with electric dryer hookup
Neighborhood map
What this means for you Summary
Snapshot
- This is a 3-bed/1.0-bath single-family listed at $125k.
Deal economics
- At list price, monthly cash flow is $26 ($308/yr) — positive.
- The deal already cash-flows at list — no discount required.
- To meet the 1% rule (rent ≥ 1% of price), the offer needs to be $122k (2.0% below list).
- Recommended offer: $121k (3.0% below list) — sets the bar for market timing.
Location & tenants
- Location reads 71/100 on livability (#137 in IN) — a middle-class / working-renter tenant base. Strengths: crime A+, cost of living A+, housing A+; Watch: health & safety C-, amenities F, commute F.
- Huntington County Community School Corporation (rural): math 34% / reading 39% proficiency, ranked #176 of 301 in IN (top 58%) — families likely to look elsewhere, expect single-tenant / working-renter base with shorter leases.
- Zoned schools: Salamonie Elementary School (math 52% / reading 42%, grade D-, #325 of 994 statewide, top 36%, 286 students, 46% FRL); Riverview School (math 29% / reading 40%, grade F, #167 of 330 statewide, top 52%, 503 students, 54% FRL); Huntington North High School (math 30% / reading 55%, grade F, #195 of 369 statewide, top 53%, 1,424 students, 42% FRL).
- Market conditions: 12 active listings in the ZIP; 79 units permitted in Huntington County in 2024 (0 in 5+ unit buildings).
Forward outlook
- Local home prices are declining (-3.0%/yr); year-one equity from $864 of loan paydown is wiped out by about $4k of value loss. Plan a longer hold.
- Huntington County population projected at -14% by 2050 — secular population decline; favor cash flow + early exit over multi-decade hold.
Negotiation context
- It's been on market 53 days — a 3% lower offer ($121k) is reasonable based on typical stale-listing flexibility.
- 3 sale attempts since 11y ago with the ask held roughly flat each time — persistent listings suggest the price (not the market) is what's stuck; bring a comps-based counter.
- Current owner paid $38k; list at $125k implies a 229% gain — meaningful room to come down on a strong offer.
Risks & watch-outs
- Watch-outs: built in 1900 — expect roof / HVAC / electrical / plumbing capex.
Questions for the listing agent
- It's been on market 53 days. Have you received any prior offers? Is the seller open to a 3% concession, seller financing, or rate buy-down credit?
- Built in 1900 — when were the roof, HVAC, electrical panel, plumbing, and water heater last replaced?
- Is there a deadline driving the sale (1031 exchange, divorce, estate, relocation)? That informs how much negotiation room exists.
- What's the average days-on-market for RENTAL listings here right now (not sales)? A rising rental-DOM trend means longer vacancies and softer asking-rent achievability than the comps imply.
- What's the recent tenant-quality profile in this submarket — average credit score on applications, eviction rate, late-payment / NSF rate, and stable-employment percentage? A property-management company in the area should have these aggregated.
- How much new for-sale + rental construction is in the pipeline within 1–3 miles? Heavy new supply typically softens prices + rents 12–24 months out; constrained supply supports both.
Investment metrics
- 1% rule
- 0.98% ✗
- Cap rate
- 6.54%
- Cash-on-cash
- 0.88%
- DSCR
- 1.04
- GRM
- 8.5
CMA / ARV
- ARV (on-the-fly)
- $197,768
- Comps found
- 12
Show comp detail 12 sales within ~0.75 mi
| Address | Dist | Beds/Ba | Sqft | Sold | Price | $/sf | Match |
|---|---|---|---|---|---|---|---|
| 203 E 8th St | 0.03mi | 3/2.0 | 1,877 (+12%) | 2mo | $216,000 | $115 | 72 |
| 412 N Nancy St | 0.24mi | 3/1.0 | 1,824 (+9%) | 3mo | $85,000 | $47 | 72 |
| 325 N Wayne St | 0.27mi | 4/2.0 (+1) | 1,625 (-3%) | 4mo | $179,900 | $111 | 70 |
| 407 N Main St | 0.23mi | 3/2.0 | 1,700 (+1%) | 16mo | $199,900 | $118 | 70 |
| 710 N Wayne St | 0.05mi | 3/2.0 | 1,850 (+10%) | 9mo | $240,000 | $130 | 69 |
| 212 N Hendricks St | 0.40mi | 3/2.0 | 1,736 (+4%) | 3mo | $194,000 | $112 | 69 |
| 204 N Hendricks St | 0.41mi | 3/2.0 | 1,517 (-10%) | 4mo | $190,000 | $125 | 58 |
| 231 Van Malson Dr | 0.52mi | 3/2.0 | 1,587 (-5%) | 11mo | $269,000 | $170 | 54 |
| 517 N Nancy St | 0.16mi | 4/2.0 (+1) | 1,908 (+14%) | 12mo | $193,400 | $101 | 51 |
| 220 Vanmalson Dr | 0.48mi | 3/2.0 | 1,848 (+10%) | 18mo | $264,000 | $143 | 41 |
| 230 Van Malson Dr | 0.49mi | 4/2.0 (+1) | 1,818 (+8%) | 18mo | $270,000 | $149 | 39 |
| 128 E Parkway Dr | 0.69mi | 3/2.0 | 1,821 (+9%) | 20mo | $130,000 | $71 | 33 |
Match score weights: distance 35% · size 25% · config 20% · recency 20%. Top-matched comps best support the ARV.
Projected returns pro-forma
-3.0% appreciation · 3.0% rent growth · sell at horizon
- IRR
- -14.8%
- Equity multiple
- 0.47×
- Total profit
- $-18,537
- Equity at exit
- $18,623
- IRR
- -6.1%
- Equity multiple
- 0.61×
- Total profit
- $-13,766
- Equity at exit
- $10,799
Cash invested: $34,972 (down + closing). Projections, not guarantees.
Landlord ↔ Tenant lean methodology
- Overall (STATE)
- 90 Strongly Landlord-Friendly
- State Indiana
- 90 Strongly Landlord-Friendly · R+11
- County
- — inherits STATE
- City
- — inherits STATE
ZIP-level market 46792
- Home prices YoY
- -2.9%
- Active inventory
- 12
- Price-to-rent
- 8.5×
Monthly cashflow live
- Estimated rent
- $1,224 medium interval (Pro) →
- Mortgage (P&I)
- −$655
- Tax from tax record
- −$234 /mo · $2,809/yr
- Insurance
- −$52
- HOA
- −$0
- Vacancy / Maint / Mgmt
- −$257
- Net cashflow
- $26
Break-even live
Sensitivity live
| Price | -10% $96 | -5% $61 | +0% $26 | +5% $-10 | +10% $-45 |
|---|---|---|---|---|---|
| Rent | -10% $-71 | -5% $-23 | +0% $26 | +5% $74 | +10% $122 |
| Rate | -1.0pp $89 | -0.5pp $57 | base $26 | +0.5pp $-7 | +1.0pp $-40 |
UW: 25.0% down · 7.5% · 30yr · 1.5% tax · 5.0% vac · 8.0% maint · 8.0% mgmt
Financing live
Cash to close
- Down payment
- $31,225
- Closing costs
- $3,747
- Reserves months
- —
- Total cash needed
- —
Loan-product check · same deal, 3 products live
Conventional
25% down · 7.5% · 30yr
- Down + closing
- —
- Monthly P&I
- —
- Monthly cashflow
- —
- DSCR
- —
- Eligible?
- —
Personal DTI + credit; lowest rate.
DSCR
20% down · 8.5% · 30yr
- Down + closing
- —
- Monthly P&I
- —
- Monthly cashflow
- —
- DSCR
- —
- Eligible?
- —
No personal income docs; deal must DSCR.
Hard money
10% down · 12.0% · 12mo
- Down + closing
- —
- Monthly P&I
- —
- Monthly cashflow
- —
- DSCR
- —
- Eligible?
- —
Short-term bridge; refi at stabilization.
Listing history 22 events
-
2026-06-22days on market $124,900 Active 53 DOM
-
2026-06-21days on market $124,900 Active 52 DOM
-
2026-06-19days on market $124,900 Active 50 DOM
-
2026-06-18days on market $124,900 Active 49 DOM
-
2026-06-17days on market $124,900 Active 48 DOM
-
2026-06-16days on market $124,900 Active 47 DOM
-
2026-06-15days on market $124,900 Active 46 DOM
-
2026-06-14days on market $124,900 Active 44 DOM
-
2026-06-12pricedays on market $124,900 Active 43 DOM
-
2026-06-09days on market $129,900 Active 40 DOM
-
2026-06-08days on market $129,900 Active 39 DOM
-
2026-06-07days on market $129,900 Active 38 DOM
-
2026-06-05days on market $129,900 Active 35 DOM
-
2026-06-03days on market $129,900 Active 34 DOM
-
2026-06-02days on market $129,900 Active 33 DOM
-
2026-06-01days on market $129,900 Active 32 DOM
-
2026-05-31days on market $129,900 Active 31 DOM
-
2026-05-30days on market $129,900 Active 30 DOM
-
2026-04-28$129,900 Active
-
2017-12-14soldstatus $38,000 1295-char remark
Show marketing remark (1295 chars)
If you have seen this home, you must come back and see it again. Updates such as new kitchen flooring, new ceiling tiles in the dining room and the front porch have recently been done. Here is your chance to own a piece Warren history ! This home was the hotel in Warren across from the old train station and next to the general store. It is now a spacious home with a large kitchen, new roof, newer siding. All but one window in this home has been replaced with Home Guard triple pane windows. This home is very well insulated to help lower your utility costs. Momper Insulation company in 2000. A large 2 car garage was built in 2010 with a concrete floor. There is also a 10 X 12 shed for extra storage. The Williams vented wall furnaces where installed in the last 2 years. This home offers 3 bedrooms, one on the main level, an enclosed front porch, nice corner lot with plenty of parking and nice shade trees. There are a few minor repairs to be made to this home that your handy man can handle. There is a huge walk in closet off of the loft that would be a perfect spot for a full upstairs bathroom or bump the wall out a bit into the loft and you could have a third nice size bedroom upstairs. This is a wonderful opportunity to own a great family home. This home is being sold AS IS .
-
2017-06-13$49,900 1295-char remark
Show marketing remark (1295 chars)
If you have seen this home, you must come back and see it again. Updates such as new kitchen flooring, new ceiling tiles in the dining room and the front porch have recently been done. Here is your chance to own a piece Warren history ! This home was the hotel in Warren across from the old train station and next to the general store. It is now a spacious home with a large kitchen, new roof, newer siding. All but one window in this home has been replaced with Home Guard triple pane windows. This home is very well insulated to help lower your utility costs. Momper Insulation company in 2000. A large 2 car garage was built in 2010 with a concrete floor. There is also a 10 X 12 shed for extra storage. The Williams vented wall furnaces where installed in the last 2 years. This home offers 3 bedrooms, one on the main level, an enclosed front porch, nice corner lot with plenty of parking and nice shade trees. There are a few minor repairs to be made to this home that your handy man can handle. There is a huge walk in closet off of the loft that would be a perfect spot for a full upstairs bathroom or bump the wall out a bit into the loft and you could have a third nice size bedroom upstairs. This is a wonderful opportunity to own a great family home. This home is being sold AS IS .
-
2015-08-05$79,555
ⓘ Source: listings_history table (triggers on properties + properties_extension) + one-shot
backfill from property_details.listing_events for pre-trigger history.
Tax reassessment forecast IN · Partial reset (capped growth)
- Current annual tax
- $2,809 · $234/mo
- Projected year-2 tax
- $2,809 · $234/mo
- Expected delta
- $0/yr ($0/mo · 0.0%)
ⓘ Screening estimate from a state-policy table — verify with the county assessor before closing.
Climate risk First Street
- Flood 1/10 Low FEMA zone X (unshaded) · 0% chance over 30 yrs
- Wildfire 1/10 Low
- Heat 3/10 Moderate 7 d/yr ≥100°F today · 17 d/yr by 30 yrs out
- Wind 2/10 Low 0% chance of damaging wind over 30 yrs
- Air quality 2/10 Low 1 unhealthy d/yr today · 3 by 30 yrs out
Nearby sold comps map
Loading sold comps map…
Walkable amenities ~0.75 mi
Loading nearby amenities…
Taxation est. · year 1
- Rental income
- $14,686
- − Mortgage interest
- −$6,996
- − Property taxes
- −$2,809
- − Insurance
- −$624
- − Repairs & maintenance
- −$1,175
- − Management
- −$1,175
- − Depreciation
- −$3,633
- Taxable loss
- −$1,727
- Est. tax savings @ 24.0%
- +$415
- After-tax cash flow
- $723/yr
For passive investors: Depreciation is non-cash, so a rental often shows a tax loss while cash-flowing — sheltering income. Rental losses are passive: they offset passive income freely, and up to $25,000/yr can offset ordinary (W-2) income if you actively participate and your MAGI is under $100k (phasing out to $0 by $150k); unused losses carry forward. On sale, claimed depreciation is recaptured at up to 25%, and gains may owe capital-gains tax (a 1031 exchange can defer both). Figures are a year-1 estimate at your 24.0% rate — not tax advice; consult a CPA.
Schools (NCES district)
- District
- Huntington County Community School Corporation
- NCES district ID
- 1804710
- Math proficiency
- 34% ▼ -6.00%
- Reading proficiency
- 39% ▼ -10.00%
- Median HH income
- $47,010
- Composite
- 31.29/100
- National rank
- #6013
- State rank
- #176 of 301 in IN
Livability — Warren
- Score
- 71/100
- State rank
- #137
- US rank
- #7126
Category grades
Schools grade is shown separately in the Schools card above.
Census & demographics
- Census place
- Warren, IN
- Population (ZIP)
- 3,577
Population outlook (Huntington County) Hauer SSP2
- Today (2025)
- 35,613 people
- By 2030
- 34,759 · -2.4%
- By 2040
- 32,682 · -8.2%
- By 2050
- 30,495 · -14.4%
- By 2075
- 26,298 · -26.2%
- By 2100
- 22,653 · -36.4%
Race, ethnicity, and origin ACS 2023
- Neighborhood character
- Predominantly White (95%)
- Race & ethnicity
- White 95% Two or more races 3% Hispanic / Latino 1%
- Common ancestry
- Italian 5% Slovak 2% Lithuanian 2%
- Foreign-born
- 1%
- Languages at home
- 98% English-only · Spanish 1%
Political lean MEDSL · Huntington
- 2024 margin
- Solid R (+48.4) · D 24.9% · R 73.3% · Other 1.8%
- 2008→2024 swing
- -21.2pp toward R · 2008: -27.2pp · 2024: -48.4pp
- All cycles
- 2024: R+48.4 2020: R+49.9 2016: R+51.0 2012: R+39.8 2008: R+27.2
Not yet ingested
- Civics
- —
Market trends
- HPI YoY
- ▼ -7.11%
- Current HPI
- 238.5693
- Rent YoY
- —
- Metro
- —
- State GDP YoY
- ▲ 2.90%
- F500 in state
- 18
Industry mix (Fortune 500 HQ in IN)
| Industry | F500 HQs | Revenue |
|---|---|---|
| Industrial Machinery | 2 | $37B |
|
||
| Healthcare | 1 | $177B |
|
||
| Pharmaceuticals | 1 | $45B |
|
||
| Metals / Steel | 1 | $18B |
|
||
| Agriculture | 1 | $17B |
|
||
| Packaging | 1 | $12B |
|
||
Price history
+63.3% since first listed4 events — show timeline
- 2026-04-28 Listed $129,900 IRMLS
- 2017-12-14 Sold (MLS) $38,000 IRMLS
- 2017-06-13 Listed $49,900 IRMLS
- 2015-08-05 Listed $79,555 IRMLS
Property tax history
+14.8%/yrLatest (2024): $2,809 · +15.9% YoY. Source: county tax records.
Cash-flow waterfall
monthlySold comps — $/sqft
last 12 mo · ≤1 miLoading sold comps…