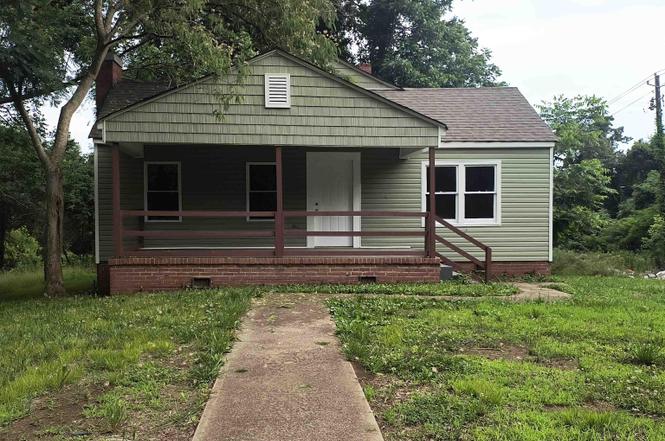
5223 Loop Rd · Birmingham, AL
Flood risk 1/10 · Minimal
- FEMA flood zone
- X (unshaded)
- Chance of flooding over 30 yrs
- 0.0%
- Est. flood insurance / yr
- $473 – $860
Fire risk 4/10 · Minor
- Est. fire insurance / yr
- $916 – $1,700
Heat risk 6/10 · Moderate
- Hot days now (above 107°F)
- 7 days/yr
- Hot days in 30 yrs
- 18 days/yr
Wind risk 6/10 · Moderate
- Chance of severe wind over 30 yrs
- 27.0%
Air-quality risk 4/10 · Minor
- Unhealthy air days now
- 5 days/yr
- Unhealthy air days in 30 yrs
- 5 days/yr
Risk factors via First Street. Map © Google.
Why this score? — see what drove the C+ grade
The composite is a weighted blend of 9 inputs, each scored 0–100. Each bar is that input's sub-score; the figure is the points it added to the 100-point composite (weight × sub-score).
- Cash flow +30.0/30.0
- 1% rule +10.0/10.0
- DSCR +10.0/10.0
- Livability +3.4/5.0
- Rent growth +2.5/5.0
- Condition / age +2.5/5.0
- ARV discount +1.6/15.0
- Schools +0.9/10.0
- Appreciation +0.0/10.0
$70,900
🖨 Deal sheet 📄 Offer letter ✓ Due diligence
Listing remarks MLS
Great income producing property that is currently tenant occupied with a long term straight pay tenant. This home features 3 bedrooms & 1 full bathroom. The large front porch leads inside to a living area, then to the kitchen with eat in area & laundry room. The 3 bedrooms all have laminate flooring & feature closests. They all share a hall bathroom with a tub/shower combo. Driveway parking in the front & a 1 car garage in the rear. Seller recently updated home with new flooring, new paint inside, some new windows, updated vanity in bath, new cabinets in kitchen, central HVAC & all electric. Home would be a great addition to a rental portfolio!
Key facts
- Open floor plan
- Eat-in kitchen
- Nice-sized yard
Tags
Property features AI
Finance
- Other: Property on approximately 0.46 acre; Fire, garbage, and library fees included
Exterior
- Parking: Driveway parking; Off-street parking
- Utilities: Public water; Connected sewer; Electric water heater; Internet service availability unknown
- Home design: Existing home; Slab foundation; Siding: Hardiplank
- Construction: Hardiplank siding; Slab foundation
- Exterior features: Fireplace (exterior listing notes); No pool, patio, deck, or garden/patio listed; Not waterfront
Interior
- Kitchen: Electric cooktop; Solid surface countertops
- Bedrooms: Three bedrooms on the main level
- Flooring: Hardwood laminate
- Bathrooms: One full bathroom with tub/shower combo
- Heating & cooling: Forced air heating; No central air
- Interior features: Hardwood laminate floors; Ceilings: Other (see remarks); Gas fireplace with insert in the family room; Solid surface kitchen countertops; Cooktop (electric)
- Laundry & utility: Main-level laundry in a closet; Washer hookup; Electric dryer hookup
Neighborhood map
What this means for you Summary
Snapshot
- This is a 3-bed/1.0-bath single-family listed at $71k.
Deal economics
- At list price, monthly cash flow is $422 ($5k/yr) — positive.
- The deal already cash-flows at list — no discount required.
- Meets the 1% rule at list price ($1k rent vs $71k).
- Cap rate 13.4% vs local median 6.2% in Birmingham — top-decile yield for the area; either an underpriced asset or a hidden risk that comps aren't pricing in. Stress-test before assuming the spread holds.
Location & tenants
- Location reads 67/100 on livability (#78 in AL) — a middle-class / working-renter tenant base. Strengths: commute A+, cost of living A+, housing A+; Watch: amenities C-, crime F, employment F.
- Birmingham City (urban): math 4% / reading 20% proficiency, ranked #116 of 129 in AL (top 90%) — low school quality limits family demand, transient renter base, plan for 1-2y turnover; 82% free/reduced lunch — lower-income household profile, screen leases tightly.
- Zoned schools: Wylam Elementary School (math 2% / reading 12%, grade F, #601 of 627 statewide, top 98%, 371 students, 89% FRL).
- Market conditions: 42 active listings in the ZIP; 18 comparable units currently listed for rent nearby; rentals lingering (median 44d on market — plan ~5-8 weeks vacancy on turnover, expect pricing pressure); 56% of comp listings sitting > 30 days — soft ceiling on asking rent; 2,114 units permitted in Jefferson County in 2024 (556 in 5+ unit buildings).
Forward outlook
- Local home prices are declining (-3.0%/yr); year-one equity from $490 of loan paydown is wiped out by about $2k of value loss. Plan a longer hold.
- Jefferson County population projected to shrink 4% by 2050 — rents likely to lag national; underwrite the cash flow, not the appreciation.
- At projected returns (-3.0% appreciation + 3.0% rent growth), your $20k cash investment doubles in ~5 years — after that, you're playing with house money.
Negotiation context
- Only 8 days on market — expect competitive offers; lowballing is unlikely to land.
- 4 sale attempts with the ask held roughly flat each time — persistent listings suggest the price (not the market) is what's stuck; bring a comps-based counter.
Risks & watch-outs
- Watch-outs: built in 1939 — expect roof / HVAC / electrical / plumbing capex.
- Climate carrying-cost: major wind risk, 27% chance of damaging wind over 30y; extreme-heat days projected 7→18/yr by 2055 (HVAC capex compounding) — expect insurance premiums to compound above CPI over the hold.
Questions for the listing agent
- Built in 1939 — when were the roof, HVAC, electrical panel, plumbing, and water heater last replaced?
- Is there a deadline driving the sale (1031 exchange, divorce, estate, relocation)? That informs how much negotiation room exists.
- Schools are F-rated, which usually means shorter tenancies and higher turnover. Who's the typical renter profile here, and what's been the actual vacancy rate?
- Crime grade is F in this area — have there been break-ins, vandalism, or insurance claims at this property in the last 3 years? What carrier currently insures it and at what premium?
- What's the average days-on-market for RENTAL listings here right now (not sales)? A rising rental-DOM trend means longer vacancies and softer asking-rent achievability than the comps imply.
- What's the recent tenant-quality profile in this submarket — average credit score on applications, eviction rate, late-payment / NSF rate, and stable-employment percentage? A property-management company in the area should have these aggregated.
- How much new for-sale + rental construction is in the pipeline within 1–3 miles? Heavy new supply typically softens prices + rents 12–24 months out; constrained supply supports both.
Investment metrics
- 1% rule
- 1.64% ✓
- Cap rate
- 13.43%
- Cash-on-cash
- 25.49%
- DSCR
- 2.13
- GRM
- 5.1
CMA / ARV
- ARV (on-the-fly)
- $62,640
- Comps found
- 8
Show comp detail 8 sales within ~0.75 mi
| Address | Dist | Beds/Ba | Sqft | Sold | Price | $/sf | Match |
|---|---|---|---|---|---|---|---|
| 5223 Loop Rd | 0.00mi | 3/1.0 | 1,392 (0%) | 15mo | $76,500 | $55 | 88 |
| 401 Lexington St | 0.41mi | 3/1.0 | 1,410 (+1%) | 12mo | $60,000 | $43 | 69 |
| 405 Nevada St | 0.27mi | 4/1.5 (+1) | 1,500 (+8%) | 10mo | $55,000 | $37 | 59 |
| 304 Lexington St | 0.41mi | 3/1.0 | 1,334 (-4%) | 20mo | $42,000 | $31 | 57 |
| 1216 Portland St | 0.54mi | 3/1.0 | 1,351 (-3%) | 19mo | $121,000 | $90 | 54 |
| 5224 8th Ave | 0.24mi | 2/1.0 (-1) | 1,200 (-14%) | 21mo | $15,000 | $13 | 43 |
| 325 Memphis St | 0.35mi | 3/1.0 | 1,594 (+14%) | 21mo | $80,000 | $50 | 42 |
| 4317 5th Ct | 0.72mi | 4/2.0 (+1) | 1,563 (+12%) | 24mo | $70,000 | $45 | 18 |
Match score weights: distance 35% · size 25% · config 20% · recency 20%. Top-matched comps best support the ARV.
Projected returns pro-forma
-3.0% appreciation · 3.0% rent growth · sell at horizon
- IRR
- 19.1%
- Equity multiple
- 1.78×
- Total profit
- $15,388
- Equity at exit
- $10,571
- IRR
- 27.4%
- Equity multiple
- 3.42×
- Total profit
- $48,065
- Equity at exit
- $6,130
Cash invested: $19,852 (down + closing). Projections, not guarantees.
Landlord ↔ Tenant lean methodology
- Overall (STATE)
- 90 Strongly Landlord-Friendly
- State Alabama
- 90 Strongly Landlord-Friendly · R+15
- County
- — inherits STATE
- City
- — inherits STATE
ZIP-level market 35224
- Home prices YoY
- -16.2%
- Active inventory
- 42
- Price-to-rent
- 5.1×
Monthly cashflow live
- Estimated rent
- $1,161 high interval (Pro) →
- Mortgage (P&I)
- −$372
- Tax from tax record
- −$94 /mo · $1,128/yr
- Insurance
- −$30
- HOA
- −$0
- Vacancy / Maint / Mgmt
- −$244
- Net cashflow
- $422
Break-even live
UW: 25.0% down · 7.5% · 30yr · 1.5% tax · 5.0% vac · 8.0% maint · 8.0% mgmt
Financing live
Cash to close
- Down payment
- $17,725
- Closing costs
- $2,127
- Reserves months
- —
- Total cash needed
- —
Loan-product check · same deal, 3 products live
Conventional
25% down · 7.5% · 30yr
- Down + closing
- —
- Monthly P&I
- —
- Monthly cashflow
- —
- DSCR
- —
- Eligible?
- —
Personal DTI + credit; lowest rate.
DSCR
20% down · 8.5% · 30yr
- Down + closing
- —
- Monthly P&I
- —
- Monthly cashflow
- —
- DSCR
- —
- Eligible?
- —
No personal income docs; deal must DSCR.
Hard money
10% down · 12.0% · 12mo
- Down + closing
- —
- Monthly P&I
- —
- Monthly cashflow
- —
- DSCR
- —
- Eligible?
- —
Short-term bridge; refi at stabilization.
Rent comps 18 comps
| Address | Beds | Baths | Sqft | Rent | $/sqft | DOM | Units | Dist |
|---|---|---|---|---|---|---|---|---|
| 5223 Loop Rd Birmingham, AL | 3.0 | 1.0 | 1392 | $1,100 | $0.79 | 43d | 1 | 0.02mi |
| 528 Oregon St Birmingham, AL | 3.0 | 1.0 | 1165 | $1,200 | $1.03 | 43d | 1 | 0.11mi |
| 229 Oregon St Birmingham, AL | 3.0 | 1.0 | 1044 | $1,200 | $1.15 | 16d | 1 | 0.28mi |
| 229 Oregon St Birmingham, AL | 3.0 | 1.0 | 1044 | $1,200 | $1.15 | 14d | 1 | 0.28mi |
| 304 Nevada St Birmingham, AL | 3.0 | 1.0 | 1160 | $1,200 | $1.03 | 43d | 1 | 0.29mi |
| 761 Crowne Rd Birmingham, AL | 3.0 | 2.0 | 1068 | $1,200 | $1.12 | 2d | 1 | 0.31mi |
| 604 Lexington St Birmingham, AL | 3.0 | 1.5 | 993 | $1,200 | $1.21 | 43d | 1 | 0.37mi |
| 4623 6th Ave Birmingham, AL | 3.0 | 1.0 | 1421 | $1,175 | $0.83 | 11d | 1 | 0.48mi |
| 538 Gulfport St Birmingham, AL | 3.0 | 1.0 | 1036 | $850 | $0.82 | 43d | 1 | 0.77mi |
| 1400 Indiana St Birmingham, AL | 3.0 | 1.0 | 1020 | $1,200 | $1.18 | 43d | 1 | 0.90mi |
| 1300 Gulfport St Birmingham, AL | 3.0 | 2.0 | 1778 | $1,200 | $0.67 | 43d | 1 | 0.94mi |
| 1312 Gulfport St Birmingham, AL | 3.0 | 1.5 | 1376 | $1,100 | $0.80 | 43d | 1 | 0.96mi |
| 1226 Frisco St Birmingham, AL | 4.0 | 2.0 | 1232 | $1,245 | $1.01 | 11d | 1 | 0.97mi |
| 1232 Frisco St Birmingham, AL | 4.0 | 2.0 | 1332 | $1,295 | $0.97 | 2d | 1 | 0.98mi |
| 1221 Frisco St Birmingham, AL | 2.0 | 1.0 | 934 | $950 | $1.02 | 43d | 1 | 0.98mi |
| 1300 Yukon St Birmingham, AL | 3.0 | 2.0 | 1038 | $1,125 | $1.08 | 43d | 1 | 1.37mi |
| 5804 Norway Ave Birmingham, AL | 2.0 | 2.0 | 1564 | $1,200 | $0.77 | 23d | 1 | 1.38mi |
| 4800 Norway Ave Birmingham, AL | 3.0 | 1.0 | 1080 | $1,200 | $1.11 | 2d | 1 | 1.42mi |
Listing history 6 events
-
2026-06-18days on market $70,900 Active 8 DOM
-
2026-06-17days on market $70,900 Active 7 DOM
-
2026-06-16days on market $70,900 Active 6 DOM
-
2026-06-15days on market $70,900 Active 5 DOM
-
2026-06-13remarks 374-char remark
-
2026-06-13$70,900 Active 3 DOM
ⓘ Source: listings_history table (triggers on properties + properties_extension) + one-shot
backfill from property_details.listing_events for pre-trigger history.
Tax reassessment forecast AL · Resets to sale price
- Current annual tax
- $1,128 · $94/mo
- Projected year-2 tax
- $1,128 · $94/mo
- Expected delta
- $0/yr ($0/mo · 0.0%)
ⓘ Screening estimate from a state-policy table — verify with the county assessor before closing.
Climate risk First Street
- Flood 1/10 Low FEMA zone X (unshaded) · 0% chance over 30 yrs
- Wildfire 4/10 Moderate
- Heat 6/10 Major 7 d/yr ≥107°F today · 18 d/yr by 30 yrs out
- Wind 6/10 Major 27% chance of damaging wind over 30 yrs
- Air quality 4/10 Moderate 5 unhealthy d/yr today · 5 by 30 yrs out
Nearby sold comps map
Loading sold comps map…
Walkable amenities ~0.75 mi
Loading nearby amenities…
Taxation est. · year 1
- Rental income
- $13,929
- − Mortgage interest
- −$3,972
- − Property taxes
- −$1,128
- − Insurance
- −$354
- − Repairs & maintenance
- −$1,114
- − Management
- −$1,114
- − Depreciation
- −$2,063
- Taxable income
- $4,184
- Est. tax owed @ 24.0%
- −$1,004
- After-tax cash flow
- $4,056/yr
For passive investors: Depreciation is non-cash, so a rental often shows a tax loss while cash-flowing — sheltering income. Rental losses are passive: they offset passive income freely, and up to $25,000/yr can offset ordinary (W-2) income if you actively participate and your MAGI is under $100k (phasing out to $0 by $150k); unused losses carry forward. On sale, claimed depreciation is recaptured at up to 25%, and gains may owe capital-gains tax (a 1031 exchange can defer both). Figures are a year-1 estimate at your 24.0% rate — not tax advice; consult a CPA.
Schools (NCES district)
- District
- Birmingham City
- NCES district ID
- 0100390
- Math proficiency
- 4% ▼ -17.00%
- Reading proficiency
- 20% ▼ -4.00%
- Median HH income
- $31,988
- Composite
- 9.49/100
- National rank
- #9850
- State rank
- #116 of 129 in AL
Livability — Birmingham
- Score
- 67/100
- State rank
- #78
- US rank
- #10412
Category grades
Schools grade is shown separately in the Schools card above.
Census & demographics
- Census place
- Birmingham, AL
- City population
- 210,422
- Population (ZIP)
- 5,409
Population outlook (Jefferson County) Hauer SSP2
- Today (2025)
- 669,185 people
- By 2030
- 669,694 · +0.1%
- By 2040
- 661,388 · -1.2%
- By 2050
- 643,086 · -3.9%
- By 2075
- 577,267 · -13.7%
- By 2100
- 474,758 · -29.1%
Race, ethnicity, and origin ACS 2023
- Neighborhood character
- Predominantly Black (69%)
- Race & ethnicity
- Black 69% White 22% Two or more races 5% Hispanic / Latino 3% Native American 1%
- Common ancestry
- Slovak 0%
- Foreign-born
- 2% · Canada
- Languages at home
- 97% English-only · Spanish 3%
Political lean MEDSL · Jefferson
- 2024 margin
- D (+10.4) · D 54.6% · R 44.2% · Other 1.2%
- 2008→2024 swing
- +5.4pp toward D · 2008: 5.1pp · 2024: 10.4pp
- All cycles
- 2024: D+10.4 2020: D+13.2 2016: D+7.2 2012: D+6.0 2008: D+5.1
Not yet ingested
- Civics
- —
Market trends
- HPI YoY
- ▼ -24.47%
- Current HPI
- 126.3423
- Rent YoY
- —
- Metro
- —
- State GDP YoY
- ▲ 2.94%
- F500 in state
- 4
Industry mix (Fortune 500 HQ in AL)
| Industry | F500 HQs | Revenue |
|---|---|---|
| Financial Services | 1 | $8B |
|
||
| Healthcare | 1 | $5B |
|
||
Price history
+37.4% since first listed16 events — show timeline
- 2026-06-10 Listed $70,900 Greater Alabama MLS
- 2025-12-31 Price Changed $70,000 Greater Alabama MLS
- 2025-11-23 Price Changed $1,100 BUILDIUM
- 2025-11-03 Price Changed $89,000 Greater Alabama MLS
- 2025-09-29 Price Changed $99,000 Greater Alabama MLS
- 2025-08-30 Listed for Rent $1,145 BUILDIUM
- 2025-08-30 Rental Removed $1,145 TENANTTURNER2
- 2025-07-22 Price Changed $1,145 TENANTTURNER2
- 2025-06-21 Price Changed $1,150 TENANTTURNER2
- 2025-05-13 Listed for Rent $1,200 TENANTTURNER2
- 2025-03-25 Sold (Public Records) $76,500 Public Records
- 2025-03-24 Sold (MLS) $76,500 Greater Alabama MLS
- 2025-02-19 Pending — Greater Alabama MLS
- 2025-01-02 Listed $79,000 Greater Alabama MLS
- 2024-06-28 Price Changed $85,000 Greater Alabama MLS
- 2006-06-15 Sold (Public Records) $51,600 Public Records
Property tax history
+4.6%/yrLatest (2025): $1,128 · +0.0% YoY. Source: county tax records.
Cash-flow waterfall
monthlySold comps — $/sqft
last 12 mo · ≤1 miLoading sold comps…