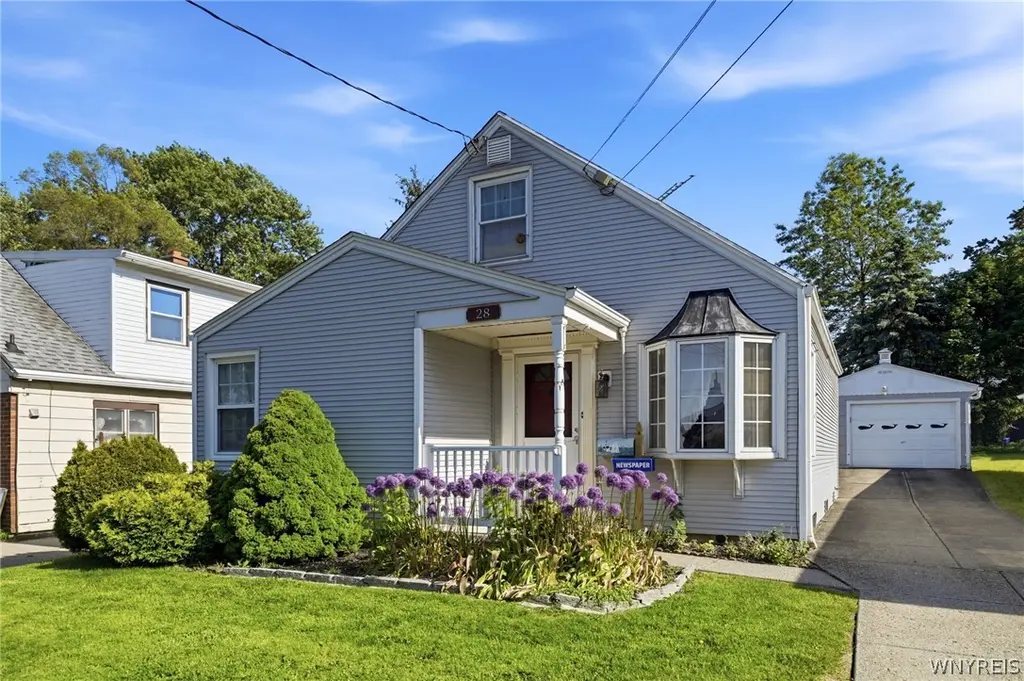
28 Linwood Ave · Tonawanda, NY
Flood risk 1/10 · Minimal
- FEMA flood zone
- X (unshaded)
- Chance of flooding over 30 yrs
- 0.0%
- Est. flood insurance / yr
- $473 – $860
Fire risk 1/10 · Minimal
- Est. fire insurance / yr
- $691 – $1,283
Heat risk 3/10 · Minor
- Hot days now (above 93°F)
- 7 days/yr
- Hot days in 30 yrs
- 15 days/yr
Wind risk 1/10 · Minimal
- Chance of severe wind over 30 yrs
- —
Air-quality risk 3/10 · Minor
- Unhealthy air days now
- 3 days/yr
- Unhealthy air days in 30 yrs
- 4 days/yr
Risk factors via First Street. Map © Google.
Why this score? — see what drove the D+ grade
The composite is a weighted blend of 9 inputs, each scored 0–100. Each bar is that input's sub-score; the figure is the points it added to the 100-point composite (weight × sub-score).
- ARV discount +12.1/15.0
- Cash flow +12.0/30.0
- Livability +4.5/5.0
- Rent growth +4.2/5.0
- DSCR +3.5/10.0
- Schools +3.5/10.0
- 1% rule +3.1/10.0
- Condition / age +2.5/5.0
- Appreciation +0.0/10.0
$209,900
🖨 Deal sheet (PDF) 📄 Offer letter ✓ Due diligence
Listing remarks
Welcome home to this beautifully maintained property in a highly desirable neighborhood! This charming home features 3 spacious bedrooms plus a versatile bonus room, offering flexible space for a home office, playroom, or guest area. Gleaming hardwood floors add warmth and character throughout much of the home. The spacious living room and eat-in kitchen provide plenty of room for everyday living and entertaining. Major updates have already been completed, including the furnace, central air conditioning, hot water tank, electrical system, and windows, giving you added peace of mind. Relax in the rear sunroom overlooking the large backyard, perfect for outdoor gatherings, gardening, or simpl
Key facts
- Rear sunroom
- Eat-in kitchen
- Major updates
Tags
Property features AI
Exterior
- Parking: Detached garage; One garage space
- Utilities: Public water connected; Sewer connected
- Home design: Single-story home; Resale property; Vinyl siding
- Construction: Poured foundation; Vinyl siding exterior
- Exterior features: Concrete driveway; Rectangular residential lot (approx. 40 x 131)
Interior
- Kitchen: Free-standing range; Oven
- Bedrooms: Two main-level bedrooms
- Flooring: Hardwood; Laminate; Varies
- Bathrooms: One full bathroom (main level)
- Heating & cooling: Gas forced-air heating; Central air conditioning
- Interior features: Eat-in kitchen; Main-level primary bedroom; Bedroom on main level; Convertible bedroom; Sunroom / Florida room; Bonus room
- Laundry & utility: Washer and dryer; Laundry located in basement; Gas water heater
Neighborhood map
What this means for you Summary
Snapshot
- This is a 2-bed/1.0-bath single-family listed at $210k.
Deal economics
- At list price, monthly cash flow is $-51 ($-609/yr) — negative.
- To cash-flow at today's rent, offer at most $201k (4.3% below list).
- To meet the 1% rule (rent ≥ 1% of price), the offer needs to be $169k (19.3% below list).
- Recommended offer: $169k (19.3% below list) — sets the bar for 1% rule.
Location & tenants
- Location reads 89/100 on livability (#8 in NY, #169 nationally) — a professional / high-income tenant draw. Strengths: amenities A+, commute A+, cost of living A+.
- Tonawanda City School District (suburban): math 39% / reading 43% proficiency, ranked #508 of 590 in NY (top 86%) — families likely to look elsewhere, expect single-tenant / working-renter base with shorter leases.
- Zoned schools: Mullen Elementary School (math 34% / reading 44%, grade F, #1,444 of 2,108 statewide, top 71%, 303 students, 54% FRL); Fletcher Elementary School (math 27% / reading 37%); Tonawanda Middle/High School (math 49% / reading 43%, grade D-, #1,023 of 1,100 statewide, top 93%, 1,011 students, 46% FRL) — zoned schools average 50% FRL vs 34% district-wide (16 pts higher); higher-poverty schools than district average — tighter screening recommended.
- Market conditions: Rents rising fast (+6.8%/yr); 193 active listings in the ZIP; 7 comparable units currently listed for rent nearby; rentals leasing fast (median 6d on market — plan ~1-2 weeks tenant-placement turnaround); 1,244 units permitted in Erie County in 2024 (563 in 5+ unit buildings).
Forward outlook
- Local home prices are declining (-3.0%/yr); year-one equity from $1k of loan paydown is wiped out by about $6k of value loss. Plan a longer hold.
Negotiation context
- Only 9 days on market — expect competitive offers; lowballing is unlikely to land.
Risks & watch-outs
- Watch-outs: built in 1947 — expect roof / HVAC / electrical / plumbing capex.
Questions for the listing agent
- What do current leases actually rent for vs. the listed asking? Can we see a recent rent roll and the last 12 months of T-12 income?
- Built in 1947 — when were the roof, HVAC, electrical panel, plumbing, and water heater last replaced?
- Is there a deadline driving the sale (1031 exchange, divorce, estate, relocation)? That informs how much negotiation room exists.
- Schools are B-rated — typically a magnet for longer-tenancy family renters. What's the average tenant stay here, and is there a school-zone premium baked into asking?
- The area grade is low — what's the realistic commute time and amenity access for the typical tenant pool here? Any planned neighborhood developments (good or bad) we should know about?
- What's the average days-on-market for RENTAL listings here right now (not sales)? A rising rental-DOM trend means longer vacancies and softer asking-rent achievability than the comps imply.
- What's the recent tenant-quality profile in this submarket — average credit score on applications, eviction rate, late-payment / NSF rate, and stable-employment percentage? A property-management company in the area should have these aggregated.
- How much new for-sale + rental construction is in the pipeline within 1–3 miles? Heavy new supply typically softens prices + rents 12–24 months out; constrained supply supports both.
Investment metrics
- 1% rule
- 0.81% ✗
- Cap rate
- 6.00%
- Cash-on-cash
- -1.04%
- DSCR
- 0.95
- GRM
- 10.3
CMA / ARV
- ARV (on-the-fly)
- $233,874
- Comps found
- 12
Show comp detail 12 sales within ~0.75 mi
| Address | Dist | Beds/Ba | Sqft | Sold | Price | $/sf | Match |
|---|---|---|---|---|---|---|---|
| 18 Joseph Dr | 0.48mi | 2/1.0 | 1,096 (-0%) | 3mo | $295,000 | $269 | 75 |
| 30 Bannard Ave | 0.43mi | 2/1.0 | 1,032 (-6%) | 2mo | $220,000 | $213 | 68 |
| 53 Winkler Dr | 0.46mi | 3/1.0 (+1) | 1,060 (-4%) | 2mo | $210,000 | $198 | 66 |
| 299 Newell Ave | 0.59mi | 3/1.0 (+1) | 1,103 (+0%) | 2mo | $255,299 | $231 | 65 |
| 157 Newell Ave | 0.43mi | 3/1.0 (+1) | 1,131 (+3%) | 8mo | $269,900 | $239 | 64 |
| 20 Nicholas Dr N | 0.57mi | 3/1.0 (+1) | 1,108 (+1%) | 5mo | $160,000 | $144 | 62 |
| 128 Bannard Ave | 0.44mi | 2/1.5 | 972 (-12%) | 6mo | $168,500 | $173 | 53 |
| 23 Winkler Dr | 0.51mi | 3/1.0 (+1) | 1,060 (-4%) | 17mo | $215,000 | $203 | 52 |
| 81 Winkler Dr | 0.41mi | 3/1.5 (+1) | 1,212 (+10%) | 6mo | $257,500 | $212 | 51 |
| 205 Bannard Ave | 0.53mi | 3/1.0 (+1) | 999 (-9%) | 8mo | $186,500 | $187 | 49 |
| 346 Maldiner Ave | 0.56mi | 3/1.5 (+1) | 999 (-9%) | 9mo | $280,000 | $280 | 44 |
| 236 Newell Ave | 0.48mi | 3/1.0 (+1) | 999 (-9%) | 16mo | $237,000 | $237 | 44 |
Match score weights: distance 35% · size 25% · config 20% · recency 20%. Top-matched comps best support the ARV.
Projected returns pro-forma
-3.0% appreciation · 6.75% rent growth · sell at horizon
- IRR
- -14.1%
- Equity multiple
- 0.48×
- Total profit
- $-30,623
- Equity at exit
- $31,297
- IRR
- -0.3%
- Equity multiple
- 0.98×
- Total profit
- $-1,461
- Equity at exit
- $18,148
Cash invested: $58,772 (down + closing). Projections, not guarantees.
Landlord ↔ Tenant lean methodology
- Overall (STATE)
- 15 Strongly Tenant-Friendly
- State New York
- 15 Strongly Tenant-Friendly · D+10
- County
- — inherits STATE
- City
- — inherits STATE
ZIP-level market 14150
- Rents YoY
- 6.8%
- Active inventory
- 193
- Price-to-rent
- 10.3×
Monthly cashflow live
- Estimated rent
- $1,695 high interval (Pro) →
- Mortgage (P&I)
- −$1,101
- Tax from tax record
- −$201 /mo · $2,417/yr
- Insurance
- −$87
- HOA
- −$0
- Vacancy / Maint / Mgmt
- −$356
- Net cashflow
- $-51
Break-even live
Sensitivity live
| Price | -10% $68 | -5% $9 | +0% $-51 | +5% $-110 | +10% $-170 |
|---|---|---|---|---|---|
| Rent | -10% $-185 | -5% $-118 | +0% $-51 | +5% $16 | +10% $83 |
| Rate | -1.0pp $55 | -0.5pp $3 | base $-51 | +0.5pp $-105 | +1.0pp $-160 |
UW: 25.0% down · 7.5% · 30yr · 1.5% tax · 5.0% vac · 8.0% maint · 8.0% mgmt
Financing live
Cash to close
- Down payment
- $52,475
- Closing costs
- $6,297
- Reserves months
- —
- Total cash needed
- —
Loan-product check · same deal, 3 products live
Conventional
25% down · 7.5% · 30yr
- Down + closing
- —
- Monthly P&I
- —
- Monthly cashflow
- —
- DSCR
- —
- Eligible?
- —
Personal DTI + credit; lowest rate.
DSCR
20% down · 8.5% · 30yr
- Down + closing
- —
- Monthly P&I
- —
- Monthly cashflow
- —
- DSCR
- —
- Eligible?
- —
No personal income docs; deal must DSCR.
Hard money
10% down · 12.0% · 12mo
- Down + closing
- —
- Monthly P&I
- —
- Monthly cashflow
- —
- DSCR
- —
- Eligible?
- —
Short-term bridge; refi at stabilization.
Rent comps 7 comps
| Address | Beds | Baths | Sqft | Rent | $/sqft | DOM | Units | Dist |
|---|---|---|---|---|---|---|---|---|
| 53 Winkler Dr Tonawanda, NY | 3.0 | 1.0 | 1060 | $2,100 | $1.98 | 13d | 1 | 0.44mi |
| 4-18 Concord Ct Tonawanda, NY | 1.0 | 1.0 | 730 | $1,395 | $1.91 | 5d | 1 | 0.78mi |
| 285 Crestmount Ave Tonawanda, NY | 1.0–2.0 | 1.0 | 725 | $1,905 | $2.63 | 0d | 9 | 0.78mi |
| 115 Klinger Ave Tonawanda, NY | 3.0 | 1.0 | 1200 | $1,450 | $1.21 | 5d | 1 | 0.79mi |
| 184 Sweeney St North Tonawanda, NY | 2.0 | 2.0 | 1155 | $2,000 | $1.73 | 0d | 1 | 1.19mi |
| 330 E Niagara St Tonawanda, NY | 2.0 | 2.0 | 1075 | $1,775 | $1.65 | 0d | 1 | 1.23mi |
| 1835 Military Rd Buffalo, NY | 2.0 | 1.0 | 1064 | $2,175 | $2.04 | 19d | 1 | 1.41mi |
Listing history 8 events
-
2026-06-13statusdays on market $209,900 Pending 9 DOM
-
2026-06-10days on market $209,900 Active 7 DOM
-
2026-06-09days on market $209,900 Active 6 DOM
-
2026-06-08days on market $209,900 Active 5 DOM
-
2026-06-07remarks 699-char remark
-
2026-06-07days on market $209,900 Active 4 DOM
-
2026-06-05remarks 696-char remark
-
2026-06-05$209,900 Active 1 DOM
ⓘ Source: listings_history table (triggers on properties + properties_extension) + one-shot
backfill from property_details.listing_events for pre-trigger history.
Tax reassessment forecast NY · Partial reset (capped growth)
- Current annual tax
- $2,417 · $201/mo
- Projected year-2 tax
- $2,982 · $249/mo
- Expected delta
- +$565/yr (+$47/mo · 23.4%)
ⓘ Screening estimate from a state-policy table — verify with the county assessor before closing.
Climate risk First Street
- Flood 1/10 Low FEMA zone X (unshaded) · 0% chance over 30 yrs
- Wildfire 1/10 Low
- Heat 3/10 Moderate 7 d/yr ≥93°F today · 15 d/yr by 30 yrs out
- Wind 1/10 Low
- Air quality 3/10 Moderate 3 unhealthy d/yr today · 4 by 30 yrs out
Nearby sold comps map
Loading sold comps map…
Walkable amenities ~0.75 mi
Loading nearby amenities…
Taxation est. · year 1
- Rental income
- $20,337
- − Mortgage interest
- −$11,758
- − Property taxes
- −$2,417
- − Insurance
- −$1,050
- − Repairs & maintenance
- −$1,627
- − Management
- −$1,627
- − Depreciation
- −$6,106
- Taxable loss
- −$4,247
- Est. tax savings @ 24.0%
- +$1,019
- After-tax cash flow
- $410/yr
For passive investors: Depreciation is non-cash, so a rental often shows a tax loss while cash-flowing — sheltering income. Rental losses are passive: they offset passive income freely, and up to $25,000/yr can offset ordinary (W-2) income if you actively participate and your MAGI is under $100k (phasing out to $0 by $150k); unused losses carry forward. On sale, claimed depreciation is recaptured at up to 25%, and gains may owe capital-gains tax (a 1031 exchange can defer both). Figures are a year-1 estimate at your 24.0% rate — not tax advice; consult a CPA.
Schools (NCES district)
- District
- Tonawanda City School District
- NCES district ID
- 3628740
- Math proficiency
- 39% ▼ -19.00%
- Reading proficiency
- 43% ▼ -7.00%
- Median HH income
- $47,061
- Composite
- 35.03/100
- National rank
- #5041
- State rank
- #508 of 590 in NY
Livability — Tonawanda
- Score
- 89/100
- State rank
- #8
- US rank
- #169
Category grades
Schools grade is shown separately in the Schools card above.
Census & demographics
- Census place
- Tonawanda, NY
- County
- Erie County · 714,559 people
- City population
- 41,260
- Metro
- Buffalo-Cheektowaga, NY
- Population (ZIP)
- 41,260
- Household income
- $71,406
- Rent vs Own
- Severe rent burden
- 1427.0
Population outlook (Erie County) Hauer SSP2
- Today (2025)
- 933,037 people
- By 2030
- 935,181 · +0.2%
- By 2040
- 928,531 · -0.5%
- By 2050
- 905,725 · -2.9%
- By 2075
- 834,037 · -10.6%
- By 2100
- 708,033 · -24.1%
Race, ethnicity, and origin ACS 2023
- Neighborhood character
- Predominantly White (87%)
- Race & ethnicity
- White 87% Two or more races 5% Hispanic / Latino 5% Black 4% Asian 2%
- Common ancestry
- Romanian 13% Lithuanian 3% Slovak 2%
- Foreign-born
- 6% · Canada, Philippines, Vietnam
- Languages at home
- 94% English-only · Other Indo-European 2% Spanish 1% Russian/Polish/Slavic 1%
Political lean MEDSL · Erie
- 2024 margin
- Lean D (+9.7) · D 54.8% · R 45.2%
- 2008→2024 swing
- -7.9pp toward R · 2008: 17.5pp · 2024: 9.7pp
- All cycles
- 2024: D+9.7 2020: D+14.7 2016: D+4.8 2012: D+15.6 2008: D+17.5
Not yet ingested
- Civics
- —
Market trends
- HPI YoY
- ▼ -260.43%
- Current HPI
- 334.5893
- Rent YoY
- ▲ 6.75%
- Metro
- Buffalo-Cheektowaga, NY
- State GDP YoY
- ▲ 2.60%
- F500 in state
- 92
Industry mix (Fortune 500 HQ in NY)
| Industry | F500 HQs | Revenue |
|---|---|---|
| Financial Services | 10 | $950B |
|
||
| Consumer Goods | 9 | $162B |
|
||
| Insurance | 4 | $225B |
|
||
| Telecommunications | 2 | $144B |
|
||
| Pharmaceuticals | 2 | $112B |
|
||
| Media / Entertainment | 2 | $69B |
|
||
Price history
1 event — show timeline
- 2026-06-03 Listed $209,900 WNYREIS
Property tax history
+8.8%/yrLatest (2025): $2,417 · +3.4% YoY. Source: county tax records.
Cash-flow waterfall
monthlySold comps — $/sqft
last 12 mo · ≤1 miLoading sold comps…