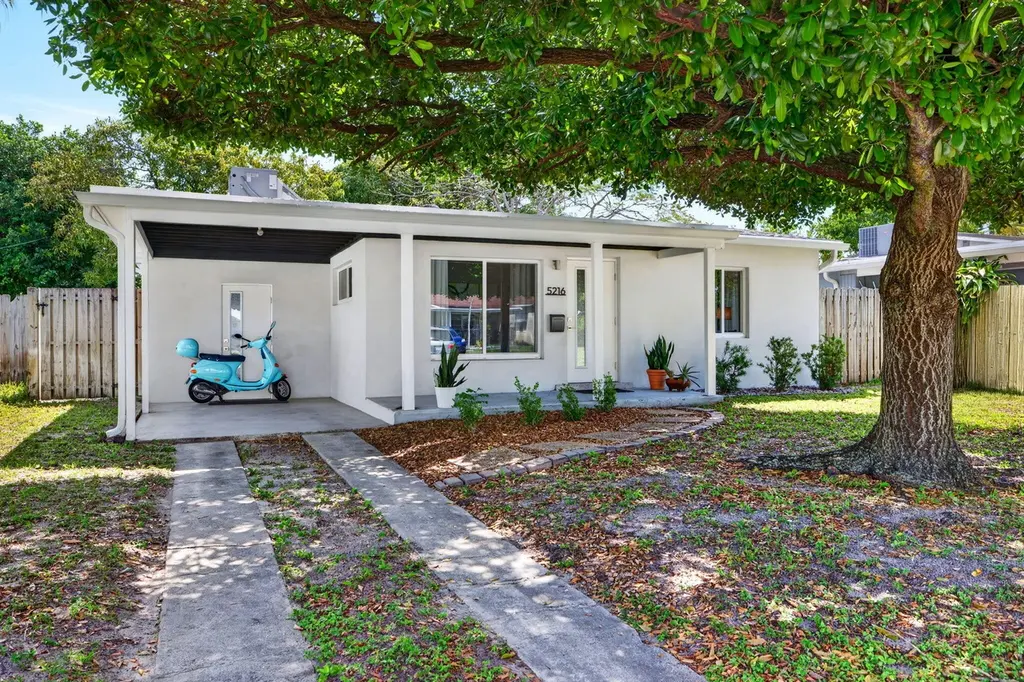
5216 NE 2nd Ter · Oakland Park, FL
Flood risk 1/10 · Minimal
- FEMA flood zone
- X (shaded)
- Chance of flooding over 30 yrs
- 0.0%
- Est. flood insurance / yr
- $507 – $1,088
Fire risk 1/10 · Minimal
- Est. fire insurance / yr
- $947 – $1,759
Heat risk 10/10 · Severe
- Hot days now (above 106°F)
- 7 days/yr
- Hot days in 30 yrs
- 26 days/yr
Wind risk 10/10 · Severe
- Chance of severe wind over 30 yrs
- 99.0%
Air-quality risk 2/10 · Minimal
- Unhealthy air days now
- 1 days/yr
- Unhealthy air days in 30 yrs
- 2 days/yr
Risk factors via First Street. Map © Google.
Why this score? — see what drove the C grade
The composite is a weighted blend of 9 inputs, each scored 0–100. Each bar is that input's sub-score; the figure is the points it added to the 100-point composite (weight × sub-score).
- Cash flow +20.1/30.0
- ARV discount +15.0/15.0
- DSCR +6.4/10.0
- 1% rule +4.3/10.0
- Schools +4.1/10.0
- Livability +3.9/5.0
- Rent growth +3.0/5.0
- Condition / age +2.5/5.0
- Appreciation +0.0/10.0
$350,000
🖨 Deal sheet 📄 Offer letter ✓ Due diligence
Listing remarks MLS
SHORT SALE APPROVED WITH LAST BUYER WHO DIDNT GET MORTGAGE AT LIST PRICE. NEEDS UPDATING. ELECTRIC W/ BRAKERS AND UTILITY ROOM IN HOUSE. GREAT STREET.
Key facts
- Farm-style sink
- Shaker-style doors
- Recessed lighting
Tags
Property features AI
Finance
- Other: Property listed as resale; Living area reported as 828 (assessor source)
Exterior
- Parking: Total 3 parking spaces; Attached carport (1 covered carport space); Driveway and on-street parking; 2 open parking spaces
- Utilities: Public water; Public sewer; Electricity connected; Water connected; Sewer connected; Cable available
- Home design: Single family residence; One-level home (entry level 1); Faces west; Flat and shingle roof
- Construction: Stucco and CBS construction
- Exterior features: Shed on the property; Back yard fenced with wood fencing; Many trees and fruit trees; Room for a pool; Oversized lot; Asphalt road frontage (public maintained); Not waterfront
Interior
- Kitchen: Electric range; Refrigerator; ENERGY STAR qualified refrigerator
- Bedrooms: 2 bedrooms on the main level
- Flooring: Terrazzo floors
- Bathrooms: 1 full bathroom on the main level
- Heating & cooling: Central electric heating; Central electric cooling (central air)
- Interior features: Bedroom layout is stacked; Updated/remodeled condition; ENERGY STAR qualified appliances and windows
- Laundry & utility: In-unit laundry room on the main level; Washer hookup; Electric dryer hookup; ENERGY STAR qualified washer; ENERGY STAR qualified dryer; Electric water heater (owned)
Neighborhood map
What this means for you Summary
Snapshot
- This is a 2-bed/1.0-bath single-family listed at $350k.
Deal economics
- At list price, monthly cash flow is $435 ($5k/yr) — positive.
- The deal already cash-flows at list — no discount required.
- To meet the 1% rule (rent ≥ 1% of price), the offer needs to be $325k (7.2% below list).
- Recommended offer: $325k (7.2% below list) — sets the bar for 1% rule.
- Cap rate 7.8% vs local median 3.8% in Oakland Park — top-decile yield for the area; either an underpriced asset or a hidden risk that comps aren't pricing in. Stress-test before assuming the spread holds.
Location & tenants
- Location reads 77/100 on livability (#193 in FL, #3,082 nationally) — a middle-class / working-renter tenant base. Strengths: commute A+, housing A+, health & safety A+; Watch: amenities F.
- Broward (suburban): math 42% / reading 53% proficiency, ranked #46 of 73 in FL (top 63%) — families likely to look elsewhere, expect single-tenant / working-renter base with shorter leases.
- Zoned schools: North Andrews Gardens Elementary School (math 40% / reading 48%, grade F, #1,330 of 2,144 statewide, top 63%, 780 students, 77% FRL); James S. Rickards Middle School (math 18% / reading 31%, grade F, #522 of 571 statewide, top 93%, 755 students, 75% FRL); Northeast High School (math 12% / reading 37%, grade F, #505 of 667 statewide, top 79%, 1,552 students, 69% FRL) — zoned schools average 74% FRL vs 51% district-wide (23 pts higher); higher-poverty schools than district average — tighter screening recommended.
- Zoned-school proficiency averages 31% at this address vs 48% district-wide (-16 pts) — the specific schools serving this property underperform the Broward average; the district grade overstates school quality for this exact location.
- Market conditions: Rents rising (+2.0%/yr); 355 active listings in the ZIP; 12 comparable units currently listed for rent nearby; rentals at typical pace (median 24d on market — plan ~3-4 weeks tenant-placement turnaround); solid renter incomes; 2,111 units permitted in Broward County in 2024 (1,265 in 5+ unit buildings).
Forward outlook
- Local home prices are declining (-3.0%/yr); year-one equity from $2k of loan paydown is wiped out by about $10k of value loss. Plan a longer hold.
- Broward County population projected at +34% by 2050 — long-run rental-demand tailwind backs the buy-and-hold thesis.
Negotiation context
- Only 3 days on market — expect competitive offers; lowballing is unlikely to land.
- 2 sale attempts since 16y ago with the ask held roughly flat each time — persistent listings suggest the price (not the market) is what's stuck; bring a comps-based counter.
- Current owner paid $162k; list at $350k implies a 116% gain — meaningful room to come down on a strong offer.
Risks & watch-outs
- Watch-outs: built in 1956 — expect roof / HVAC / electrical / plumbing capex.
- Climate carrying-cost: severe wind risk, 99% chance of damaging wind over 30y; extreme-heat days projected 7→26/yr by 2055 (HVAC capex compounding) — expect insurance premiums to compound above CPI over the hold.
Questions for the listing agent
- Built in 1956 — when were the roof, HVAC, electrical panel, plumbing, and water heater last replaced?
- Is there a deadline driving the sale (1031 exchange, divorce, estate, relocation)? That informs how much negotiation room exists.
- Schools are D-rated, which usually means shorter tenancies and higher turnover. Who's the typical renter profile here, and what's been the actual vacancy rate?
- What's the average days-on-market for RENTAL listings here right now (not sales)? A rising rental-DOM trend means longer vacancies and softer asking-rent achievability than the comps imply.
- What's the recent tenant-quality profile in this submarket — average credit score on applications, eviction rate, late-payment / NSF rate, and stable-employment percentage? A property-management company in the area should have these aggregated.
- How much new for-sale + rental construction is in the pipeline within 1–3 miles? Heavy new supply typically softens prices + rents 12–24 months out; constrained supply supports both.
Investment metrics
- 1% rule
- 0.93% ✗
- Cap rate
- 7.78%
- Cash-on-cash
- 5.33%
- DSCR
- 1.24
- GRM
- 9.0
CMA / ARV
- ARV (on-the-fly)
- $485,208
- Comps found
- 2
Show comp detail 2 sales within ~0.75 mi
| Address | Dist | Beds/Ba | Sqft | Sold | Price | $/sf | Match |
|---|---|---|---|---|---|---|---|
| 230 NE 51st Ct | 0.07mi | 3/2.0 (+1) | 828 (0%) | 15mo | $485,000 | $586 | 75 |
| 5324 NE 3rd Ter | 0.18mi | 2/1.0 | 916 (+11%) | 2mo | $350,000 | $382 | 72 |
Match score weights: distance 35% · size 25% · config 20% · recency 20%. Top-matched comps best support the ARV.
Projected returns pro-forma
-3.0% appreciation · 2.01% rent growth · sell at horizon
- IRR
- -9.1%
- Equity multiple
- 0.67×
- Total profit
- $-32,335
- Equity at exit
- $52,186
- IRR
- -0.9%
- Equity multiple
- 0.94×
- Total profit
- $-5,880
- Equity at exit
- $30,262
Cash invested: $98,000 (down + closing). Projections, not guarantees.
Landlord ↔ Tenant lean methodology
- Overall (STATE)
- 87 Strongly Landlord-Friendly
- State Florida
- 87 Strongly Landlord-Friendly · R+3
- County
- — inherits STATE
- City
- — inherits STATE
ZIP-level market 33334
- Home prices YoY
- -34.6%
- Rents YoY
- 2.0%
- Active inventory
- 355
- Price-to-rent
- 9.0×
Monthly cashflow live
- Estimated rent
- $3,248 high interval (Pro) →
- Mortgage (P&I)
- −$1,835
- Tax from tax record
- −$149 /mo · $1,794/yr
- Insurance
- −$146
- HOA
- −$0
- Vacancy / Maint / Mgmt
- −$682
- Net cashflow
- $435
Break-even live
UW: 25.0% down · 7.5% · 30yr · 1.5% tax · 5.0% vac · 8.0% maint · 8.0% mgmt
Financing live
Cash to close
- Down payment
- $87,500
- Closing costs
- $10,500
- Reserves months
- —
- Total cash needed
- —
Loan-product check · same deal, 3 products live
Conventional
25% down · 7.5% · 30yr
- Down + closing
- —
- Monthly P&I
- —
- Monthly cashflow
- —
- DSCR
- —
- Eligible?
- —
Personal DTI + credit; lowest rate.
DSCR
20% down · 8.5% · 30yr
- Down + closing
- —
- Monthly P&I
- —
- Monthly cashflow
- —
- DSCR
- —
- Eligible?
- —
No personal income docs; deal must DSCR.
Hard money
10% down · 12.0% · 12mo
- Down + closing
- —
- Monthly P&I
- —
- Monthly cashflow
- —
- DSCR
- —
- Eligible?
- —
Short-term bridge; refi at stabilization.
Rent comps 12 comps
| Address | Beds | Baths | Sqft | Rent | $/sqft | DOM | Units | Dist |
|---|---|---|---|---|---|---|---|---|
| 5365 N Andrews Ave Fort Lauderdale, FL | 3.0 | 2.0 | 1016 | $3,500 | $3.44 | 24d | 1 | 0.28mi |
| 4601 NE 4th Ave Unit 1261561P Fort Lauderdale, FL | 3.0 | 2.0 | 1097 | $4,430 | $4.04 | 24d | 1 | 0.53mi |
| 5841 NE 3rd Ave Fort Lauderdale, FL | 3.0 | 2.0 | 834 | $3,200 | $3.84 | 24d | 1 | 0.60mi |
| 261 NE 45th St Fort Lauderdale, FL | 3.0 | 2.0 | 997 | $3,247 | $3.26 | 24d | 1 | 0.60mi |
| 540 NE 59th Ct Fort Lauderdale, FL | 3.0 | 2.0 | 964 | $3,400 | $3.53 | 24d | 1 | 0.72mi |
| 351 NE 41st St Oakland Park, FL | 2.0 | 1.0 | 900 | $3,400 | $3.78 | 24d | 1 | 0.91mi |
| 6500 N Andrews Ave Fort Lauderdale, FL | 2.0 | 1.0–2.0 | 943 | $3,146 | $3.34 | 2d | 31 | 1.09mi |
| 331 NW 38th St Oakland Park, FL | 2.0 | 1.5 | 1040 | $3,900 | $3.75 | 17d | 1 | 1.22mi |
| 331 NW 38th St Oakland Park, FL | 2.0 | 1.5 | 1040 | $3,900 | $3.75 | 7d | 1 | 1.22mi |
| 4564 NW 16th Ave Fort Lauderdale, FL | 2.0 | 2.0 | 1010 | $2,300 | $2.28 | 24d | 1 | 1.30mi |
| 3801 Dixie Hwy Oakland Park, FL | 2.0 | 1.0–2.0 | 944 | $3,584 | $3.80 | 14d | 45 | 1.37mi |
| 3781 NE 13th Ave Oakland Park, FL | 2.0 | 1.0 | 869 | $3,900 | $4.49 | 24d | 1 | 1.47mi |
Listing history 9 events
-
2026-05-07status Pending
-
2026-05-03$350,000 Active
-
2016-05-02soldstatus $162,000
-
2013-11-26soldstatus $133,000
-
2010-12-22soldstatus $68,000
-
2010-12-03soldstatus $68,000 150-char remark
Show marketing remark (150 chars)
SHORT SALE APPROVED WITH LAST BUYER WHO DIDNT GET MORTGAGE AT LIST PRICE. NEEDS UPDATING. ELECTRIC W/ BRAKERS AND UTILITY ROOM IN HOUSE. GREAT STREET.
-
2010-08-13$68,000 150-char remark
Show marketing remark (150 chars)
SHORT SALE APPROVED WITH LAST BUYER WHO DIDNT GET MORTGAGE AT LIST PRICE. NEEDS UPDATING. ELECTRIC W/ BRAKERS AND UTILITY ROOM IN HOUSE. GREAT STREET.
-
2004-05-27soldstatus $156,000
-
1975-10-01soldstatus $25,500
ⓘ Source: listings_history table (triggers on properties + properties_extension) + one-shot
backfill from property_details.listing_events for pre-trigger history.
Tax reassessment forecast FL · Resets to sale price
- Current annual tax
- $1,794 · $149/mo
- Projected year-2 tax
- $2,905 · $242/mo
- Expected delta
- +$1,111/yr (+$93/mo · 61.9%)
ⓘ Screening estimate from a state-policy table — verify with the county assessor before closing.
Climate risk First Street
- Flood 1/10 Low FEMA zone X (shaded) · 0% chance over 30 yrs
- Wildfire 1/10 Low
- Heat 10/10 Extreme 7 d/yr ≥106°F today · 26 d/yr by 30 yrs out
- Wind 10/10 Extreme 99% chance of damaging wind over 30 yrs
- Air quality 2/10 Low 1 unhealthy d/yr today · 2 by 30 yrs out
Nearby sold comps map
Loading sold comps map…
Walkable amenities ~0.75 mi
Loading nearby amenities…
Taxation est. · year 1
- Rental income
- $38,975
- − Mortgage interest
- −$19,605
- − Property taxes
- −$1,794
- − Insurance
- −$1,750
- − Repairs & maintenance
- −$3,118
- − Management
- −$3,118
- − Depreciation
- −$10,182
- Taxable loss
- −$592
- Est. tax savings @ 24.0%
- +$142
- After-tax cash flow
- $5,363/yr
For passive investors: Depreciation is non-cash, so a rental often shows a tax loss while cash-flowing — sheltering income. Rental losses are passive: they offset passive income freely, and up to $25,000/yr can offset ordinary (W-2) income if you actively participate and your MAGI is under $100k (phasing out to $0 by $150k); unused losses carry forward. On sale, claimed depreciation is recaptured at up to 25%, and gains may owe capital-gains tax (a 1031 exchange can defer both). Figures are a year-1 estimate at your 24.0% rate — not tax advice; consult a CPA.
Schools (NCES district)
- District
- Broward
- NCES district ID
- 1200180
- Math proficiency
- 42% ▼ -18.00%
- Reading proficiency
- 53% ▼ -5.00%
- Median HH income
- $52,139
- Composite
- 40.88/100
- National rank
- #3621
- State rank
- #46 of 73 in FL
Livability — Oakland Park
- Score
- 77/100
- State rank
- #193
- US rank
- #3082
Category grades
Schools grade is shown separately in the Schools card above.
Census & demographics
- Census place
- Oakland Park, FL
- County
- Broward County · 1,963,430 people
- City population
- 68,410
- Metro
- Miami-Fort Lauderdale-Pompano Beach, FL
- Population (ZIP)
- 30,935
- Household income
- $75,361
- Rent vs Own
- Severe rent burden
- 1755.0
Population outlook (Broward County) Hauer SSP2
- Today (2025)
- 2,207,033 people
- By 2030
- 2,360,704 · +7.0%
- By 2040
- 2,661,208 · +20.6%
- By 2050
- 2,946,698 · +33.5%
- By 2075
- 3,602,273 · +63.2%
- By 2100
- 3,970,984 · +79.9%
Race, ethnicity, and origin ACS 2023
- Neighborhood character
- Diverse neighborhood (Simpson 0.68)
- Race & ethnicity
- White 43% Hispanic / Latino 32% Two or more races 25% Black 17% Asian 2%
- Hispanic origin (detail)
- Mexican 2% Puerto Rican 4% Cuban 4%
- Common ancestry
- Hispanic 5% Lithuanian 3% Romanian 2%
- Foreign-born
- 31% · Canada, Jamaica, Vietnam
- Languages at home
- 59% English-only · Spanish 28% Other Indo-European 5% French/Haitian/Cajun 5%
Political lean MEDSL · Broward
- 2024 margin
- D (+17.0) · D 58.0% · R 41.0%
- 2008→2024 swing
- -17.8pp toward R · 2008: 34.7pp · 2024: 17.0pp
- All cycles
- 2024: D+17.0 2020: D+29.8 2016: D+35.0 2012: D+34.9 2008: D+34.7
Not yet ingested
- Civics
- —
Market trends
- HPI YoY
- ▼ -208.58%
- Current HPI
- 394.9526
- Rent YoY
- ▲ 2.01%
- Metro
- Miami-Fort Lauderdale-Pompano Beach, FL
- State GDP YoY
- ▲ 3.28%
- F500 in state
- 36
Industry mix (Fortune 500 HQ in FL)
| Industry | F500 HQs | Revenue |
|---|---|---|
| Industrial Technology | 2 | $29B |
|
||
| Insurance | 2 | $17B |
|
||
| Retail | 1 | $60B |
|
||
| Technology Distribution | 1 | $58B |
|
||
| Homebuilding | 1 | $35B |
|
||
| Technology Manufacturing | 1 | $35B |
|
||
Price history
+1272.5% since first listed9 events — show timeline
- 2026-05-07 Pending — Beaches MLS
- 2026-05-03 Listed $350,000 Beaches MLS
- 2016-05-02 Sold (Public Records) $162,000 Public Records
- 2013-11-26 Sold (Public Records) $133,000 Public Records
- 2010-12-22 Sold (Public Records) $68,000 Public Records
- 2010-12-03 Sold (MLS) $68,000 MARMLS
- 2010-08-13 Listed $68,000 MARMLS
- 2004-05-27 Sold (Public Records) $156,000 Public Records
- 1975-10-01 Sold (Public Records) $25,500 Public Records
Property tax history
-0.1%/yrLatest (2025): $1,794 · +2.8% YoY. Source: county tax records.
Cash-flow waterfall
monthlySold comps — $/sqft
last 12 mo · ≤1 miLoading sold comps…