2488 Reese Ave · Augusta-Richmond County consolidated government (balance), GA
Flood risk 6/10 · Moderate
- FEMA flood zone
- AE
- Chance of flooding over 30 yrs
- 0.67%
- Est. flood insurance / yr
- $1,737 – $8,500
Fire risk 2/10 · Minimal
- Est. fire insurance / yr
- $963 – $1,789
Heat risk 8/10 · Major
- Hot days now (above 109°F)
- 7 days/yr
- Hot days in 30 yrs
- 17 days/yr
Wind risk 6/10 · Moderate
- Chance of severe wind over 30 yrs
- 67.0%
Air-quality risk 3/10 · Minor
- Unhealthy air days now
- 3 days/yr
- Unhealthy air days in 30 yrs
- 3 days/yr
Risk factors via First Street. Map © Google.
Why this score? — see what drove the B grade
The composite is a weighted blend of 9 inputs, each scored 0–100. Each bar is that input's sub-score; the figure is the points it added to the 100-point composite (weight × sub-score).
- Cash flow +30.0/30.0
- ARV discount +12.7/15.0
- DSCR +10.0/10.0
- 1% rule +9.5/10.0
- Livability +2.5/5.0
- Condition / age +2.5/5.0
- Rent growth +2.4/5.0
- Schools +1.3/10.0
- Appreciation +0.0/10.0
$78,900
🖨 Deal sheet 📄 Offer letter ✓ Due diligence
Listing remarks
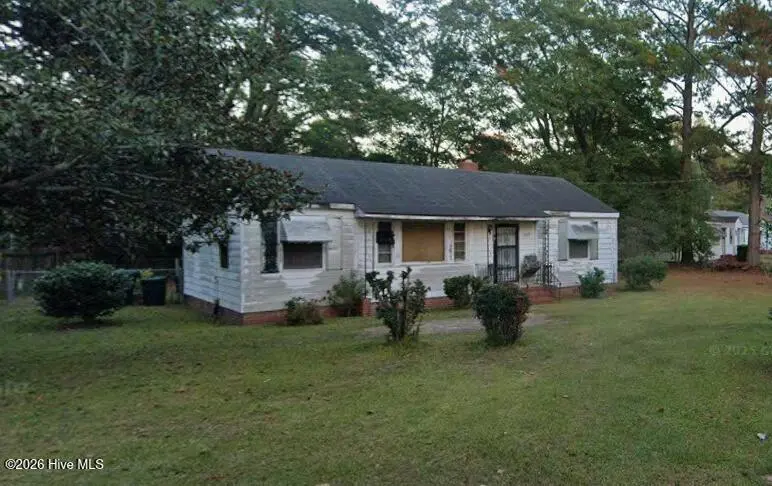
Opportunity awaits with this 3-bedroom, 1-bath home full of potential! Situated on a spacious lot with a fenced yard, this property is perfect for investors, flippers, or buyers looking to bring their vision to life. Inside, you'll find a functional layout with ample space to reimagine and restore. The fenced backyard offers privacy and room for pets, gardening, or outdoor entertaining. Conveniently located near schools, shopping, and major roadways, this fixer-upper is a chance to create value and make it your own. Bring your tools and imagination -- the possibilities are endless! * * property is located in a flood zone * *
Key facts
- Fenced yard
- Spacious lot
- Fenced backyard
Tags
Property features AI
Exterior
- Parking: Gravel parking
- Utilities: Public water; Public sewer; Natural gas connected; Cable available; Water connected
- Home design: Single-family residence; One story; Entry level: 1
- Construction: Wood siding and frame construction; Shingle roof; Crawl space (no basement)
- Exterior features: Porch; Back yard fencing; Corner lot; Has a view
Interior
- Kitchen: Gas water heater
- Bedrooms: 5 total rooms (includes bedrooms and living spaces)
- Flooring: Carpet
- Bathrooms: 1 full bathroom
- Heating & cooling: Central air conditioning; Forced air heating with natural gas
- Interior features: Ceiling fans
- Laundry & utility: Washer hookup; Dedicated laundry room
Neighborhood map
What this means for you Summary
Snapshot
- This is a 2-bed/1.0-bath single-family listed at $79k.
Deal economics
- At list price, monthly cash flow is $-25 ($-306/yr) — negative.
- To cash-flow at today's rent, offer at most $74k (5.7% below list).
- Meets the 1% rule at list price ($1k rent vs $79k).
- Recommended offer: $74k (5.7% below list) — sets the bar for cash-flow.
- Cap rate 12.4% vs local median 5.3% in Augusta-Richmond County consolidated government (balance) — top-decile yield for the area; either an underpriced asset or a hidden risk that comps aren't pricing in. Stress-test before assuming the spread holds.
Location & tenants
- Location reads: area grade B — affects rentability + tenant quality, not the cash-flow math above.
- Richmond County (urban): math 12% / reading 20% proficiency, ranked #154 of 174 in GA (top 88%) — low school quality limits family demand, transient renter base, plan for 1-2y turnover; 72% free/reduced lunch — lower-income household profile, screen leases tightly.
- Market conditions: Rents soft (-0.2%/yr); 364 active listings in the ZIP; 17 comparable units currently listed for rent nearby; rentals at typical pace (median 24d on market — plan ~3-4 weeks tenant-placement turnaround); 47% of comp listings sitting > 30 days — soft ceiling on asking rent; 561 units permitted in Richmond County in 2024 (0 in 5+ unit buildings).
Forward outlook
- Local home prices are declining (-3.0%/yr); year-one equity from $545 of loan paydown is wiped out by about $2k of value loss. Plan a longer hold.
- Richmond County population projected to shrink 5% by 2050 — rents likely to lag national; underwrite the cash flow, not the appreciation.
Negotiation context
- It's been on market 31 days — a 3% lower offer ($77k) is reasonable based on typical stale-listing flexibility.
Risks & watch-outs
- Watch-outs: flood insurance adds $427/mo; built in 1952 — expect roof / HVAC / electrical / plumbing capex.
- Climate carrying-cost: in FEMA flood zone AE (mandatory federal flood insurance); major wind risk, 67% chance of damaging wind over 30y; extreme-heat days projected 7→17/yr by 2055 (HVAC capex compounding) — expect insurance premiums to compound above CPI over the hold.
Questions for the listing agent
- What do current leases actually rent for vs. the listed asking? Can we see a recent rent roll and the last 12 months of T-12 income?
- It's been on market 31 days. Have you received any prior offers? Is the seller open to a 6% concession, seller financing, or rate buy-down credit?
- Built in 1952 — when were the roof, HVAC, electrical panel, plumbing, and water heater last replaced?
- What's the actual annual flood-insurance premium (NFIP or private), and is the property in a SFHA with mandatory coverage?
- Is there a deadline driving the sale (1031 exchange, divorce, estate, relocation)? That informs how much negotiation room exists.
- What's the average days-on-market for RENTAL listings here right now (not sales)? A rising rental-DOM trend means longer vacancies and softer asking-rent achievability than the comps imply.
- What's the recent tenant-quality profile in this submarket — average credit score on applications, eviction rate, late-payment / NSF rate, and stable-employment percentage? A property-management company in the area should have these aggregated.
- How much new for-sale + rental construction is in the pipeline within 1–3 miles? Heavy new supply typically softens prices + rents 12–24 months out; constrained supply supports both.
Investment metrics
- 1% rule
- 1.45% ✓
- Cap rate
- 12.39%
- Cash-on-cash
- 21.79%
- DSCR
- 1.97
- GRM
- 5.7
CMA / ARV
- ARV (on-the-fly)
- $89,175
- Comps found
- 12
Show comp detail 12 sales within ~0.75 mi
| Address | Dist | Beds/Ba | Sqft | Sold | Price | $/sf | Match |
|---|---|---|---|---|---|---|---|
| 2472 Reese Ave | 0.09mi | 3/1.0 (+1) | 1,025 (0%) | 3mo | $89,400 | $87 | 88 |
| 2469 Reese Ave | 0.12mi | 3/1.0 (+1) | 1,025 (0%) | 2mo | $85,000 | $83 | 87 |
| 2520 Reese Ave | 0.20mi | 2/1.0 | 1,073 (+5%) | 5mo | $76,000 | $71 | 79 |
| 1977 Piedmont St | 0.12mi | 3/1.0 (+1) | 1,025 (0%) | 13mo | $129,901 | $127 | 78 |
| 1755 Nixon Rd | 0.49mi | 3/1.0 (+1) | 1,008 (-2%) | 5mo | $17,000 | $17 | 66 |
| 2560 Kaufman Dr | 0.62mi | 3/1.0 (+1) | 1,008 (-2%) | 2mo | $60,000 | $60 | 62 |
| 2013 Shark Dr | 0.55mi | 3/1.0 (+1) | 1,059 (+3%) | 3mo | $133,000 | $126 | 61 |
| 1907 Virginia Ave | 0.16mi | 3/2.0 (+1) | 1,133 (+10%) | 11mo | $128,900 | $114 | 57 |
| 2425 Bass Ave | 0.57mi | 3/1.0 (+1) | 1,014 (-1%) | 13mo | $156,000 | $154 | 56 |
| 2521 Hammond Ave | 0.37mi | 2/1.0 | 896 (-13%) | 7mo | $65,000 | $73 | 56 |
| 2400 Yates Dr | 0.53mi | 3/1.0 (+1) | 888 (-13%) | 8mo | $38,000 | $43 | 41 |
| 2413 Yates Dr | 0.63mi | 3/1.0 (+1) | 888 (-13%) | 6mo | $112,300 | $126 | 38 |
Match score weights: distance 35% · size 25% · config 20% · recency 20%. Top-matched comps best support the ARV.
Projected returns pro-forma
-3.0% appreciation · 0.0% rent growth · sell at horizon
- IRR
- -24.3%
- Equity multiple
- 0.21×
- Total profit
- $-17,511
- Equity at exit
- $11,764
- IRR
- -50.4%
- Equity multiple
- -0.33×
- Total profit
- $-29,281
- Equity at exit
- $6,822
Cash invested: $22,092 (down + closing). Projections, not guarantees.
Landlord ↔ Tenant lean methodology
- Overall (STATE)
- 90 Strongly Landlord-Friendly
- State Georgia
- 90 Strongly Landlord-Friendly · R+3
- County
- — inherits STATE
- City
- — inherits STATE
ZIP-level market 30906
- Home prices YoY
- -21.6%
- Rents YoY
- -0.2%
- Active inventory
- 364
- Price-to-rent
- 5.7×
Monthly cashflow live
- Estimated rent
- $1,146 high interval (Pro) →
- Mortgage (P&I)
- −$414
- Tax from tax record
- −$57 /mo · $688/yr
- Insurance
- −$33
- Flood insurance flood zone
- −$427 /mo · $5,118/yr
- HOA
- −$0
- Vacancy / Maint / Mgmt
- −$241
- Net cashflow
- $-25
Break-even live
UW: 25.0% down · 7.5% · 30yr · 1.5% tax · 5.0% vac · 8.0% maint · 8.0% mgmt
Financing live
Cash to close
- Down payment
- $19,725
- Closing costs
- $2,367
- Reserves months
- —
- Total cash needed
- —
Loan-product check · same deal, 3 products live
Conventional
25% down · 7.5% · 30yr
- Down + closing
- —
- Monthly P&I
- —
- Monthly cashflow
- —
- DSCR
- —
- Eligible?
- —
Personal DTI + credit; lowest rate.
DSCR
20% down · 8.5% · 30yr
- Down + closing
- —
- Monthly P&I
- —
- Monthly cashflow
- —
- DSCR
- —
- Eligible?
- —
No personal income docs; deal must DSCR.
Hard money
10% down · 12.0% · 12mo
- Down + closing
- —
- Monthly P&I
- —
- Monthly cashflow
- —
- DSCR
- —
- Eligible?
- —
Short-term bridge; refi at stabilization.
Rent comps 17 comps
| Address | Beds | Baths | Sqft | Rent | $/sqft | DOM | Units | Dist |
|---|---|---|---|---|---|---|---|---|
| 2235 Woodward Ave Augusta, GA | 2.0 | 1.0 | 773 | $895 | $1.16 | 44d | 1 | 0.34mi |
| 2401 Norfolk St Augusta, GA | 2.0 | 1.0 | 991 | $949 | $0.96 | 43d | 1 | 0.41mi |
| 2020 Garr Dr Augusta, GA | 3.0 | 1.0 | 1100 | $1,200 | $1.09 | 14d | 1 | 0.62mi |
| 2205 Southgate Dr Augusta, GA | 1.0–2.0 | 1.0–1.5 | 770 | $1,099 | $1.43 | 14d | 7 | 0.79mi |
| 1822 Catalina Dr Augusta, GA | 3.0 | 1.0 | 888 | $1,350 | $1.52 | 43d | 1 | 0.90mi |
| 1822 Catalina Dr Augusta, GA | 3.0 | 1.0 | 888 | $1,350 | $1.52 | 23d | 1 | 0.90mi |
| 2119 Lumpkin Rd Augusta, GA | 2.0 | 1.0–1.5 | 974 | $912 | $0.94 | 21d | 6 | 0.91mi |
| 2932 Abelia Dr Augusta, GA | 3.0 | 1.0 | 888 | $1,100 | $1.24 | 43d | 1 | 0.97mi |
| 1940 Haynie Dr Unit 2 Augusta, GA | 1.0 | 1.0 | 840 | $850 | $1.01 | 23d | 1 | 1.19mi |
| 1940 Haynie Dr Unit Main Augusta, GA | 3.0 | 1.5 | 840 | $1,500 | $1.79 | 23d | 1 | 1.19mi |
| 1940 Haynie Dr Unit Main Augusta, GA | 3.0 | 1.5 | 840 | $1,500 | $1.79 | 43d | 1 | 1.19mi |
| 526 Richmond Hill Rd W Augusta, GA | 1.0 | 1.0 | 770 | $810 | $1.05 | 14d | 1 | 1.23mi |
| 1914 1/2 Kratha Dr Augusta, GA | 2.0 | 1.0 | 1400 | $995 | $0.71 | 14d | 1 | 1.25mi |
| 3211 Kevin Dr Augusta, GA | 3.0 | 1.5 | 1005 | $1,275 | $1.27 | 23d | 1 | 1.26mi |
| 3211 Kevin Dr Augusta, GA | 3.0 | 1.5 | 1005 | $1,275 | $1.27 | 43d | 1 | 1.26mi |
| 2910 Richmond Hill Rd Augusta, GA | 2.0 | 1.0 | 1000 | $900 | $0.90 | 43d | 3 | 1.31mi |
| 2230 Hollis Rd Augusta, GA | 2.0 | 1.0 | 1000 | $975 | $0.97 | 43d | 1 | 1.33mi |
Listing history 15 events
-
2026-06-18days on market $78,900 Active 31 DOM
-
2026-06-17days on market $78,900 Active 30 DOM
-
2026-06-16days on market $78,900 Active 29 DOM
-
2026-06-15days on market $78,900 Active 28 DOM
-
2026-06-14days on market $78,900 Active 26 DOM
-
2026-06-10days on market $78,900 Active 23 DOM
-
2026-06-09days on market $78,900 Active 22 DOM
-
2026-06-08days on market $78,900 Active 21 DOM
-
2026-06-07days on market $78,900 Active 20 DOM
-
2026-06-03days on market $78,900 Active 16 DOM
-
2026-06-02days on market $78,900 Active 15 DOM
-
2026-06-01days on market $78,900 Active 14 DOM
-
2026-05-31days on market $78,900 Active 13 DOM
-
2026-05-30days on market $78,900 Active 12 DOM
-
2026-05-15$78,900 Active
ⓘ Source: listings_history table (triggers on properties + properties_extension) + one-shot
backfill from property_details.listing_events for pre-trigger history.
Tax reassessment forecast GA · Resets to sale price
- Current annual tax
- $688 · $57/mo
- Projected year-2 tax
- $726 · $60/mo
- Expected delta
- +$38/yr (+$3/mo · 5.5%)
ⓘ Screening estimate from a state-policy table — verify with the county assessor before closing.
Climate risk First Street
- Flood 6/10 Major FEMA zone AE · 67% chance over 30 yrs
- Wildfire 2/10 Low
- Heat 8/10 Severe 7 d/yr ≥109°F today · 17 d/yr by 30 yrs out
- Wind 6/10 Major 67% chance of damaging wind over 30 yrs
- Air quality 3/10 Moderate 3 unhealthy d/yr today · 3 by 30 yrs out
Nearby sold comps map
Loading sold comps map…
Walkable amenities ~0.75 mi
Loading nearby amenities…
Taxation est. · year 1
- Rental income
- $13,747
- − Mortgage interest
- −$4,420
- − Property taxes
- −$688
- − Insurance
- −$5,513
- − Repairs & maintenance
- −$1,100
- − Management
- −$1,100
- − Depreciation
- −$2,295
- Taxable loss
- −$1,368
- Est. tax savings @ 24.0%
- +$328
- After-tax cash flow
- $23/yr
For passive investors: Depreciation is non-cash, so a rental often shows a tax loss while cash-flowing — sheltering income. Rental losses are passive: they offset passive income freely, and up to $25,000/yr can offset ordinary (W-2) income if you actively participate and your MAGI is under $100k (phasing out to $0 by $150k); unused losses carry forward. On sale, claimed depreciation is recaptured at up to 25%, and gains may owe capital-gains tax (a 1031 exchange can defer both). Figures are a year-1 estimate at your 24.0% rate — not tax advice; consult a CPA.
Schools (NCES district)
- District
- Richmond County
- NCES district ID
- 1304380
- Math proficiency
- 12% ▼ -9.00%
- Reading proficiency
- 20% ▼ -6.00%
- Median HH income
- $38,069
- Composite
- 13.43/100
- National rank
- #9524
- State rank
- #154 of 174 in GA
Livability — Augusta-Richmond County consolidated government (balance)
No livability data for this city. (Only ~50 U.S. cities are tracked.)
Census & demographics
- Census place
- Augusta-Richmond County consolidated government (balance), GA
- County
- Richmond County · 190,917 people
- City population
- 154,035
- Metro
- Augusta-Richmond County, GA-SC
- Population (ZIP)
- 60,423
- Household income
- $45,999
- Rent vs Own
- Severe rent burden
- 3363.0
Population outlook (Richmond County) Hauer SSP2
- Today (2025)
- 200,753 people
- By 2030
- 200,232 · -0.3%
- By 2040
- 196,813 · -2.0%
- By 2050
- 190,347 · -5.2%
- By 2075
- 172,496 · -14.1%
- By 2100
- 146,284 · -27.1%
Race, ethnicity, and origin ACS 2023
- Neighborhood character
- Majority Black (64%)
- Race & ethnicity
- Black 64% White 27% Two or more races 5% Hispanic / Latino 5%
- Common ancestry
- Lithuanian 1%
- Foreign-born
- 2% · Canada
- Languages at home
- 95% English-only · Spanish 3% German/W. Germanic 1%
Political lean MEDSL · Richmond
- 2024 margin
- Solid D (+36.1) · D 67.8% · R 31.7%
- 2008→2024 swing
- +4.3pp toward D · 2008: 31.8pp · 2024: 36.1pp
- All cycles
- 2024: D+36.1 2020: D+37.2 2016: D+32.4 2012: D+33.8 2008: D+31.8
Not yet ingested
- Civics
- —
Market trends
- HPI YoY
- ▼ -58.99%
- Current HPI
- 213.5733
- Rent YoY
- ▼ -0.25%
- Metro
- Augusta-Richmond County, GA-SC
- State GDP YoY
- ▲ 2.66%
- F500 in state
- 28
Industry mix (Fortune 500 HQ in GA)
| Industry | F500 HQs | Revenue |
|---|---|---|
| Paper / Packaging | 2 | $29B |
|
||
| Retail | 1 | $160B |
|
||
| Transportation / Logistics | 1 | $91B |
|
||
| Airlines | 1 | $62B |
|
||
| Consumer Goods | 1 | $47B |
|
||
| Utilities | 1 | $25B |
|
||
Price history
1 event — show timeline
- 2026-05-15 Listed $78,900 Hive MLS
Property tax history
+3.6%/yrLatest (2025): $688 · +7.1% YoY. Source: county tax records.
Cash-flow waterfall
monthlySold comps — $/sqft
last 12 mo · ≤1 miLoading sold comps…