 🏗️ New Construction
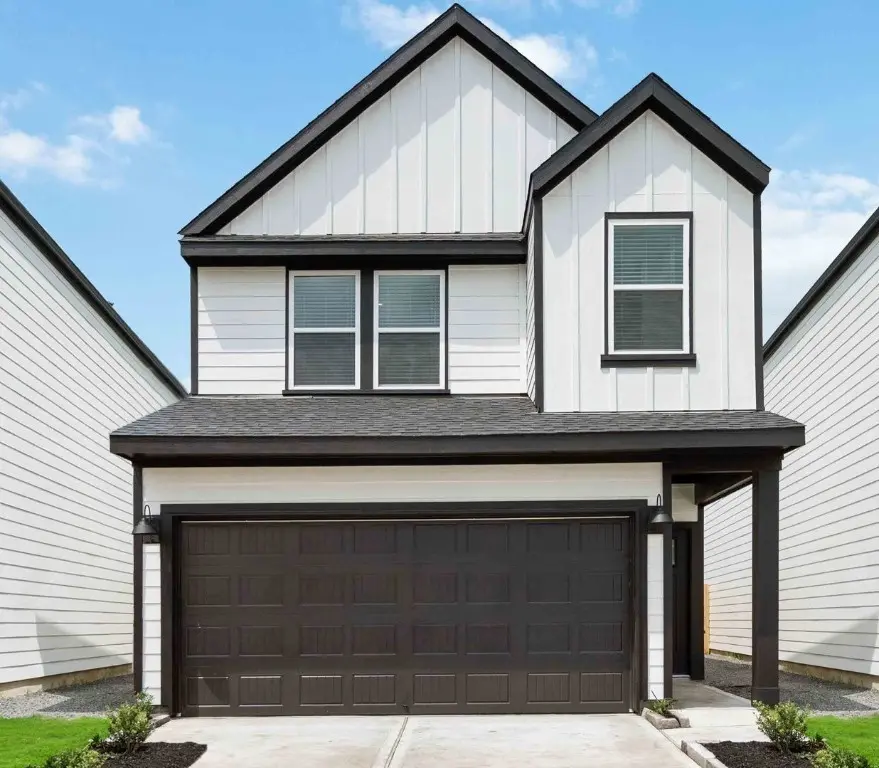
2613 Mchenry Lndg · Houston, TX
Flood risk No data
- FEMA flood zone
- —
- Chance of flooding over 30 yrs
- —
- Est. flood insurance / yr
- —
Fire risk No data
- Est. fire insurance / yr
- —
Heat risk No data
- Hot days now (above threshold)
- —
- Hot days in 30 yrs
- —
Wind risk No data
- Chance of severe wind over 30 yrs
- —
Air-quality risk No data
- Unhealthy air days now
- —
- Unhealthy air days in 30 yrs
- —
Risk factors via First Street. Map © Google.
Why this score? — see what drove the D- grade
The composite is a weighted blend of 9 inputs, each scored 0–100. Each bar is that input's sub-score; the figure is the points it added to the 100-point composite (weight × sub-score).
- Appreciation +10.0/10.0
- ARV discount +7.5/15.0
- Cash flow +5.9/30.0
- Rent growth +3.7/5.0
- Livability +3.7/5.0
- Schools +2.7/10.0
- Condition / age +2.5/5.0
- 1% rule +1.8/10.0
- DSCR +0.3/10.0
$274,990
🖨 Deal sheet 📄 Offer letter ✓ Due diligence
Listing remarks MLS
The property is located at 2613 McHenry Landing Lane HOUSTON TX 77051 priced at 274990, the square foot and stories are 1384, 2.The number of bath is 2, halfbath is 1 there are 3 bedrooms and 2 garages. For more details please, call or email.
Key facts
- Gardenia floor plan
- Walk-in closet
- Stylish island
Tags
Property features AI
Finance
- Other: Builder: DR Horton
- HOA & community: Association managed by Inframark; Annual association fee of $1,350
Exterior
- Parking: Attached garage with 2 parking spaces
- Utilities: Public water; Public sewer
- Home design: Residential property; Under construction (new construction); Single-story (entry level not specified); Facing direction not specified
- Construction: Built in 2025; Cement siding; Composition roof; Slab foundation
- Exterior features: Subdivision lot
Interior
- Kitchen: Dishwasher; Disposal; Microwave
- Bedrooms: 3 total rooms
- Bathrooms: 2 full bathrooms; 1 half bathroom
- Heating & cooling: Central gas heating; Central electric air conditioning; Programmable thermostat (energy efficient)
- Interior features: Granite counters; Programmable thermostat
Neighborhood map
What this means for you Summary
Snapshot
- This is a 3-bed/2.5-bath land listed at $275k.
Deal economics
- At list price, monthly cash flow is $-590 ($-7k/yr) — negative.
- To cash-flow at today's rent, offer at most $217k (21.0% below list).
- To meet the 1% rule (rent ≥ 1% of price), the offer needs to be $204k (25.7% below list).
- Recommended offer: $204k (25.7% below list) — sets the bar for 1% rule.
- Cap rate 4.0% vs local median 3.2% in Houston — meaningfully above typical; check what's discounted (condition, days-on-market, listing class) to confirm the premium yield is real.
Location & tenants
- Location reads 74/100 on livability (#184 in TX, #4,771 nationally) — a middle-class / working-renter tenant base. Strengths: amenities A+, cost of living A+, housing A+; Watch: crime F.
- Houston ISD (urban): math 27% / reading 35% proficiency, ranked #593 of 826 in TX (top 72%) — families likely to look elsewhere, expect single-tenant / working-renter base with shorter leases; 71% free/reduced lunch — lower-income household profile, screen leases tightly.
- Zoned schools: Attucks Middle (math 15% / reading 22%, grade F, #1,478 of 1,662 statewide, top 90%, 439 students, 98% FRL); Worthing H S (math 22% / reading 21%, grade F, #1,377 of 1,632 statewide, top 85%, 827 students, 96% FRL) — zoned schools average 97% FRL vs 71% district-wide (26 pts higher); higher-poverty schools than district average — tighter screening recommended.
- Market conditions: Rents rising fast (+4.8%/yr); 312 active listings in the ZIP; 22 comparable units currently listed for rent nearby; rentals at typical pace (median 18d on market — plan ~3-4 weeks tenant-placement turnaround); lower-income renter base — watch delinquency; 29,883 units permitted in Harris County in 2024 (8,621 in 5+ unit buildings).
- At $2,042/mo this rent would consume 66% of the median local household income ($37k/yr) (locally 1446% of renters already pay >50% of income on rent) — very limited rent-growth headroom before tenants either downsize or default.
Forward outlook
- In year one you build about $32k of equity ($2k loan paydown + $30k appreciation (10.0% local appreciation)).
- Harris County population projected at +47% by 2050 — long-run rental-demand tailwind backs the buy-and-hold thesis.
- By year 2, paydown + projected appreciation supports a ~$52k cash-out refi (75% LTV) — recoverable capital for the next deal without selling this one.
Negotiation context
- It's been on market 44 days — a 3% lower offer ($267k) is reasonable based on typical stale-listing flexibility.
- 2 sale attempts with the ask held roughly flat each time — persistent listings suggest the price (not the market) is what's stuck; bring a comps-based counter.
Questions for the listing agent
- What do current leases actually rent for vs. the listed asking? Can we see a recent rent roll and the last 12 months of T-12 income?
- It's been on market 44 days. Have you received any prior offers? Is the seller open to a 26% concession, seller financing, or rate buy-down credit?
- What does the HOA fee cover, when was the last increase, and are there any pending special assessments or reserve-fund shortfalls?
- Is there a deadline driving the sale (1031 exchange, divorce, estate, relocation)? That informs how much negotiation room exists.
- Schools are D-rated, which usually means shorter tenancies and higher turnover. Who's the typical renter profile here, and what's been the actual vacancy rate?
- Crime grade is F in this area — have there been break-ins, vandalism, or insurance claims at this property in the last 3 years? What carrier currently insures it and at what premium?
- The area grade is low — what's the realistic commute time and amenity access for the typical tenant pool here? Any planned neighborhood developments (good or bad) we should know about?
- What's the average days-on-market for RENTAL listings here right now (not sales)? A rising rental-DOM trend means longer vacancies and softer asking-rent achievability than the comps imply.
- What's the recent tenant-quality profile in this submarket — average credit score on applications, eviction rate, late-payment / NSF rate, and stable-employment percentage? A property-management company in the area should have these aggregated.
- How much new for-sale + rental construction is in the pipeline within 1–3 miles? Heavy new supply typically softens prices + rents 12–24 months out; constrained supply supports both.
Investment metrics
- 1% rule
- 0.68% ✗
- Cap rate
- 3.95%
- Cash-on-cash
- -8.36%
- DSCR
- 0.63
- GRM
- 12.3
CMA / ARV
- ARV (median comp)
- $302,490
- List price
- $274,990
- Delta
- -9.09%
- Verdict
- FAIR
- Comps
- 20 within 1.0 mi
Projected returns pro-forma
10.0% appreciation · 4.77% rent growth · sell at horizon
- IRR
- 18.9%
- Equity multiple
- 2.55×
- Total profit
- $130,972
- Equity at exit
- $272,507
- IRR
- 17.8%
- Equity multiple
- 6.00×
- Total profit
- $423,510
- Equity at exit
- $587,672
Cash invested: $84,697 (down + closing). Projections, not guarantees.
Landlord ↔ Tenant lean methodology
- Overall (STATE)
- 87 Strongly Landlord-Friendly
- State Texas
- 87 Strongly Landlord-Friendly · R+5
- County
- — inherits STATE
- City
- — inherits STATE
ZIP-level market 77051
- Home prices YoY
- 9.7%
- Rents YoY
- 4.8%
- Active inventory
- 312
- Price-to-rent
- 11.2×
Monthly cashflow live
- Estimated rent
- $2,042 high interval (Pro) →
- Mortgage (P&I)
- −$1,586
- Tax est. 1.5%
- −$378 /mo · $4,537/yr
- Insurance
- −$126
- HOA
- −$113
- Vacancy / Maint / Mgmt
- −$429
- Net cashflow
- $-590
Break-even live
UW: 25.0% down · 7.5% · 30yr · 1.5% tax · 5.0% vac · 8.0% maint · 8.0% mgmt
Financing live
Cash to close
- Down payment
- $75,622
- Closing costs
- $9,075
- Reserves months
- —
- Total cash needed
- —
Loan-product check · same deal, 3 products live
Conventional
25% down · 7.5% · 30yr
- Down + closing
- —
- Monthly P&I
- —
- Monthly cashflow
- —
- DSCR
- —
- Eligible?
- —
Personal DTI + credit; lowest rate.
DSCR
20% down · 8.5% · 30yr
- Down + closing
- —
- Monthly P&I
- —
- Monthly cashflow
- —
- DSCR
- —
- Eligible?
- —
No personal income docs; deal must DSCR.
Hard money
10% down · 12.0% · 12mo
- Down + closing
- —
- Monthly P&I
- —
- Monthly cashflow
- —
- DSCR
- —
- Eligible?
- —
Short-term bridge; refi at stabilization.
Rent comps 22 comps
| Address | Beds | Baths | Sqft | Rent | $/sqft | DOM | Units | Dist |
|---|---|---|---|---|---|---|---|---|
| 10415 Lancaster Ln Houston, TX | 3.0–4.0 | 2.5 | 1937 | $2,525 | $1.30 | 20d | 1 | 0.18mi |
| 10514 Wellesley Terrace Trl Houston, TX | 3.0 | 3.0 | 1843 | $2,300 | $1.25 | 18d | 1 | 0.24mi |
| 2937 Amherst Meadow Ln Unit NA Houston, TX | 3.0 | 2.5 | 1820 | $2,400 | $1.32 | 4d | 1 | 0.35mi |
| 2937 Amherst Meadow Ln Houston, TX | 3.0 | 2.5 | 1820 | $2,450 | $1.35 | 22d | 1 | 0.35mi |
| 9610 Buffum St Houston, TX | 3.0 | 3.0 | 1605 | $1,799 | $1.12 | 43d | 1 | 0.52mi |
| 10510 Cathedral Dr Houston, TX | 3.0 | 1.0 | 887 | $1,300 | $1.47 | 43d | 1 | 0.66mi |
| 2910 Reed Rd Houston, TX | 1.0–3.0 | 1.0–2.0 | 967 | $1,280 | $1.32 | 1d | 5 | 0.66mi |
| 2725 Reed Rd Houston, TX | 1.0–3.0 | 1.0–2.5 | 911 | $975 | $1.07 | 43d | 1 | 0.84mi |
| 9606 Ashville Dr Unit B Houston, TX | 3.0 | 2.0 | 1610 | $1,570 | $0.98 | 43d | 1 | 0.88mi |
| 2889 Reed Rd Houston, TX | 1.0–2.0 | 1.0–2.0 | 997 | $1,648 | $1.65 | 2d | 2 | 0.91mi |
| 11900 Oakmoor Pkwy Houston, TX | 1.0–3.0 | 1.0–2.0 | 892 | $1,469 | $1.65 | 2d | 12 | 1.01mi |
| 3137 W Bellfort Ave Houston, TX | 2.0 | 2.0 | 1164 | $1,802 | $1.55 | 43d | 1 | 1.39mi |
| 10301 Buffalo Speedway Unit 2047 Houston, TX | 2.0 | 2.0 | 972 | $1,515 | $1.56 | 11d | 1 | 1.44mi |
| 10301 Buffalo Speedway Unit 3047 Houston, TX | 3.0 | 2.0 | 1420 | $1,961 | $1.38 | 3d | 1 | 1.44mi |
| 10301 Buffalo Speedway Unit 3047 Houston, TX | 3.0 | 2.0 | 1420 | $1,932 | $1.36 | 18d | 1 | 1.44mi |
| 10006 Fannin St Houston, TX | 2.0 | 2.0 | 1274 | $1,549 | $1.22 | 43d | 1 | 1.44mi |
| 9676 Knight Rd Houston, TX | 2.0 | 3.0 | 1481 | $2,199 | $1.48 | 43d | 1 | 1.46mi |
| 10000 Fannin St Unit 2162 Houston, TX | 2.0 | 2.0 | 1163 | $1,626 | $1.40 | 5d | 1 | 1.46mi |
| 10000 Fannin St Unit 422 Houston, TX | 2.0 | 2.0 | 1163 | $1,626 | $1.40 | 7d | 1 | 1.46mi |
| 10000 Fannin St Unit 2174 Houston, TX | 2.0 | 2.0 | 1163 | $1,650 | $1.42 | 10d | 1 | 1.46mi |
| 10000 Fannin St Apt 424 Houston, TX | 2.0 | 2.0 | 1163 | $1,661 | $1.43 | 12d | 1 | 1.46mi |
| 10000 Fannin St Unit 2112 Houston, TX | 2.0 | 2.0 | 1163 | $1,618 | $1.39 | 2d | 1 | 1.46mi |
HOA detail
- Monthly dues
- $113 · $1,356/yr
Listing history 13 events
-
2026-06-18price $274,990 Active 44 DOM
-
2026-06-18days on market $276,990 Active 44 DOM
-
2026-06-17pricedays on market $276,990 Active 43 DOM
-
2026-06-16days on market $300,990 Active 42 DOM
-
2026-06-15days on market $300,990 Active 41 DOM
-
2026-06-13pricedays on market $300,990 Active 39 DOM
-
2026-06-10days on market $274,990 Active 35 DOM
-
2026-06-08days on market $274,990 Active 34 DOM
-
2026-06-07days on market $274,990 Active 33 DOM
-
2026-06-04days on market $274,990 Active 30 DOM
Show marketing remark (242 chars)
The property is located at 2613 McHenry Landing Lane HOUSTON TX 77051 priced at 274990, the square foot and stories are 1384, 2.The number of bath is 2, halfbath is 1 there are 3 bedrooms and 2 garages. For more details please, call or email.
-
2026-06-01days on market $274,990 Active 27 DOM
-
2026-05-31days on market $274,990 Active 26 DOM
-
2026-05-05$279,990 Active 898-char remark
ⓘ Source: listings_history table (triggers on properties + properties_extension) + one-shot
backfill from property_details.listing_events for pre-trigger history.
Nearby sold comps map
Loading sold comps map…
Walkable amenities ~0.75 mi
Loading nearby amenities…
Taxation est. · year 1
- Rental income
- $24,509
- − Mortgage interest
- −$16,944
- − Property taxes
- −$4,537
- − Insurance
- −$1,512
- − Repairs & maintenance
- −$1,961
- − Management
- −$1,961
- − HOA
- −$1,356
- − Depreciation
- −$8,800
- Taxable loss
- −$12,562
- Est. tax savings @ 24.0%
- +$3,015
- After-tax cash flow
- $-4,064/yr
For passive investors: Depreciation is non-cash, so a rental often shows a tax loss while cash-flowing — sheltering income. Rental losses are passive: they offset passive income freely, and up to $25,000/yr can offset ordinary (W-2) income if you actively participate and your MAGI is under $100k (phasing out to $0 by $150k); unused losses carry forward. On sale, claimed depreciation is recaptured at up to 25%, and gains may owe capital-gains tax (a 1031 exchange can defer both). Figures are a year-1 estimate at your 24.0% rate — not tax advice; consult a CPA.
Schools (NCES district)
- District
- Houston ISD
- NCES district ID
- 4823640
- Math proficiency
- 27% ▼ -18.00%
- Reading proficiency
- 35% ▼ -6.00%
- Median HH income
- $46,054
- Composite
- 26.63/100
- National rank
- #7173
- State rank
- #593 of 826 in TX
Livability — Houston
- Score
- 74/100
- State rank
- #184
- US rank
- #4771
Category grades
Schools grade is shown separately in the Schools card above.
Census & demographics
- Census place
- Houston, TX
- County
- Harris County · 4,702,590 people
- City population
- 3,226,434
- Metro
- Houston-The Woodlands-Sugar Land, TX
- Population (ZIP)
- 19,795
- Household income
- $37,415
- Rent vs Own
- Severe rent burden
- 1446.0
Population outlook (Harris County) Hauer SSP2
- Today (2025)
- 5,571,493 people
- By 2030
- 6,089,821 · +9.3%
- By 2040
- 7,142,806 · +28.2%
- By 2050
- 8,185,864 · +46.9%
- By 2075
- 10,574,329 · +89.8%
- By 2100
- 12,109,958 · +117.4%
Race, ethnicity, and origin ACS 2023
- Neighborhood character
- Predominantly Black (77%)
- Race & ethnicity
- Black 77% Hispanic / Latino 16% Two or more races 11% White 3%
- Hispanic origin (detail)
- Mexican 6% Puerto Rican 1%
- Foreign-born
- 8% · Canada, China
- Languages at home
- 88% English-only · Spanish 10%
Political lean MEDSL · Harris
- 2024 margin
- Lean D (+5.5) · D 52.0% · R 46.4% · Other 1.6%
- 2008→2024 swing
- +3.9pp toward D · 2008: 1.6pp · 2024: 5.5pp
- All cycles
- 2024: D+5.5 2020: D+13.3 2016: D+12.4 2012: D+0.1 2008: D+1.6
Not yet ingested
- Civics
- —
Market trends
- HPI YoY
- ▲ 16.02%
- Current HPI
- 180.4283
- Rent YoY
- ▲ 4.77%
- Metro
- Houston-The Woodlands-Sugar Land, TX
- State GDP YoY
- ▲ 3.95%
- F500 in state
- 110
Industry mix (Fortune 500 HQ in TX)
| Industry | F500 HQs | Revenue |
|---|---|---|
| Energy | 16 | $1,198B |
|
||
| Technology | 5 | $198B |
|
||
| Engineering / Construction | 4 | $72B |
|
||
| Energy Services | 3 | $60B |
|
||
| Utilities | 3 | $41B |
|
||
| Healthcare | 2 | $330B |
|
||
Price history
-1.1% since first listed5 events — show timeline
- 2026-06-16 Price Changed $276,990 HARMLS
- 2026-06-11 Price Changed $300,990 HARMLS
- 2026-06-04 Listed $274,990 Zillow
- 2026-05-19 Price Changed $274,990 HARMLS
- 2026-05-05 Listed $279,990 HARMLS
Cash-flow waterfall
monthlySold comps — $/sqft
last 12 mo · ≤1 miLoading sold comps…