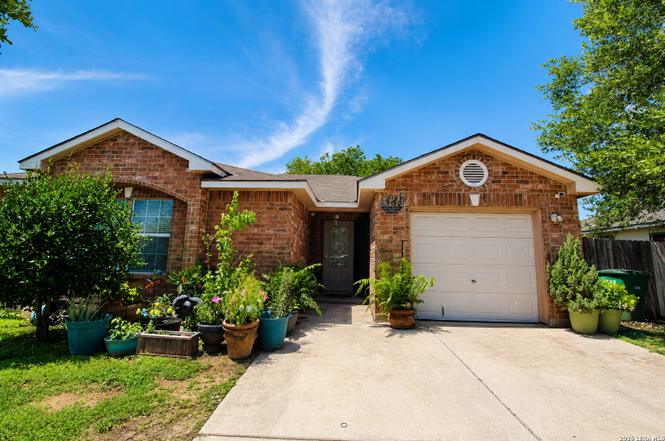
8335 Sweet Maiden St · San Antonio, TX
Flood risk 1/10 · Minimal
- FEMA flood zone
- X (unshaded)
- Chance of flooding over 30 yrs
- 0.0%
- Est. flood insurance / yr
- $507 – $1,088
Fire risk 4/10 · Minor
- Est. fire insurance / yr
- $1,222 – $2,270
Heat risk 8/10 · Major
- Hot days now (above 109°F)
- 7 days/yr
- Hot days in 30 yrs
- 22 days/yr
Wind risk 8/10 · Major
- Chance of severe wind over 30 yrs
- 80.0%
Air-quality risk 2/10 · Minimal
- Unhealthy air days now
- 0 days/yr
- Unhealthy air days in 30 yrs
- 1 days/yr
Risk factors via First Street. Map © Google.
Why this score? — see what drove the D- grade
The composite is a weighted blend of 9 inputs, each scored 0–100. Each bar is that input's sub-score; the figure is the points it added to the 100-point composite (weight × sub-score).
- Cash flow +13.3/30.0
- ARV discount +6.2/15.0
- 1% rule +4.3/10.0
- DSCR +4.0/10.0
- Livability +4.0/5.0
- Condition / age +2.5/5.0
- Rent growth +2.2/5.0
- Schools +2.2/10.0
- Appreciation +0.0/10.0
$164,900
🖨 Deal sheet 📄 Offer letter ✓ Due diligence
Listing remarks
Welcome to 8335 Sweet Maiden Street, a freshly painted, move-in-ready San Antonio home for sale featuring 3 bedrooms, 2 bathrooms, and 1,188 square feet of comfortable living space. Located in Southwest San Antonio, this charming family home is perfect for first-time homebuyers, investors. Step outside and discover your own private garden oasis and backyard retreat. The spacious backyard features mature fruit trees, including lemon, mandarin, and peach trees, along with raised garden bed, tomatoes, pumpkins, cucumber and cactus. Whether you enjoy gardening, entertaining, or simply relaxing outdoors, this unique property offers a serene setting rarely found at this price point. Conveniently
Key facts
- Mature fruit trees
- Backyard retreat
- Private garden oasis
Tags
Property features AI
Finance
- Financial info: Down payment resource not indicated
- HOA & community: Located in Tesoro Hills subdivision; Community amenities: Other (see remarks)
Exterior
- Parking: 1-car garage
- Utilities: Water system; Sewer system
- Home design: Pre-owned brick exterior; Approximately 19 years old
- Construction: Slab foundation; Wood shingle/shake roof
- Exterior features: Street paved
Interior
- Kitchen: Eat-in kitchen; Stove/Range
- Bedrooms: Master bedroom with ceiling fan and full bath (14 x 12); Bedroom 2 (12 x 12); Bedroom 3 (12 x 12)
- Flooring: Ceramic tile flooring; Laminate flooring
- Bathrooms: Two full bathrooms; Master bath with tub/shower combination (8 x 8)
- Heating & cooling: Central heating (electric); Central air conditioning
- Interior features: Ceiling fans throughout; Open floor plan with one living area; Eat-in kitchen; Some window coverings remain; Laundry room; Washer and dryer connections; Stove/Range included
- Laundry & utility: Laundry room with washer and dryer connections
Neighborhood map
What this means for you Summary
Snapshot
- This is a 3-bed/2.0-bath single-family listed at $165k.
Deal economics
- At list price, monthly cash flow is $1 ($6/yr) — positive.
- The deal already cash-flows at list — no discount required.
- To meet the 1% rule (rent ≥ 1% of price), the offer needs to be $154k (6.6% below list).
- Recommended offer: $154k (6.6% below list) — sets the bar for 1% rule.
- Cap rate 6.3% vs local median 3.8% in San Antonio — top-decile yield for the area; either an underpriced asset or a hidden risk that comps aren't pricing in. Stress-test before assuming the spread holds.
Location & tenants
- Location reads 80/100 on livability (#31 in TX, #1,616 nationally) — a professional / high-income tenant draw. Strengths: amenities A+, commute A+, cost of living A+; Watch: crime F.
- Southwest ISD (rural): math 21% / reading 31% proficiency, ranked #701 of 826 in TX (top 85%) — low school quality limits family demand, transient renter base, plan for 1-2y turnover; 75% free/reduced lunch — lower-income household profile, screen leases tightly.
- Zoned schools: Hidden Cove Steam Academy (math 22% / reading 22%, grade F, #3,333 of 4,322 statewide, top 80%, 521 students, 92% FRL); Southwest H S (math 17% / reading 39%, grade F, #1,170 of 1,632 statewide, top 72%, 2,152 students, 72% FRL).
- Market conditions: Rents soft (-1.3%/yr); 91 active listings in the ZIP; 19 comparable units currently listed for rent nearby; rentals at typical pace (median 16d on market — plan ~3-4 weeks tenant-placement turnaround); 8,308 units permitted in Bexar County in 2024 (2,506 in 5+ unit buildings).
- This rent runs 36% of the median local income ($51k/yr) — at the standard rent-burdened threshold; future hikes will face affordability resistance.
Forward outlook
- Local home prices are declining (-3.0%/yr); year-one equity from $1k of loan paydown is wiped out by about $5k of value loss. Plan a longer hold.
- Bexar County population projected at +50% by 2050 — long-run rental-demand tailwind backs the buy-and-hold thesis.
Negotiation context
- Only 14 days on market — expect competitive offers; lowballing is unlikely to land.
Risks & watch-outs
- Climate carrying-cost: severe wind risk, 80% chance of damaging wind over 30y; extreme-heat days projected 7→22/yr by 2055 (HVAC capex compounding) — expect insurance premiums to compound above CPI over the hold.
Questions for the listing agent
- Is there a deadline driving the sale (1031 exchange, divorce, estate, relocation)? That informs how much negotiation room exists.
- Crime grade is F in this area — have there been break-ins, vandalism, or insurance claims at this property in the last 3 years? What carrier currently insures it and at what premium?
- The area grade is low — what's the realistic commute time and amenity access for the typical tenant pool here? Any planned neighborhood developments (good or bad) we should know about?
- What's the average days-on-market for RENTAL listings here right now (not sales)? A rising rental-DOM trend means longer vacancies and softer asking-rent achievability than the comps imply.
- What's the recent tenant-quality profile in this submarket — average credit score on applications, eviction rate, late-payment / NSF rate, and stable-employment percentage? A property-management company in the area should have these aggregated.
- How much new for-sale + rental construction is in the pipeline within 1–3 miles? Heavy new supply typically softens prices + rents 12–24 months out; constrained supply supports both.
Investment metrics
- 1% rule
- 0.93% ✗
- Cap rate
- 6.30%
- Cash-on-cash
- 0.01%
- DSCR
- 1.00
- GRM
- 8.9
CMA / ARV
- ARV (on-the-fly)
- $160,380
- Comps found
- 12
Show comp detail 12 sales within ~0.75 mi
| Address | Dist | Beds/Ba | Sqft | Sold | Price | $/sf | Match |
|---|---|---|---|---|---|---|---|
| 8518 Big Crk | 0.19mi | 3/1.0 | 1,152 (-3%) | 9mo | $155,000 | $135 | 74 |
| 8603 Standing Rock St | 0.25mi | 4/2.0 (+1) | 1,260 (+6%) | 1mo | $170,000 | $135 | 72 |
| 5411 Indian Desert | 0.23mi | 4/1.0 (+1) | 1,210 (+2%) | 8mo | $115,000 | $95 | 70 |
| 8519 Rain Dance | 0.52mi | 3/1.0 | 1,173 (-1%) | 2mo | $165,000 | $141 | 68 |
| 8327 Big Crk | 0.05mi | 3/1.0 | 1,060 (-11%) | 11mo | $155,000 | $146 | 66 |
| 5406 Gwenda Lea St | 0.34mi | 3/2.0 | 1,120 (-6%) | 11mo | $148,000 | $132 | 66 |
| 5318 Beryl Cv | 0.64mi | 3/2.0 | 1,160 (-2%) | 4mo | $99,000 | $85 | 63 |
| 5130 Fedora Dr | 0.51mi | 2/1.0 (-1) | 1,209 (+2%) | 3mo | $114,400 | $95 | 62 |
| 8631 Sweet Maiden | 0.34mi | 4/1.5 (+1) | 1,101 (-7%) | 8mo | $129,900 | $118 | 58 |
| 5530 Prairie Flower | 0.42mi | 3/1.0 | 1,320 (+11%) | 2mo | $104,900 | $79 | 56 |
| 9015 Spanish Cv | 0.55mi | 3/2.0 | 1,320 (+11%) | 8mo | $212,000 | $161 | 49 |
| 5122 Big Fawn | 0.50mi | 4/2.0 (+1) | 1,316 (+11%) | 10mo | $199,999 | $152 | 46 |
Match score weights: distance 35% · size 25% · config 20% · recency 20%. Top-matched comps best support the ARV.
Projected returns pro-forma
-3.0% appreciation · 0.0% rent growth · sell at horizon
- IRR
- -19.9%
- Equity multiple
- 0.33×
- Total profit
- $-31,130
- Equity at exit
- $24,587
- IRR
- -21.8%
- Equity multiple
- 0.04×
- Total profit
- $-44,220
- Equity at exit
- $14,258
Cash invested: $46,172 (down + closing). Projections, not guarantees.
Landlord ↔ Tenant lean methodology
- Overall (STATE)
- 87 Strongly Landlord-Friendly
- State Texas
- 87 Strongly Landlord-Friendly · R+5
- County
- — inherits STATE
- City
- — inherits STATE
ZIP-level market 78242
- Home prices YoY
- -17.6%
- Rents YoY
- -1.3%
- Active inventory
- 91
- Price-to-rent
- 8.9×
Monthly cashflow live
- Estimated rent
- $1,540 high interval (Pro) →
- Mortgage (P&I)
- −$865
- Tax from tax record
- −$283 /mo · $3,391/yr
- Insurance
- −$69
- HOA
- −$0
- Vacancy / Maint / Mgmt
- −$323
- Net cashflow
- $1
Break-even live
UW: 25.0% down · 7.5% · 30yr · 1.5% tax · 5.0% vac · 8.0% maint · 8.0% mgmt
Financing live
Cash to close
- Down payment
- $41,225
- Closing costs
- $4,947
- Reserves months
- —
- Total cash needed
- —
Loan-product check · same deal, 3 products live
Conventional
25% down · 7.5% · 30yr
- Down + closing
- —
- Monthly P&I
- —
- Monthly cashflow
- —
- DSCR
- —
- Eligible?
- —
Personal DTI + credit; lowest rate.
DSCR
20% down · 8.5% · 30yr
- Down + closing
- —
- Monthly P&I
- —
- Monthly cashflow
- —
- DSCR
- —
- Eligible?
- —
No personal income docs; deal must DSCR.
Hard money
10% down · 12.0% · 12mo
- Down + closing
- —
- Monthly P&I
- —
- Monthly cashflow
- —
- DSCR
- —
- Eligible?
- —
Short-term bridge; refi at stabilization.
Rent comps 19 comps
| Address | Beds | Baths | Sqft | Rent | $/sqft | DOM | Units | Dist |
|---|---|---|---|---|---|---|---|---|
| 5427 Indian Desert St San Antonio, TX | 3.0 | 2.0 | 888 | $1,195 | $1.35 | 21d | 1 | 0.26mi |
| 8722 Tesoro Hls San Antonio, TX | 3.0 | 1.5 | 1170 | $1,475 | $1.26 | 10d | 1 | 0.30mi |
| 8619 Standing Rock St San Antonio, TX | 4.0 | 2.0 | 1176 | $1,420 | $1.21 | 4d | 1 | 0.33mi |
| 5507 Prairie Flower Dr San Antonio, TX | 3.0 | 2.0 | 1172 | $2,000 | $1.71 | 10d | 1 | 0.33mi |
| 5523 Indian Desert St San Antonio, TX | 4.0 | 1.5 | 1192 | $1,325 | $1.11 | 17d | 1 | 0.35mi |
| 5542 Snow Fox St San Antonio, TX | 4.0 | 1.5 | 1280 | $1,900 | $1.48 | 43d | 1 | 0.52mi |
| 8905 Seacliff St San Antonio, TX | 3.0 | 2.5 | 1230 | $1,250 | $1.02 | 16d | 1 | 0.56mi |
| 8715 Yellow Knife St San Antonio, TX | 3.0 | 2.0 | 900 | $1,125 | $1.25 | 23d | 1 | 0.56mi |
| 5331 Beryl Cv San Antonio, TX | 3.0 | 2.0 | 1301 | $2,000 | $1.54 | 4d | 1 | 0.65mi |
| 5415 Ray Ellison Blvd San Antonio, TX | 1.0–2.0 | 1.0–2.0 | 878 | $1,240 | $1.41 | 4d | 24 | 0.74mi |
| 7515 Holm Rd San Antonio, TX | 1.0–3.0 | 1.0–2.0 | 886 | $1,404 | $1.58 | 3d | 31 | 0.77mi |
| 9228 Balboa Port Dr San Antonio, TX | 3.0 | 2.0 | 1064 | $1,500 | $1.41 | 43d | 1 | 0.85mi |
| 5611 Elm Valley Dr San Antonio, TX | 3.0 | 2.0 | 1445 | $1,700 | $1.18 | 43d | 1 | 1.03mi |
| 6943 Emerald Vly San Antonio, TX | 3.0 | 2.0 | 1341 | $1,650 | $1.23 | 14d | 1 | 1.06mi |
| 5510 Seahorse Dr San Antonio, TX | 3.0 | 1.5 | 1060 | $1,395 | $1.32 | 4d | 1 | 1.17mi |
| 326 Whitewood Dr San Antonio, TX | 2.0 | 1.0 | 668 | $1,216 | $1.82 | 1d | 8 | 1.40mi |
| 5927 Mohave Vly San Antonio, TX | 3.0 | 2.0 | 1464 | $1,750 | $1.20 | 23d | 1 | 1.40mi |
| 5547 Stonybrook Dr San Antonio, TX | 3.0 | 2.0 | 1014 | $1,425 | $1.41 | 23d | 1 | 1.45mi |
| 5619 Stonybrook Dr San Antonio, TX | 3.0 | 1.0 | 888 | $1,425 | $1.60 | 43d | 1 | 1.49mi |
Listing history 9 events
-
2026-06-18days on market $164,900 Active 14 DOM
-
2026-06-17days on market $164,900 Active 13 DOM
-
2026-06-16days on market $164,900 Active 12 DOM
-
2026-06-15statusdays on market $164,900 Active 11 DOM
-
2026-06-13days on market $164,900 New 9 DOM
-
2026-06-09days on market $164,900 New 5 DOM
-
2026-06-08days on market $164,900 New 4 DOM
-
2026-06-07remarks 699-char remark
-
2026-06-07$164,900 New 3 DOM
ⓘ Source: listings_history table (triggers on properties + properties_extension) + one-shot
backfill from property_details.listing_events for pre-trigger history.
Tax reassessment forecast TX · Resets to sale price
- Current annual tax
- $3,391 · $283/mo
- Projected year-2 tax
- $3,391 · $283/mo
- Expected delta
- $0/yr ($0/mo · 0.0%)
ⓘ Screening estimate from a state-policy table — verify with the county assessor before closing.
Climate risk First Street
- Flood 1/10 Low FEMA zone X (unshaded) · 0% chance over 30 yrs
- Wildfire 4/10 Moderate
- Heat 8/10 Severe 7 d/yr ≥109°F today · 22 d/yr by 30 yrs out
- Wind 8/10 Severe 80% chance of damaging wind over 30 yrs
- Air quality 2/10 Low 0 unhealthy d/yr today · 1 by 30 yrs out
Nearby sold comps map
Loading sold comps map…
Walkable amenities ~0.75 mi
Loading nearby amenities…
Taxation est. · year 1
- Rental income
- $18,480
- − Mortgage interest
- −$9,237
- − Property taxes
- −$3,391
- − Insurance
- −$824
- − Repairs & maintenance
- −$1,478
- − Management
- −$1,478
- − Depreciation
- −$4,797
- Taxable loss
- −$2,727
- Est. tax savings @ 24.0%
- +$654
- After-tax cash flow
- $661/yr
For passive investors: Depreciation is non-cash, so a rental often shows a tax loss while cash-flowing — sheltering income. Rental losses are passive: they offset passive income freely, and up to $25,000/yr can offset ordinary (W-2) income if you actively participate and your MAGI is under $100k (phasing out to $0 by $150k); unused losses carry forward. On sale, claimed depreciation is recaptured at up to 25%, and gains may owe capital-gains tax (a 1031 exchange can defer both). Figures are a year-1 estimate at your 24.0% rate — not tax advice; consult a CPA.
Schools (NCES district)
- District
- Southwest ISD
- NCES district ID
- 4840950
- Math proficiency
- 21% ▼ -21.00%
- Reading proficiency
- 31% ▼ -5.00%
- Median HH income
- $43,362
- Composite
- 22.22/100
- National rank
- #8153
- State rank
- #701 of 826 in TX
Livability — San Antonio
- Score
- 80/100
- State rank
- #31
- US rank
- #1616
Category grades
Schools grade is shown separately in the Schools card above.
Census & demographics
- Census place
- San Antonio, TX
- County
- Bexar County · 1,990,555 people
- City population
- 1,806,925
- Metro
- San Antonio-New Braunfels, TX
- Population (ZIP)
- 36,168
- Household income
- $50,644
- Rent vs Own
- Severe rent burden
- 1778.0
Population outlook (Bexar County) Hauer SSP2
- Today (2025)
- 2,336,851 people
- By 2030
- 2,560,728 · +9.6%
- By 2040
- 3,020,569 · +29.3%
- By 2050
- 3,493,522 · +49.5%
- By 2075
- 4,668,459 · +99.8%
- By 2100
- 5,533,242 · +136.8%
Race, ethnicity, and origin ACS 2023
- Neighborhood character
- Predominantly Hispanic (86%)
- Race & ethnicity
- Hispanic / Latino 86% Two or more races 25% White 8% Black 3% Native American 2%
- Hispanic origin (detail)
- Mexican 67%
- Common ancestry
- Romanian 1% Italian 1%
- Foreign-born
- 20% · Canada
- Languages at home
- 43% English-only · Spanish 55%
Political lean MEDSL · Bexar
- 2024 margin
- Lean D (+9.8) · D 54.3% · R 44.6% · Other 1.1%
- 2008→2024 swing
- +4.2pp toward D · 2008: 5.6pp · 2024: 9.8pp
- All cycles
- 2024: D+9.8 2020: D+18.2 2016: D+13.5 2012: D+4.6 2008: D+5.6
Not yet ingested
- Civics
- —
Market trends
- HPI YoY
- ▼ -55.63%
- Current HPI
- 259.9788
- Rent YoY
- ▼ -1.32%
- Metro
- San Antonio-New Braunfels, TX
- State GDP YoY
- ▲ 3.95%
- F500 in state
- 110
Industry mix (Fortune 500 HQ in TX)
| Industry | F500 HQs | Revenue |
|---|---|---|
| Energy | 16 | $1,198B |
|
||
| Technology | 5 | $198B |
|
||
| Engineering / Construction | 4 | $72B |
|
||
| Energy Services | 3 | $60B |
|
||
| Utilities | 3 | $41B |
|
||
| Healthcare | 2 | $330B |
|
||
Price history
1 event — show timeline
- 2026-06-04 Listed $164,900 LERA
Property tax history
+3.2%/yrLatest (2025): $3,391 · -0.8% YoY. Source: county tax records.
Cash-flow waterfall
monthlySold comps — $/sqft
last 12 mo · ≤1 miLoading sold comps…