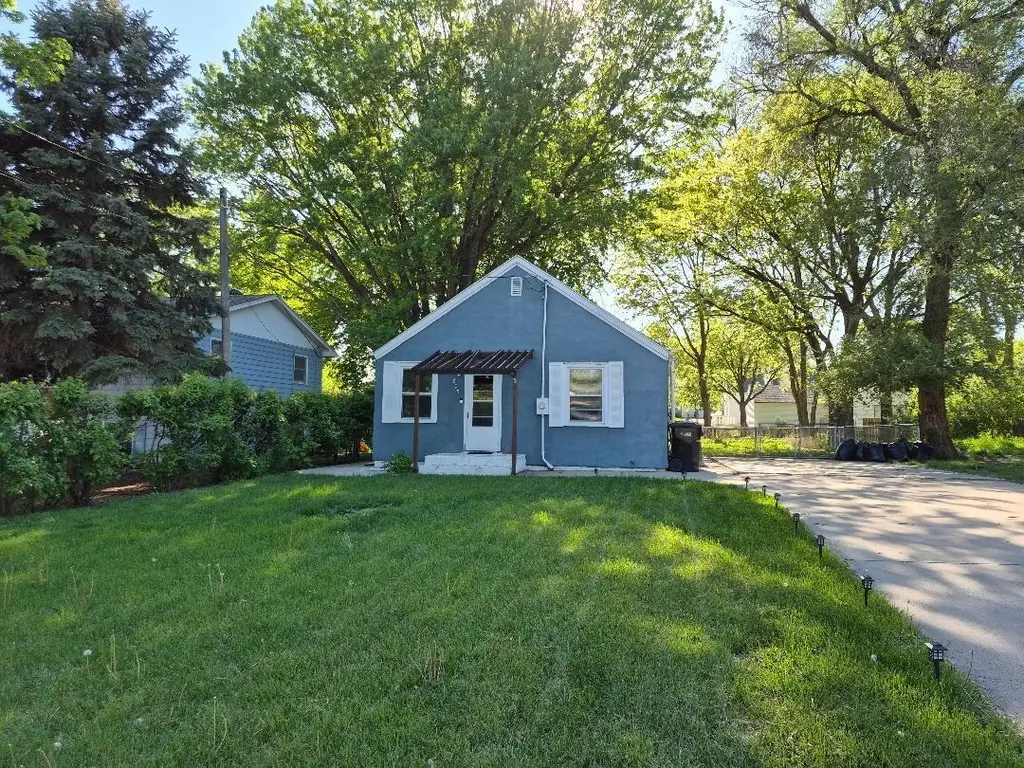
805 Spruce St · Yankton, SD
Flood risk 1/10 · Minimal
- FEMA flood zone
- X (unshaded)
- Chance of flooding over 30 yrs
- 0.0%
- Est. flood insurance / yr
- $507 – $1,088
Fire risk 4/10 · Minor
- Est. fire insurance / yr
- $1,342 – $2,492
Heat risk 3/10 · Minor
- Hot days now (above 102°F)
- 7 days/yr
- Hot days in 30 yrs
- 14 days/yr
Wind risk 2/10 · Minimal
- Chance of severe wind over 30 yrs
- —
Air-quality risk 2/10 · Minimal
- Unhealthy air days now
- 1 days/yr
- Unhealthy air days in 30 yrs
- 1 days/yr
Risk factors via First Street. Map © Google.
Why this score? — see what drove the C grade
The composite is a weighted blend of 9 inputs, each scored 0–100. Each bar is that input's sub-score; the figure is the points it added to the 100-point composite (weight × sub-score).
- Cash flow +22.3/30.0
- ARV discount +7.5/15.0
- DSCR +7.1/10.0
- 1% rule +5.3/10.0
- Schools +4.6/10.0
- Livability +3.8/5.0
- Rent growth +2.5/5.0
- Condition / age +2.5/5.0
- Appreciation +0.0/10.0
$155,000
🖨 Deal sheet 📄 Offer letter ✓ Due diligence
Listing remarks MLS
Take a look at this affordably priced 2 bed/1 bath home on a well-maintained lot. The main floor features a living room with laminate flooring, eat-in kitchen with tile backsplash, both bedrooms, and full bathroom. In the basement you’ll find a laundry area with newer carpet, radon mitigation system, and plenty of unfinished space to be used for storage, your home gym, or whatever you’d like! Don’t forget the outdoor offerings, such as a nicely kept lawn, new front pergola, fenced backyard, recently replaced roof, rear patio, and a large driveway for off-street parking. 805 Spruce is located in an established neighborhood and within walking distance to schools, parks, and medical facilities.
Key facts
- Unfinished basement
- Refreshed bathroom
- Covered patio
Tags
Property features AI
Finance
- Other: Lot frontage approximately 62 feet; Lot size approximately 0.2 acre
Exterior
- Utilities: Public water; Public sewer
- Home design: Single family residence; Residential property
- Construction: Above grade finished living area reported (624); Basement: full, unfinished
- Exterior features: Asphalt shingle roof
Interior
- Kitchen: Cooktop; Microwave; Refrigerator; Dishwasher not listed
- Bathrooms: 1 full bathroom; 1 half bathroom
- Heating & cooling: Natural gas forced air heating; Central air conditioning
- Interior features: Dryer; Refrigerator; Microwave; Cooktop; Full unfinished basement
- Laundry & utility: Dryer
Neighborhood map
What this means for you Summary
Snapshot
- This is a 2-bed/1.5-bath single-family listed at $155k.
Deal economics
- At list price, monthly cash flow is $255 ($3k/yr) — positive.
- The deal already cash-flows at list — no discount required.
- Meets the 1% rule at list price ($2k rent vs $155k).
Location & tenants
- Location reads 76/100 on livability (#23 in SD, #3,454 nationally) — a middle-class / working-renter tenant base. Strengths: cost of living A+, housing A+, health & safety A; Watch: amenities F, commute F.
- Yankton School District 63-3 (town): math 49% / reading 60% proficiency, ranked #17 of 59 in SD (top 29%) — acceptable for families but not a draw, mixed tenant base, ~2y average lease.
- Market conditions: 188 active listings in the ZIP; 1 comparable units currently listed for rent nearby; 179 units permitted in Yankton County in 2024 (130 in 5+ unit buildings).
Forward outlook
- Local home prices are declining (-3.0%/yr); year-one equity from $1k of loan paydown is wiped out by about $5k of value loss. Plan a longer hold.
- Yankton County population projected at +4% by 2050 — modest demand growth; plan on rents tracking national, not racing it.
Negotiation context
- Only 5 days on market — expect competitive offers; lowballing is unlikely to land.
- 6 sale attempts since 17y ago with the ask held roughly flat each time — persistent listings suggest the price (not the market) is what's stuck; bring a comps-based counter.
- Current owner paid $124k; 26% above their basis — modest negotiation headroom, anchor on the comps not their cost.
Risks & watch-outs
- Watch-outs: built in 1948 — expect roof / HVAC / electrical / plumbing capex.
Questions for the listing agent
- Built in 1948 — when were the roof, HVAC, electrical panel, plumbing, and water heater last replaced?
- Is there a deadline driving the sale (1031 exchange, divorce, estate, relocation)? That informs how much negotiation room exists.
- What's the average days-on-market for RENTAL listings here right now (not sales)? A rising rental-DOM trend means longer vacancies and softer asking-rent achievability than the comps imply.
- What's the recent tenant-quality profile in this submarket — average credit score on applications, eviction rate, late-payment / NSF rate, and stable-employment percentage? A property-management company in the area should have these aggregated.
- How much new for-sale + rental construction is in the pipeline within 1–3 miles? Heavy new supply typically softens prices + rents 12–24 months out; constrained supply supports both.
Investment metrics
- 1% rule
- 1.03% ✓
- Cap rate
- 8.27%
- Cash-on-cash
- 7.06%
- DSCR
- 1.31
- GRM
- 8.1
CMA / ARV
No comps found within radius.
Projected returns pro-forma
-3.0% appreciation · 3.0% rent growth · sell at horizon
- IRR
- -5.5%
- Equity multiple
- 0.80×
- Total profit
- $-8,875
- Equity at exit
- $23,111
- IRR
- 4.2%
- Equity multiple
- 1.30×
- Total profit
- $13,146
- Equity at exit
- $13,402
Cash invested: $43,400 (down + closing). Projections, not guarantees.
Landlord ↔ Tenant lean methodology
- Overall (STATE)
- 83 Strongly Landlord-Friendly
- State South Dakota
- 83 Strongly Landlord-Friendly · R+16
- County
- — inherits STATE
- City
- — inherits STATE
ZIP-level market 57078
- Active inventory
- 188
- Price-to-rent
- 8.1×
Monthly cashflow live
- Estimated rent
- $1,600 medium interval (Pro) →
- Mortgage (P&I)
- −$813
- Tax from tax record
- −$131 /mo · $1,576/yr
- Insurance
- −$65
- HOA
- −$0
- Vacancy / Maint / Mgmt
- −$336
- Net cashflow
- $255
Break-even live
UW: 25.0% down · 7.5% · 30yr · 1.5% tax · 5.0% vac · 8.0% maint · 8.0% mgmt
Financing live
Cash to close
- Down payment
- $38,750
- Closing costs
- $4,650
- Reserves months
- —
- Total cash needed
- —
Loan-product check · same deal, 3 products live
Conventional
25% down · 7.5% · 30yr
- Down + closing
- —
- Monthly P&I
- —
- Monthly cashflow
- —
- DSCR
- —
- Eligible?
- —
Personal DTI + credit; lowest rate.
DSCR
20% down · 8.5% · 30yr
- Down + closing
- —
- Monthly P&I
- —
- Monthly cashflow
- —
- DSCR
- —
- Eligible?
- —
No personal income docs; deal must DSCR.
Hard money
10% down · 12.0% · 12mo
- Down + closing
- —
- Monthly P&I
- —
- Monthly cashflow
- —
- DSCR
- —
- Eligible?
- —
Short-term bridge; refi at stabilization.
Rent comps 1 comps
| Address | Beds | Baths | Sqft | Rent | $/sqft | DOM | Units | Dist |
|---|---|---|---|---|---|---|---|---|
| 305 E 2nd St Yankton, SD | 2.0 | 1.0–2.0 | 706 | $1,600 | $2.26 | 43d | 8 | 1.03mi |
Listing history 5 events
-
2026-06-18status $155,000 Pending 5 DOM
-
2026-06-17days on market $155,000 Active 5 DOM
-
2026-06-16days on market $155,000 Active 4 DOM
-
2026-06-15days on market $155,000 Active 3 DOM
-
2026-06-12$155,000 Active 1 DOM
ⓘ Source: listings_history table (triggers on properties + properties_extension) + one-shot
backfill from property_details.listing_events for pre-trigger history.
Tax reassessment forecast SD · Resets to sale price
- Current annual tax
- $1,576 · $131/mo
- Projected year-2 tax
- $2,030 · $169/mo
- Expected delta
- +$454/yr (+$38/mo · 28.8%)
ⓘ Screening estimate from a state-policy table — verify with the county assessor before closing.
Climate risk First Street
- Flood 1/10 Low FEMA zone X (unshaded) · 0% chance over 30 yrs
- Wildfire 4/10 Moderate
- Heat 3/10 Moderate 7 d/yr ≥102°F today · 14 d/yr by 30 yrs out
- Wind 2/10 Low
- Air quality 2/10 Low 1 unhealthy d/yr today · 1 by 30 yrs out
Nearby sold comps map
Loading sold comps map…
Walkable amenities ~0.75 mi
Loading nearby amenities…
Taxation est. · year 1
- Rental income
- $19,200
- − Mortgage interest
- −$8,682
- − Property taxes
- −$1,576
- − Insurance
- −$775
- − Repairs & maintenance
- −$1,536
- − Management
- −$1,536
- − Depreciation
- −$4,509
- Taxable income
- $585
- Est. tax owed @ 24.0%
- −$140
- After-tax cash flow
- $2,922/yr
For passive investors: Depreciation is non-cash, so a rental often shows a tax loss while cash-flowing — sheltering income. Rental losses are passive: they offset passive income freely, and up to $25,000/yr can offset ordinary (W-2) income if you actively participate and your MAGI is under $100k (phasing out to $0 by $150k); unused losses carry forward. On sale, claimed depreciation is recaptured at up to 25%, and gains may owe capital-gains tax (a 1031 exchange can defer both). Figures are a year-1 estimate at your 24.0% rate — not tax advice; consult a CPA.
Schools (NCES district)
- District
- Yankton School District 63-3
- NCES district ID
- 4680430
- Math proficiency
- 49% ▼ -3.00%
- Reading proficiency
- 60% ▼ -1.00%
- Median HH income
- $48,788
- Composite
- 46.36/100
- National rank
- #2463
- State rank
- #17 of 59 in SD
Livability — Yankton
- Score
- 76/100
- State rank
- #23
- US rank
- #3454
Category grades
Schools grade is shown separately in the Schools card above.
Census & demographics
- Census place
- Yankton, SD
- Population (ZIP)
- 20,547
Population outlook (Yankton County) Hauer SSP2
- Today (2025)
- 23,495 people
- By 2030
- 23,705 · +0.9%
- By 2040
- 24,037 · +2.3%
- By 2050
- 24,561 · +4.5%
- By 2075
- 28,069 · +19.5%
- By 2100
- 33,542 · +42.8%
Race, ethnicity, and origin ACS 2023
- Neighborhood character
- Predominantly White (86%)
- Race & ethnicity
- White 86% Two or more races 7% Hispanic / Latino 6% Native American 3% Black 2%
- Hispanic origin (detail)
- Mexican 3% Cuban 2%
- Common ancestry
- Portuguese 7% Iranian 3% Lithuanian 3%
- Foreign-born
- 3% · Canada
- Languages at home
- 94% English-only · Spanish 4%
Political lean MEDSL · Yankton
- 2024 margin
- Strong R (+25.5) · D 35.9% · R 61.4% · Other 2.8%
- 2008→2024 swing
- -23.6pp toward R · 2008: -2.0pp · 2024: -25.5pp
- All cycles
- 2024: R+25.5 2020: R+23.5 2016: R+24.5 2012: R+12.7 2008: R+2.0
Not yet ingested
- Civics
- —
Market trends
- HPI YoY
- ▼ -113.11%
- Current HPI
- 193.4576
- Rent YoY
- —
- Metro
- —
- State GDP YoY
- ▲ 0.70%
- F500 in state
- 2
Industry mix (Fortune 500 HQ in SD)
| Industry | F500 HQs | Revenue |
|---|---|---|
| Utilities | 1 | $1B |
|
||
Price history
+136.6% since first listed15 events — show timeline
- 2026-05-25 Listed $155,000 MARMLS
- 2022-06-10 Sold (Public Records) $123,500 Public Records
- 2022-06-08 Sold (MLS) $123,200 MARMLS
- 2022-03-18 Listed $123,200 MARMLS
- 2021-08-25 Sold (Public Records) $115,000 Public Records
- 2021-08-20 Sold (MLS) $115,000 MARMLS
- 2021-06-23 Listed $115,000 MARMLS
- 2021-03-01 Sold (Public Records) $98,000 Public Records
- 2021-02-26 Sold (MLS) $97,850 MARMLS
- 2020-12-08 Listed $97,900 MARMLS
- 2016-08-31 Sold (Public Records) $70,000 Public Records
- 2016-08-31 Sold (MLS) $70,000 MARMLS
- 2016-04-25 Listed $72,000 MARMLS
- 2009-11-06 Sold (MLS) $64,000 MARMLS
- 2009-09-27 Listed $65,500 MARMLS
Property tax history
+7.0%/yrLatest (2025): $1,576 · +2.5% YoY. Source: county tax records.
Cash-flow waterfall
monthlySold comps — $/sqft
last 12 mo · ≤1 miLoading sold comps…