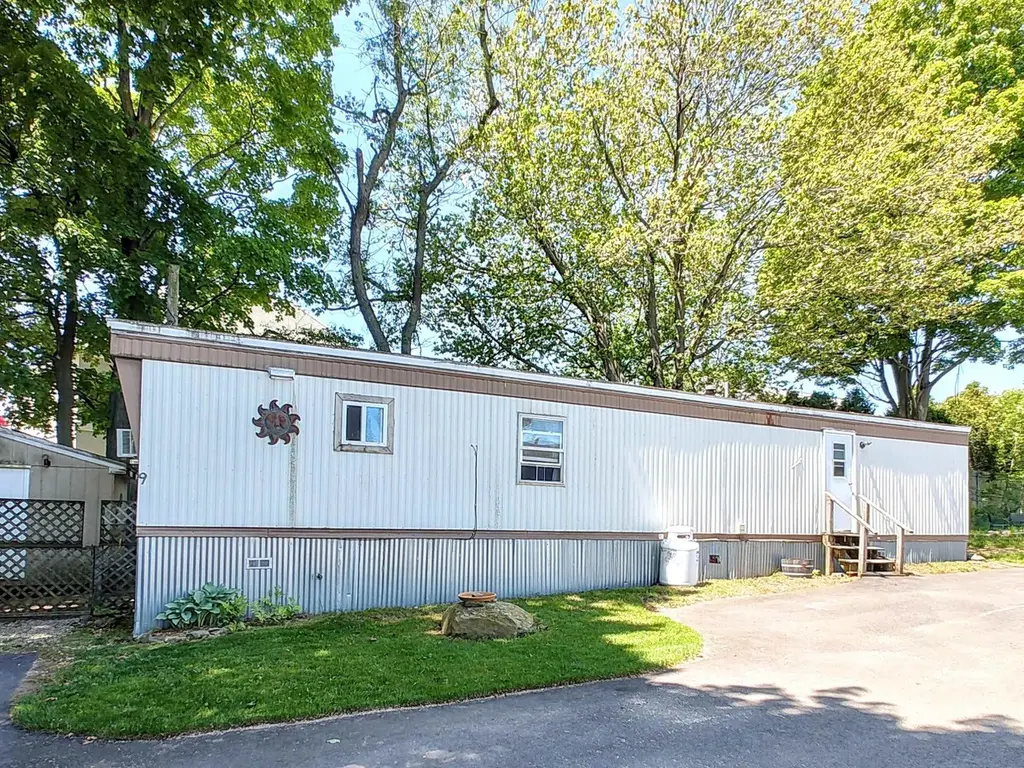
1338 Woodbury Ave #9 · Portsmouth, NH
Flood risk 1/10 · Minimal
- FEMA flood zone
- X
- Chance of flooding over 30 yrs
- 0.0%
- Est. flood insurance / yr
- $435 – $905
Fire risk 1/10 · Minimal
- Est. fire insurance / yr
- $507 – $941
Heat risk 4/10 · Minor
- Hot days now (above threshold)
- 7 days/yr
- Hot days in 30 yrs
- 16 days/yr
Wind risk No data
- Chance of severe wind over 30 yrs
- —
Air-quality risk 2/10 · Minimal
- Unhealthy air days now
- 2 days/yr
- Unhealthy air days in 30 yrs
- 2 days/yr
Risk factors via First Street. Map © Google.
Why this score? — see what drove the A- grade
The composite is a weighted blend of 9 inputs, each scored 0–100. Each bar is that input's sub-score; the figure is the points it added to the 100-point composite (weight × sub-score).
- Cash flow +30.0/30.0
- ARV discount +15.0/15.0
- 1% rule +10.0/10.0
- DSCR +10.0/10.0
- Schools +5.8/10.0
- Livability +4.3/5.0
- Rent growth +3.6/5.0
- Condition / age +2.5/5.0
- Appreciation +0.0/10.0
$100,000
🖨 Deal sheet 📄 Offer letter ✓ Due diligence
Listing remarks
First showings at the Open House on Saturday, May 30, 2026, 10am. Location meets affordability in this Portsmouth-area home! Tucked away in a quiet corner of a small community just minutes from downtown, this property offers a fantastic, budget-friendly alternative to renting, allowing you to move right in and build equity with a few updates. The home features an updated roof, a well-maintained furnace, and a four-year-old hot water heater—and all appliances are included. Outside, you'll find a fully fenced, private backyard complete with a deck and a spacious storage shed. This must-see home has a monthly park rent of $545 (see attached Rider) and allows dogs with restrictions (see
Key facts
- Built 1980
- Listed 14 days
Property features AI
Finance
- Other: Mobile co-op approved and park-approved; Unit/Lot number 9
- HOA & community: Monthly community fee of $545 covering trash and park rent; One-time buy-in fee of $200 (park fees / buy-in); One-time additional park fee of $75; Association provides trash removal
Exterior
- Parking: Paved driveway
- Utilities: Public water; Public sewer; 100 Amp service with circuit breakers; High-speed internet available; Cable available; Liquid propane (LP) gas available
- Home design: Manufactured home (Manuf/Mobile); Single-story entry (all main rooms listed on level 1); Beige exterior color; Metal roof
- Construction: Built in 1980; Metal siding; Manufactured home structure
- Exterior features: Leased lot; Paved driveway; Located in a mobile home cooperative (Woodbury Cooperative)
Interior
- Kitchen: Dishwasher; Gas range; Microwave; Refrigerator
- Bedrooms: Bedroom on level 1
- Flooring: Carpet; Laminate; Vinyl
- Bathrooms: 1 full bathroom on level 1
- Heating & cooling: Forced air heat; Kerosene heat; Oil heat
- Interior features: 4 total rooms; Bonus room; Living room
- Laundry & utility: Washer; Dryer
Neighborhood map
What this means for you Summary
Snapshot
- This is a 2-bed/1.0-bath manufactured listed at $100k.
Deal economics
- At list price, monthly cash flow is $1k ($12k/yr) — positive.
- The deal already cash-flows at list — no discount required.
- Meets the 1% rule at list price ($3k rent vs $100k).
- Cap rate 18.4% vs local median 1.9% in Portsmouth — top-decile yield for the area; either an underpriced asset or a hidden risk that comps aren't pricing in. Stress-test before assuming the spread holds.
Location & tenants
- Location reads 86/100 on livability (#5 in NH, #354 nationally) — a professional / high-income tenant draw. Strengths: schools A+, commute A+, employment A+; Watch: cost of living F.
- Portsmouth School District (suburban): math 60% / reading 72% proficiency, ranked #13 of 98 in NH (top 13%) — acceptable for families but not a draw, mixed tenant base, ~2y average lease; only 18% free/reduced lunch — higher-income household profile.
- Market conditions: Rents rising fast (+4.4%/yr); 157 active listings in the ZIP; 12 comparable units currently listed for rent nearby; rentals leasing fast (median 5d on market — plan ~1-2 weeks tenant-placement turnaround); solid renter incomes; 1,276 units permitted in Rockingham County in 2024 (593 in 5+ unit buildings).
- This rent runs 32% of the median local income ($107k/yr) — at the standard rent-burdened threshold; future hikes will face affordability resistance.
Forward outlook
- Local home prices are declining (-3.0%/yr); year-one equity from $691 of loan paydown is wiped out by about $3k of value loss. Plan a longer hold.
- At projected returns (-3.0% appreciation + 4.4% rent growth), your $28k cash investment doubles in ~3 years — after that, you're playing with house money.
Negotiation context
- Only 14 days on market — expect competitive offers; lowballing is unlikely to land.
Risks & watch-outs
- Watch-outs: HOA is 21% of rent.
Questions for the listing agent
- What does the HOA fee cover, when was the last increase, and are there any pending special assessments or reserve-fund shortfalls?
- Is there a deadline driving the sale (1031 exchange, divorce, estate, relocation)? That informs how much negotiation room exists.
- Schools are A-rated — typically a magnet for longer-tenancy family renters. What's the average tenant stay here, and is there a school-zone premium baked into asking?
- What's the average days-on-market for RENTAL listings here right now (not sales)? A rising rental-DOM trend means longer vacancies and softer asking-rent achievability than the comps imply.
- What's the recent tenant-quality profile in this submarket — average credit score on applications, eviction rate, late-payment / NSF rate, and stable-employment percentage? A property-management company in the area should have these aggregated.
- How much new for-sale + rental construction is in the pipeline within 1–3 miles? Heavy new supply typically softens prices + rents 12–24 months out; constrained supply supports both.
Investment metrics
- 1% rule
- 2.80% ✓
- Cap rate
- 18.36%
- Cash-on-cash
- 43.10%
- DSCR
- 2.92
- GRM
- 3.0
CMA / ARV
- ARV (on-the-fly)
- $139,048
- Comps found
- 4
Show comp detail 4 sales within ~0.75 mi
| Address | Dist | Beds/Ba | Sqft | Sold | Price | $/sf | Match |
|---|---|---|---|---|---|---|---|
| 1338 Woodbury Ave #13 | 0.00mi | 1/1.0 (-1) | 630 (-14%) | 1mo | $157,000 | $249 | 72 |
| 106 Oriental Gdns | 0.63mi | 2/1.0 | 732 (+0%) | 17mo | $140,000 | $191 | 56 |
| 305 Oriental Gdns | 0.58mi | 2/1.0 | 784 (+8%) | 14mo | $125,000 | $159 | 48 |
| 301 Oriental Gdns | 0.64mi | 2/1.0 | 640 (-12%) | 15mo | $108,000 | $169 | 37 |
Match score weights: distance 35% · size 25% · config 20% · recency 20%. Top-matched comps best support the ARV.
Projected returns pro-forma
-3.0% appreciation · 4.41% rent growth · sell at horizon
- IRR
- 42.2%
- Equity multiple
- 2.87×
- Total profit
- $52,246
- Equity at exit
- $14,910
- IRR
- 49.2%
- Equity multiple
- 6.23×
- Total profit
- $146,479
- Equity at exit
- $8,646
Cash invested: $28,000 (down + closing). Projections, not guarantees.
Landlord ↔ Tenant lean methodology
- Overall (STATE)
- 56 Moderately Landlord-Leaning
- State New Hampshire
- 56 Moderately Landlord-Leaning · D+1
- County
- — inherits STATE
- City
- — inherits STATE
ZIP-level market 03801
- Rents YoY
- 4.4%
- Active inventory
- 157
- Price-to-rent
- 3.0×
Monthly cashflow live
- Estimated rent
- $2,804 high interval (Pro) →
- Mortgage (P&I)
- −$524
- Tax from tax record
- −$43 /mo · $520/yr
- Insurance
- −$42
- HOA
- −$600
- Vacancy / Maint / Mgmt
- −$589
- Net cashflow
- $1,006
Break-even live
UW: 25.0% down · 7.5% · 30yr · 1.5% tax · 5.0% vac · 8.0% maint · 8.0% mgmt
Financing live
Cash to close
- Down payment
- $25,000
- Closing costs
- $3,000
- Reserves months
- —
- Total cash needed
- —
Loan-product check · same deal, 3 products live
Conventional
25% down · 7.5% · 30yr
- Down + closing
- —
- Monthly P&I
- —
- Monthly cashflow
- —
- DSCR
- —
- Eligible?
- —
Personal DTI + credit; lowest rate.
DSCR
20% down · 8.5% · 30yr
- Down + closing
- —
- Monthly P&I
- —
- Monthly cashflow
- —
- DSCR
- —
- Eligible?
- —
No personal income docs; deal must DSCR.
Hard money
10% down · 12.0% · 12mo
- Down + closing
- —
- Monthly P&I
- —
- Monthly cashflow
- —
- DSCR
- —
- Eligible?
- —
Short-term bridge; refi at stabilization.
Rent comps 12 comps
| Address | Beds | Baths | Sqft | Rent | $/sqft | DOM | Units | Dist |
|---|---|---|---|---|---|---|---|---|
| 126 Concord Way Portsmouth, NH | 2.0 | 1.0 | 684 | $2,600 | $3.80 | 43d | 1 | 0.93mi |
| 67 Porpoise Way Portsmouth, NH | 2.0 | 1.0 | 684 | $3,700 | $5.41 | 1d | 1 | 0.93mi |
| 23 Concord Way Portsmouth, NH | 2.0 | 1.0 | 684 | $2,300 | $3.36 | 10d | 1 | 0.99mi |
| 35 Hodgdon Way Portsmouth, NH | 2.0 | 1.0–2.0 | 717 | $3,705 | $5.17 | 1d | 20 | 1.23mi |
| 823 Islington St Unit 823-2 Portsmouth, NH | 1.0 | 1.0 | 750 | $2,200 | $2.93 | 5d | 1 | 1.36mi |
| 314 Islington St #5 Portsmouth, NH | 1.0 | 1.0 | 624 | $2,600 | $4.17 | 5d | 1 | 1.38mi |
| 238 Deer St #205 Portsmouth, NH | 1.0 | 1.0 | 498 | $2,400 | $4.82 | 43d | 1 | 1.40mi |
| 185 Madison St #1 Portsmouth, NH | 1.0 | 1.0 | 634 | $2,500 | $3.94 | 4d | 1 | 1.44mi |
| 188 Madison St Portsmouth, NH | 1.0–2.0 | 1.0 | 742 | $2,600 | $3.50 | 1d | 1 | 1.45mi |
| 7 Portwalk Pl Portsmouth, NH | 2.0 | 1.0–2.0 | 881 | $5,045 | $5.73 | 1d | 14 | 1.48mi |
| 406 The Hl Portsmouth, NH | 1.0 | 1.5 | 750 | $2,350 | $3.13 | 18d | 1 | 1.49mi |
| 406 The Hl Apt 1 Portsmouth, NH | 1.0 | 1.0 | 750 | $2,295 | $3.06 | 20d | 1 | 1.49mi |
HOA detail
- Monthly dues
- $600 · $7,200/yr
- Likely covers
- water
Listing history 9 events
-
2026-06-13statusdays on market $100,000 Pending 14 DOM
-
2026-06-09days on market $100,000 Active 10 DOM
-
2026-06-08days on market $100,000 Active 9 DOM
-
2026-06-07days on market $100,000 Active 8 DOM
-
2026-06-04days on market $100,000 Active 5 DOM
-
2026-06-03days on market $100,000 Active 4 DOM
-
2026-06-02days on market $100,000 Active 3 DOM
-
2026-06-01days on market $100,000 Active 2 DOM
-
2026-05-26historical $100,000
ⓘ Source: listings_history table (triggers on properties + properties_extension) + one-shot
backfill from property_details.listing_events for pre-trigger history.
Tax reassessment forecast NH · Partial reset (capped growth)
- Current annual tax
- $520 · $43/mo
- Projected year-2 tax
- $1,350 · $112/mo
- Expected delta
- +$830/yr (+$69/mo · 159.6%)
ⓘ Screening estimate from a state-policy table — verify with the county assessor before closing.
Climate risk First Street
- Flood 1/10 Low FEMA zone X · 0% chance over 30 yrs
- Wildfire 1/10 Low
- Heat 4/10 Moderate
- Air quality 2/10 Low 2 unhealthy d/yr today · 2 by 30 yrs out
Nearby sold comps map
Loading sold comps map…
Walkable amenities ~0.75 mi
Loading nearby amenities…
Taxation est. · year 1
- Rental income
- $33,648
- − Mortgage interest
- −$5,602
- − Property taxes
- −$520
- − Insurance
- −$500
- − Repairs & maintenance
- −$2,692
- − Management
- −$2,692
- − HOA
- −$7,200
- − Depreciation
- −$2,909
- Taxable income
- $11,534
- Est. tax owed @ 24.0%
- −$2,768
- After-tax cash flow
- $9,301/yr
For passive investors: Depreciation is non-cash, so a rental often shows a tax loss while cash-flowing — sheltering income. Rental losses are passive: they offset passive income freely, and up to $25,000/yr can offset ordinary (W-2) income if you actively participate and your MAGI is under $100k (phasing out to $0 by $150k); unused losses carry forward. On sale, claimed depreciation is recaptured at up to 25%, and gains may owe capital-gains tax (a 1031 exchange can defer both). Figures are a year-1 estimate at your 24.0% rate — not tax advice; consult a CPA.
Schools (NCES district)
- District
- Portsmouth School District
- NCES district ID
- 3305820
- Math proficiency
- 60% ▼ -9.00%
- Reading proficiency
- 72% ▼ -3.00%
- Median HH income
- $67,302
- Composite
- 57.66/100
- National rank
- #1060
- State rank
- #13 of 98 in NH
Livability — Portsmouth
- Score
- 86/100
- State rank
- #5
- US rank
- #354
Category grades
Schools grade is shown separately in the Schools card above.
Census & demographics
- Census place
- Portsmouth, NH
- County
- Rockingham County · 137,526 people
- City population
- 23,484
- Metro
- Boston-Cambridge-Newton, MA-NH
- Population (ZIP)
- 23,484
- Household income
- $106,756
- Rent vs Own
- Severe rent burden
- 843.0
Population outlook (Rockingham County) Hauer SSP2
- Today (2025)
- 316,118 people
- By 2030
- 320,929 · +1.5%
- By 2040
- 323,358 · +2.3%
- By 2050
- 314,977 · -0.4%
- By 2075
- 297,686 · -5.8%
- By 2100
- 256,363 · -18.9%
Race, ethnicity, and origin ACS 2023
- Neighborhood character
- Predominantly White (87%)
- Race & ethnicity
- White 87% Two or more races 5% Asian 4% Hispanic / Latino 3%
- Common ancestry
- Lithuanian 5% Slovak 5% Romanian 3%
- Foreign-born
- 9% · Canada, China, South Korea
- Languages at home
- 91% English-only · Other Indo-European 3% Spanish 2% Chinese 1%
Political lean MEDSL · Rockingham
- 2024 margin
- Toss-up / Even · D 48.3% · R 50.8%
- 2008→2024 swing
- -3.5pp toward R · 2008: 1.1pp · 2024: -2.4pp
- All cycles
- 2024: R+2.4 2020: D+2.1 2016: R+5.8 2012: R+4.5 2008: D+1.1
Not yet ingested
- Civics
- —
Market trends
- HPI YoY
- ▼ -281.76%
- Current HPI
- 383.8843
- Rent YoY
- ▲ 4.41%
- Metro
- Boston-Cambridge-Newton, MA-NH
- State GDP YoY
- —
- F500 in state
- 0
Price history
1 event — show timeline
- 2026-05-26 Coming Soon $100,000 PrimeMLS
Property tax history
+5.8%/yrLatest (2025): $520 · +3.0% YoY. Source: county tax records.
Cash-flow waterfall
monthlySold comps — $/sqft
last 12 mo · ≤1 miLoading sold comps…