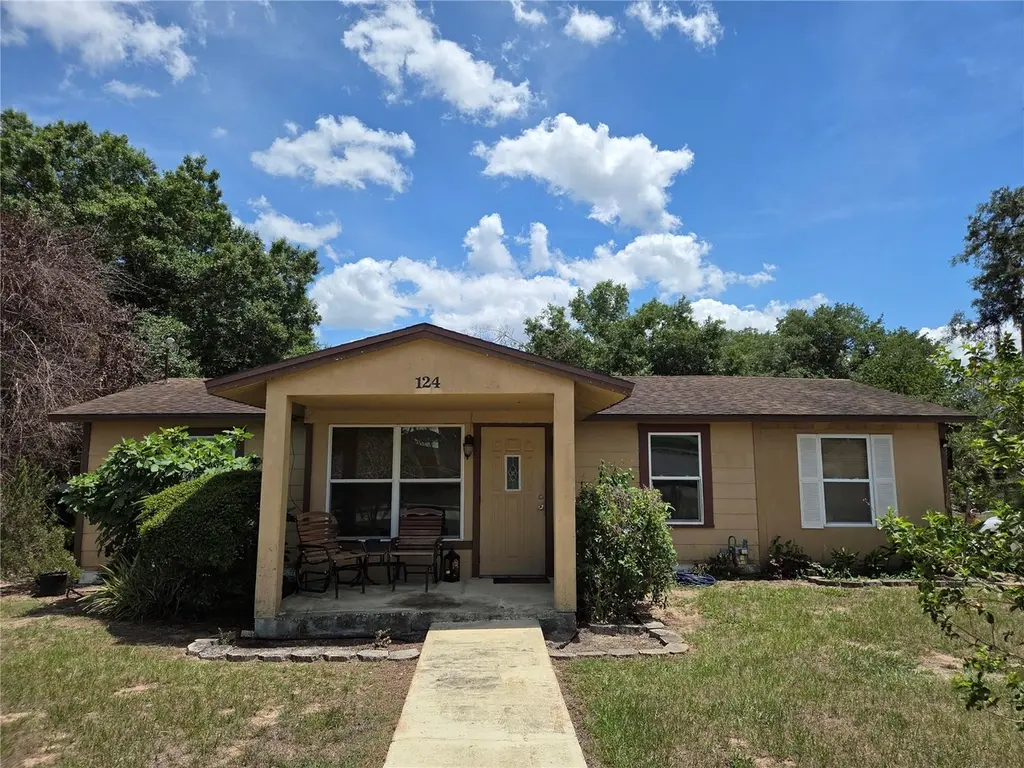
124 E F St · Frostproof, FL
Flood risk 1/10 · Minimal
- FEMA flood zone
- X (unshaded)
- Chance of flooding over 30 yrs
- 0.0%
- Est. flood insurance / yr
- $507 – $1,088
Fire risk 5/10 · Moderate
- Est. fire insurance / yr
- $947 – $1,759
Heat risk 8/10 · Major
- Hot days now (above 108°F)
- 7 days/yr
- Hot days in 30 yrs
- 24 days/yr
Wind risk 9/10 · Severe
- Chance of severe wind over 30 yrs
- 99.0%
Air-quality risk 1/10 · Minimal
- Unhealthy air days now
- 0 days/yr
- Unhealthy air days in 30 yrs
- 0 days/yr
Risk factors via First Street. Map © Google.
Why this score? — see what drove the C+ grade
The composite is a weighted blend of 9 inputs, each scored 0–100. Each bar is that input's sub-score; the figure is the points it added to the 100-point composite (weight × sub-score).
- Cash flow +26.1/30.0
- DSCR +8.8/10.0
- ARV discount +7.5/15.0
- 1% rule +5.9/10.0
- Appreciation +4.7/10.0
- Schools +3.5/10.0
- Livability +3.5/5.0
- Rent growth +2.5/5.0
- Condition / age +2.5/5.0
$139,900
🖨 Deal sheet 📄 Offer letter ✓ Due diligence
Listing remarks
Charming 3 bedroom, 1 bath home with a versatile den (3rd bedroom doesn't have a closet). Situated on a spacious 0.35-acre lot, this inviting home offers over 1,300 square feet of comfortable living space. Step inside to a welcoming entryway that leads to a cozy living room and a formal dining area. The kitchen boasts ample counter space, a lovely backsplash, plenty of cabinets for storage, and space for an eat-in area. Enjoy relaxing on the screened rear porch overlooking the expansive backyard. Additional highlights include a fully fenced yard, storage shed with electricity, a covered front porch, and a two-car driveway. Don't miss this delightful property; schedule an appointment today.
Key facts
- Ample counter space
- Cozy living room
- Versatile den
Tags
Property features AI
Finance
- Other: Homestead-exempt property; Zoned R60; Lot about 0.35 acres (approx. 1/4 to less than 1/2 acre)
- HOA & community: No HOA association; Pets allowed
Exterior
- Parking: Driveway
- Utilities: Public water; Public sewer; Broadband/high-speed internet available; Electricity connected; Natural gas connected
- Home design: Single family residence; One story; Faces north; Located within city limits; Paved road access
- Construction: Asbestos and frame construction; Shingle roof; Crawlspace foundation; Built with public records living area of 1,356 sq ft
- Exterior features: Front porch; Rear screened porch; French doors; Exterior lighting; Exterior storage; Chain link fence; Shed(s)
Interior
- Kitchen: Dishwasher; Microwave; Range; Range hood; Refrigerator; Gas water heater
- Bedrooms: 3 bedrooms
- Flooring: Carpet; Linoleum; Vinyl
- Bathrooms: 1 full bathroom
- Heating & cooling: Central heating; Central air conditioning
- Interior features: Ceiling fans; Eat-in kitchen; Thermostat
- Laundry & utility: Interior laundry
Neighborhood map
What this means for you Summary
Snapshot
- This is a 2-bed/1.0-bath single-family listed at $140k.
Deal economics
- At list price, monthly cash flow is $352 ($4k/yr) — positive.
- The deal already cash-flows at list — no discount required.
- Meets the 1% rule at list price ($2k rent vs $140k).
Location & tenants
- Location reads 69/100 on livability (#456 in FL) — a middle-class / working-renter tenant base. Strengths: cost of living A+, housing A+, health & safety A+; Watch: amenities F, commute F, employment D-.
- Polk (suburban): math 39% / reading 43% proficiency, ranked #62 of 73 in FL (top 85%) — families likely to look elsewhere, expect single-tenant / working-renter base with shorter leases.
- Zoned schools: Frostproof Ben Hill Griffin Jr Elementary School (math 34% / reading 36%, grade F, #1,697 of 2,144 statewide, top 80%, 917 students, 66% FRL); Frostproof Middle/Senior High (math 34% / reading 34%, grade F, #394 of 667 statewide, top 60%, 1,150 students, 60% FRL) — zoned schools at 63% FRL track the district average.
- Market conditions: 437 active listings in the ZIP; 4 comparable units currently listed for rent nearby; rentals at typical pace (median 14d on market — plan ~3-4 weeks tenant-placement turnaround); 10,384 units permitted in Polk County in 2024 (1,716 in 5+ unit buildings).
Forward outlook
- In year one you build about $28 of equity ($967 loan paydown + $-939 appreciation (-0.7% local appreciation)).
- Polk County population projected at +33% by 2050 — long-run rental-demand tailwind backs the buy-and-hold thesis.
- At projected returns (-0.7% appreciation + 3.0% rent growth), your $39k cash investment doubles in ~7 years — after that, you're playing with house money.
Negotiation context
- Only 6 days on market — expect competitive offers; lowballing is unlikely to land.
- 2 sale attempts since 21y ago with the ask held roughly flat each time — persistent listings suggest the price (not the market) is what's stuck; bring a comps-based counter.
- Current owner paid $38k; list at $140k implies a 263% gain — meaningful room to come down on a strong offer.
Risks & watch-outs
- Watch-outs: built in 1951 — expect roof / HVAC / electrical / plumbing capex.
- Climate carrying-cost: severe wind risk, 99% chance of damaging wind over 30y; moderate wildfire risk; extreme-heat days projected 7→24/yr by 2055 (HVAC capex compounding) — expect insurance premiums to compound above CPI over the hold.
Questions for the listing agent
- Built in 1951 — when were the roof, HVAC, electrical panel, plumbing, and water heater last replaced?
- Is there a deadline driving the sale (1031 exchange, divorce, estate, relocation)? That informs how much negotiation room exists.
- Schools are D-rated, which usually means shorter tenancies and higher turnover. Who's the typical renter profile here, and what's been the actual vacancy rate?
- What's the average days-on-market for RENTAL listings here right now (not sales)? A rising rental-DOM trend means longer vacancies and softer asking-rent achievability than the comps imply.
- What's the recent tenant-quality profile in this submarket — average credit score on applications, eviction rate, late-payment / NSF rate, and stable-employment percentage? A property-management company in the area should have these aggregated.
- How much new for-sale + rental construction is in the pipeline within 1–3 miles? Heavy new supply typically softens prices + rents 12–24 months out; constrained supply supports both.
Investment metrics
- 1% rule
- 1.09% ✓
- Cap rate
- 9.32%
- Cash-on-cash
- 10.79%
- DSCR
- 1.48
- GRM
- 7.7
CMA / ARV
No comps found within radius.
Projected returns pro-forma
-0.67% appreciation · 3.0% rent growth · sell at horizon
- IRR
- 7.8%
- Equity multiple
- 1.36×
- Total profit
- $13,943
- Equity at exit
- $35,991
- IRR
- 13.6%
- Equity multiple
- 2.39×
- Total profit
- $54,414
- Equity at exit
- $39,720
Cash invested: $39,172 (down + closing). Projections, not guarantees.
Landlord ↔ Tenant lean methodology
- Overall (STATE)
- 87 Strongly Landlord-Friendly
- State Florida
- 87 Strongly Landlord-Friendly · R+3
- County
- — inherits STATE
- City
- — inherits STATE
ZIP-level market 33843
- Home prices YoY
- -0.2%
- Active inventory
- 437
- Price-to-rent
- 7.7×
Monthly cashflow live
- Estimated rent
- $1,519 medium interval (Pro) →
- Mortgage (P&I)
- −$734
- Tax from tax record
- −$56 /mo · $671/yr
- Insurance
- −$58
- HOA
- −$0
- Vacancy / Maint / Mgmt
- −$319
- Net cashflow
- $352
Break-even live
UW: 25.0% down · 7.5% · 30yr · 1.5% tax · 5.0% vac · 8.0% maint · 8.0% mgmt
Financing live
Cash to close
- Down payment
- $34,975
- Closing costs
- $4,197
- Reserves months
- —
- Total cash needed
- —
Loan-product check · same deal, 3 products live
Conventional
25% down · 7.5% · 30yr
- Down + closing
- —
- Monthly P&I
- —
- Monthly cashflow
- —
- DSCR
- —
- Eligible?
- —
Personal DTI + credit; lowest rate.
DSCR
20% down · 8.5% · 30yr
- Down + closing
- —
- Monthly P&I
- —
- Monthly cashflow
- —
- DSCR
- —
- Eligible?
- —
No personal income docs; deal must DSCR.
Hard money
10% down · 12.0% · 12mo
- Down + closing
- —
- Monthly P&I
- —
- Monthly cashflow
- —
- DSCR
- —
- Eligible?
- —
Short-term bridge; refi at stabilization.
Rent comps 4 comps
| Address | Beds | Baths | Sqft | Rent | $/sqft | DOM | Units | Dist |
|---|---|---|---|---|---|---|---|---|
| 120 Chesney Blvd Frostproof, FL | 3.0 | 2.0 | 944 | $1,495 | $1.58 | 2d | 1 | 0.16mi |
| 307 N Lake Reedy Blvd Frostproof, FL | 3.0 | 2.0 | 1254 | $1,550 | $1.24 | 13d | 1 | 0.21mi |
| 307 N Lake Reedy Blvd Frostproof, FL | 3.0 | 2.0 | 1254 | $1,550 | $1.24 | 14d | 1 | 0.21mi |
| 313 S Palm Ave Frostproof, FL | 3.0 | 1.0 | 896 | $1,300 | $1.45 | 14d | 1 | 0.88mi |
Listing history 6 events
-
2026-06-18days on market $139,900 Active 6 DOM
-
2026-06-17days on market $139,900 Active 5 DOM
-
2026-06-16days on market $139,900 Active 4 DOM
-
2026-06-15days on market $139,900 Active 3 DOM
-
2026-06-13remarks 698-char remark
-
2026-06-13$139,900 Active 1 DOM
ⓘ Source: listings_history table (triggers on properties + properties_extension) + one-shot
backfill from property_details.listing_events for pre-trigger history.
Tax reassessment forecast FL · Resets to sale price
- Current annual tax
- $671 · $56/mo
- Projected year-2 tax
- $1,161 · $97/mo
- Expected delta
- +$490/yr (+$41/mo · 73.1%)
ⓘ Screening estimate from a state-policy table — verify with the county assessor before closing.
Climate risk First Street
- Flood 1/10 Low FEMA zone X (unshaded) · 0% chance over 30 yrs
- Wildfire 5/10 Major
- Heat 8/10 Severe 7 d/yr ≥108°F today · 24 d/yr by 30 yrs out
- Wind 9/10 Extreme 99% chance of damaging wind over 30 yrs
- Air quality 1/10 Low 0 unhealthy d/yr today · 0 by 30 yrs out
Nearby sold comps map
Loading sold comps map…
Walkable amenities ~0.75 mi
Loading nearby amenities…
Taxation est. · year 1
- Rental income
- $18,231
- − Mortgage interest
- −$7,837
- − Property taxes
- −$671
- − Insurance
- −$700
- − Repairs & maintenance
- −$1,458
- − Management
- −$1,458
- − Depreciation
- −$4,070
- Taxable income
- $2,037
- Est. tax owed @ 24.0%
- −$489
- After-tax cash flow
- $3,739/yr
For passive investors: Depreciation is non-cash, so a rental often shows a tax loss while cash-flowing — sheltering income. Rental losses are passive: they offset passive income freely, and up to $25,000/yr can offset ordinary (W-2) income if you actively participate and your MAGI is under $100k (phasing out to $0 by $150k); unused losses carry forward. On sale, claimed depreciation is recaptured at up to 25%, and gains may owe capital-gains tax (a 1031 exchange can defer both). Figures are a year-1 estimate at your 24.0% rate — not tax advice; consult a CPA.
Schools (NCES district)
- District
- Polk
- NCES district ID
- 1201590
- Math proficiency
- 39% ▼ -11.00%
- Reading proficiency
- 43% ▼ -4.00%
- Median HH income
- $43,979
- Composite
- 34.74/100
- National rank
- #5132
- State rank
- #62 of 73 in FL
Livability — Frostproof
- Score
- 69/100
- State rank
- #456
- US rank
- #8297
Category grades
Schools grade is shown separately in the Schools card above.
Census & demographics
- Census place
- Frostproof, FL
- Population (ZIP)
- 11,072
Population outlook (Polk County) Hauer SSP2
- Today (2025)
- 752,975 people
- By 2030
- 804,621 · +6.9%
- By 2040
- 906,117 · +20.3%
- By 2050
- 1,000,476 · +32.9%
- By 2075
- 1,197,520 · +59.0%
- By 2100
- 1,271,518 · +68.9%
Race, ethnicity, and origin ACS 2023
- Neighborhood character
- Majority White (65%)
- Race & ethnicity
- White 65% Hispanic / Latino 24% Two or more races 14% Black 8%
- Hispanic origin (detail)
- Mexican 12% Puerto Rican 9% Cuban 2%
- Common ancestry
- Slovak 3% Italian 1% Romanian 1%
- Foreign-born
- 8% · Canada, Jamaica
- Languages at home
- 78% English-only · Spanish 20%
Political lean MEDSL · Polk
- 2024 margin
- Strong R (+20.7) · D 39.2% · R 59.9%
- 2008→2024 swing
- -14.6pp toward R · 2008: -6.1pp · 2024: -20.7pp
- All cycles
- 2024: R+20.7 2020: R+14.4 2016: R+14.1 2012: R+6.8 2008: R+6.1
Not yet ingested
- Civics
- —
Market trends
- HPI YoY
- ▼ -0.67%
- Current HPI
- 311.1519
- Rent YoY
- —
- Metro
- —
- State GDP YoY
- ▲ 3.28%
- F500 in state
- 36
Industry mix (Fortune 500 HQ in FL)
| Industry | F500 HQs | Revenue |
|---|---|---|
| Industrial Technology | 2 | $29B |
|
||
| Insurance | 2 | $17B |
|
||
| Retail | 1 | $60B |
|
||
| Technology Distribution | 1 | $58B |
|
||
| Homebuilding | 1 | $35B |
|
||
| Technology Manufacturing | 1 | $35B |
|
||
Price history
+263.4% since first listed4 events — show timeline
- 2026-06-12 Listed $139,900 Stellar MLS as Distributed by MLS Grid
- 2005-05-02 Listing Removed — Stellar MLS as Distributed by MLS Grid
- 2005-04-27 Listed $69,900 Stellar MLS as Distributed by MLS Grid
- 1996-08-14 Sold (Public Records) $38,500 Public Records
Property tax history
+7.7%/yrLatest (2025): $671 · +1.2% YoY. Source: county tax records.
Cash-flow waterfall
monthlySold comps — $/sqft
last 12 mo · ≤1 miLoading sold comps…