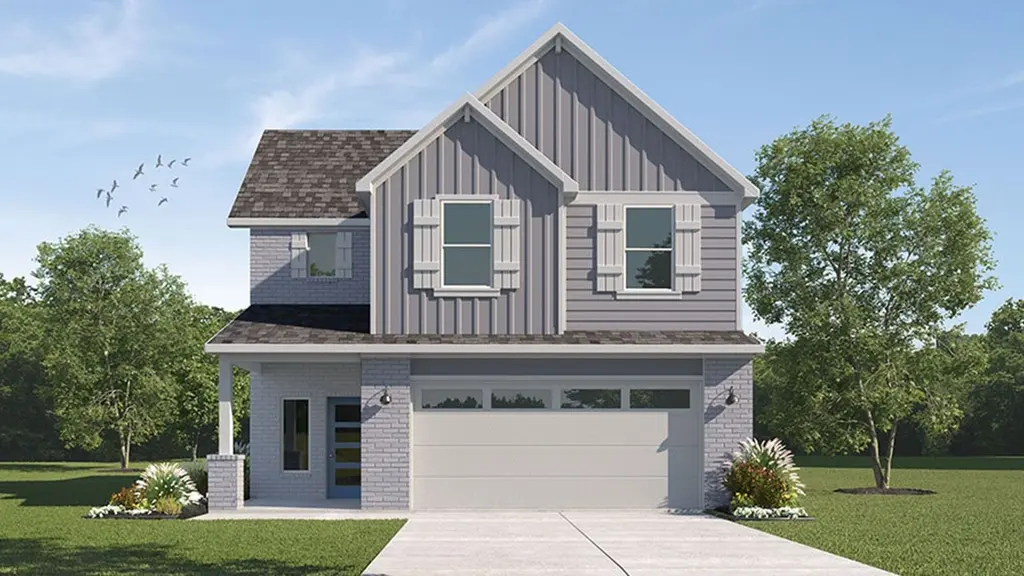
10313 Neptune Ct · Waco, TX
Flood risk 1/10 · Minimal
- FEMA flood zone
- X (unshaded)
- Chance of flooding over 30 yrs
- 0.0%
- Est. flood insurance / yr
- $507 – $1,088
Fire risk 6/10 · Moderate
- Est. fire insurance / yr
- $1,222 – $2,270
Heat risk 7/10 · Major
- Hot days now (above 109°F)
- 7 days/yr
- Hot days in 30 yrs
- 23 days/yr
Wind risk 6/10 · Moderate
- Chance of severe wind over 30 yrs
- 61.0%
Air-quality risk 2/10 · Minimal
- Unhealthy air days now
- 0 days/yr
- Unhealthy air days in 30 yrs
- 1 days/yr
Risk factors via First Street. Map © Google.
Why this score? — see what drove the D- grade
The composite is a weighted blend of 9 inputs, each scored 0–100. Each bar is that input's sub-score; the figure is the points it added to the 100-point composite (weight × sub-score).
- ARV discount +11.7/15.0
- Cash flow +8.7/30.0
- Schools +5.1/10.0
- Livability +3.7/5.0
- 1% rule +2.7/10.0
- Condition / age +2.5/5.0
- DSCR +2.4/10.0
- Rent growth +2.3/5.0
- Appreciation +0.0/10.0
$298,465
🖨 Deal sheet 📄 Offer letter ✓ Due diligence
Listing remarks
Step into the Emma floorplan at our Eagles Landing community in China Spring, Texas. This two-story floorplan offers approximately 1,691 square feet, 3 bedrooms, 2.5 bathrooms and a 2-car garage. Walk into the long foyer straight into the large family room overlooking the spacious kitchen and dining nook. The kitchen features granite countertops, flat panel birch cabinets, granite backsplash, stainless-steel appliances, and a kitchen island. Enjoy nature of the backyard with the covered patio that is attached to the nook. Heading upstairs you will have access to both secondary bedrooms and the primary bedroom. Each of the secondary bedrooms include carpet and walk-in closets with easy acces
Key facts
- Granite backsplash
- Kitchen island
- Granite countertops
Tags
Property features AI
Finance
- Financial info: List price $298,465
Exterior
- Parking: 2 total parking spaces; 2-car garage
- Home design: Single-family home
- Exterior features: Living area approximately 1,691
Interior
- Bedrooms: 3 bedrooms
- Bathrooms: 2 full bathrooms and 1 half bathroom (2.5 total)
- Interior features: Spec-built Emma plan (new construction)
Neighborhood map
What this means for you Summary
Snapshot
- This is a 3-bed/2.5-bath single-family listed at $298k.
Deal economics
- At list price, monthly cash flow is $-251 ($-3k/yr) — negative.
- To cash-flow at today's rent, offer at most $262k (12.2% below list).
- To meet the 1% rule (rent ≥ 1% of price), the offer needs to be $229k (23.2% below list).
- Recommended offer: $229k (23.2% below list) — sets the bar for 1% rule.
- Cap rate 5.3% vs local median 3.9% in Waco — top-decile yield for the area; either an underpriced asset or a hidden risk that comps aren't pricing in. Stress-test before assuming the spread holds.
Location & tenants
- Location reads 74/100 on livability (#166 in TX, #4,378 nationally) — a middle-class / working-renter tenant base. Strengths: cost of living A+, housing A+, health & safety A+; Watch: schools D, crime D, commute F.
- China Spring ISD (rural): math 58% / reading 56% proficiency, ranked #70 of 826 in TX (top 8%) — acceptable for families but not a draw, mixed tenant base, ~2y average lease.
- Market conditions: Rents soft (-0.8%/yr); 376 active listings in the ZIP; 4 comparable units currently listed for rent nearby; rentals at typical pace (median 21d on market — plan ~3-4 weeks tenant-placement turnaround); 1,014 units permitted in McLennan County in 2024 (200 in 5+ unit buildings).
- This rent runs 40% of the median local income ($69k/yr) — at the standard rent-burdened threshold; future hikes will face affordability resistance.
Forward outlook
- Local home prices are declining (-3.0%/yr); year-one equity from $2k of loan paydown is wiped out by about $9k of value loss. Plan a longer hold.
- McLennan County population projected at +17% by 2050 — long-run rental-demand tailwind backs the buy-and-hold thesis.
Negotiation context
- It's been on market 43 days — a 3% lower offer ($290k) is reasonable based on typical stale-listing flexibility.
Risks & watch-outs
- Climate carrying-cost: major wind risk, 61% chance of damaging wind over 30y; major wildfire risk; extreme-heat days projected 7→23/yr by 2055 (HVAC capex compounding) — expect insurance premiums to compound above CPI over the hold.
Questions for the listing agent
- What do current leases actually rent for vs. the listed asking? Can we see a recent rent roll and the last 12 months of T-12 income?
- It's been on market 43 days. Have you received any prior offers? Is the seller open to a 23% concession, seller financing, or rate buy-down credit?
- Is there a deadline driving the sale (1031 exchange, divorce, estate, relocation)? That informs how much negotiation room exists.
- Schools are D-rated, which usually means shorter tenancies and higher turnover. Who's the typical renter profile here, and what's been the actual vacancy rate?
- Crime grade is D in this area — have there been break-ins, vandalism, or insurance claims at this property in the last 3 years? What carrier currently insures it and at what premium?
- The area grade is low — what's the realistic commute time and amenity access for the typical tenant pool here? Any planned neighborhood developments (good or bad) we should know about?
- What's the average days-on-market for RENTAL listings here right now (not sales)? A rising rental-DOM trend means longer vacancies and softer asking-rent achievability than the comps imply.
- What's the recent tenant-quality profile in this submarket — average credit score on applications, eviction rate, late-payment / NSF rate, and stable-employment percentage? A property-management company in the area should have these aggregated.
- How much new for-sale + rental construction is in the pipeline within 1–3 miles? Heavy new supply typically softens prices + rents 12–24 months out; constrained supply supports both.
Investment metrics
- 1% rule
- 0.77% ✗
- Cap rate
- 5.28%
- Cash-on-cash
- -3.61%
- DSCR
- 0.84
- GRM
- 10.8
CMA / ARV
- ARV (median comp)
- $329,275
- List price
- $298,465
- Delta
- -9.36%
- Verdict
- FAIR
- Comps
- 20 within 1.0 mi
Show comp detail 12 sales within ~0.75 mi
| Address | Dist | Beds/Ba | Sqft | Sold | Price | $/sf | Match |
|---|---|---|---|---|---|---|---|
| 5807 Foggy Lagoon Dr | 0.30mi | 3/2.0 | 1,783 (+5%) | 6mo | $322,090 | $181 | 70 |
| 10517 Rayburn Way | 0.24mi | 3/2.0 | 1,851 (+10%) | 5mo | $349,900 | $189 | 66 |
| 10616 Whitney Trce | 0.31mi | 4/3.0 (+1) | 1,795 (+6%) | 4mo | $329,999 | $184 | 64 |
| 10601 T Bury Ln | 0.48mi | 4/2.0 (+1) | 1,683 (-0%) | 7mo | $295,000 | $175 | 64 |
| 5813 Foggy Lagoon Dr | 0.30mi | 4/2.0 (+1) | 1,568 (-7%) | 6mo | $301,065 | $192 | 62 |
| 5613 Foggy Lagoon Dr | 0.31mi | 3/2.0 | 1,508 (-11%) | 5mo | $300,735 | $199 | 61 |
| 11225 Raider Dr | 0.74mi | 3/2.0 | 1,695 (+0%) | 6mo | $265,000 | $156 | 58 |
| 5444 Zavalla Dr | 0.32mi | 3/2.0 | 1,930 (+14%) | 2mo | $399,900 | $207 | 58 |
| 11204 Echo Dr | 0.73mi | 3/2.0 | 1,578 (-7%) | 3mo | $279,900 | $177 | 51 |
| 5409 Black Horse Ct | 0.48mi | 3/2.0 | 1,918 (+13%) | 4mo | $389,990 | $203 | 50 |
| 6513 Elephant Butte Dr | 0.66mi | 3/2.0 | 1,524 (-10%) | 2mo | $274,000 | $180 | 49 |
| 5408 Black Horse Ct | 0.51mi | 4/2.0 (+1) | 1,925 (+14%) | 8mo | $399,900 | $208 | 40 |
Match score weights: distance 35% · size 25% · config 20% · recency 20%. Top-matched comps best support the ARV.
Projected returns pro-forma
-3.0% appreciation · 0.0% rent growth · sell at horizon
- IRR
- -25.7%
- Equity multiple
- 0.15×
- Total profit
- $-71,043
- Equity at exit
- $44,502
- IRR
- -35.8%
- Equity multiple
- -0.30×
- Total profit
- $-108,286
- Equity at exit
- $25,806
Cash invested: $83,570 (down + closing). Projections, not guarantees.
Landlord ↔ Tenant lean methodology
- Overall (STATE)
- 87 Strongly Landlord-Friendly
- State Texas
- 87 Strongly Landlord-Friendly · R+5
- County
- — inherits STATE
- City
- — inherits STATE
ZIP-level market 76708
- Home prices YoY
- -26.5%
- Rents YoY
- -0.8%
- Active inventory
- 376
- Price-to-rent
- 10.8×
Monthly cashflow live
- Estimated rent
- $2,293 medium interval (Pro) →
- Mortgage (P&I)
- −$1,565
- Tax est. 1.5%
- −$373 /mo · $4,477/yr
- Insurance
- −$124
- HOA
- −$0
- Vacancy / Maint / Mgmt
- −$482
- Net cashflow
- $-251
Break-even live
UW: 25.0% down · 7.5% · 30yr · 1.5% tax · 5.0% vac · 8.0% maint · 8.0% mgmt
Financing live
Cash to close
- Down payment
- $74,616
- Closing costs
- $8,954
- Reserves months
- —
- Total cash needed
- —
Loan-product check · same deal, 3 products live
Conventional
25% down · 7.5% · 30yr
- Down + closing
- —
- Monthly P&I
- —
- Monthly cashflow
- —
- DSCR
- —
- Eligible?
- —
Personal DTI + credit; lowest rate.
DSCR
20% down · 8.5% · 30yr
- Down + closing
- —
- Monthly P&I
- —
- Monthly cashflow
- —
- DSCR
- —
- Eligible?
- —
No personal income docs; deal must DSCR.
Hard money
10% down · 12.0% · 12mo
- Down + closing
- —
- Monthly P&I
- —
- Monthly cashflow
- —
- DSCR
- —
- Eligible?
- —
Short-term bridge; refi at stabilization.
Rent comps 4 comps
| Address | Beds | Baths | Sqft | Rent | $/sqft | DOM | Units | Dist |
|---|---|---|---|---|---|---|---|---|
| 10201 Altair Dr Waco, TX | 4.0 | 2.0 | 2032 | $2,600 | $1.28 | 21d | 1 | 0.11mi |
| 5516 Pinery Dr Waco, TX | 3.0 | 2.5 | 2124 | $2,600 | $1.22 | 13d | 1 | 0.62mi |
| 10220 Lilac Waco, TX | 3.0 | 2.0 | 1500 | $1,695 | $1.13 | 43d | 1 | 0.92mi |
| 9900 China Spring Rd Waco, TX | 1.0–2.0 | 1.0–2.0 | 954 | $1,405 | $1.47 | 13d | 1 | 1.34mi |
Listing history 15 events
-
2026-06-18days on market $298,465 Active 43 DOM
-
2026-06-17days on market $298,465 Active 42 DOM
-
2026-06-16days on market $298,465 Active 41 DOM
-
2026-06-15days on market $298,465 Active 40 DOM
-
2026-06-14days on market $298,465 Active 38 DOM
-
2026-06-13days on market $298,465 Active 37 DOM
-
2026-06-10days on market $298,465 Active 35 DOM
-
2026-06-09days on market $298,465 Active 34 DOM
-
2026-06-08days on market $298,465 Active 33 DOM
-
2026-06-07days on market $298,465 Active 32 DOM
-
2026-06-02days on market $298,465 Active 27 DOM
-
2026-06-01days on market $298,465 Active 26 DOM
-
2026-05-31days on market $298,465 Active 25 DOM
-
2026-05-30days on market $298,465 Active 24 DOM
-
2026-05-06$298,465 Active 1077-char remark
ⓘ Source: listings_history table (triggers on properties + properties_extension) + one-shot
backfill from property_details.listing_events for pre-trigger history.
Climate risk First Street
- Flood 1/10 Low FEMA zone X (unshaded) · 0% chance over 30 yrs
- Wildfire 6/10 Major
- Heat 7/10 Severe 7 d/yr ≥109°F today · 23 d/yr by 30 yrs out
- Wind 6/10 Major 61% chance of damaging wind over 30 yrs
- Air quality 2/10 Low 0 unhealthy d/yr today · 1 by 30 yrs out
Nearby sold comps map
Loading sold comps map…
Walkable amenities ~0.75 mi
Loading nearby amenities…
Taxation est. · year 1
- Rental income
- $27,517
- − Mortgage interest
- −$16,719
- − Property taxes
- −$4,477
- − Insurance
- −$1,492
- − Repairs & maintenance
- −$2,201
- − Management
- −$2,201
- − Depreciation
- −$8,683
- Taxable loss
- −$8,257
- Est. tax savings @ 24.0%
- +$1,982
- After-tax cash flow
- $-1,032/yr
For passive investors: Depreciation is non-cash, so a rental often shows a tax loss while cash-flowing — sheltering income. Rental losses are passive: they offset passive income freely, and up to $25,000/yr can offset ordinary (W-2) income if you actively participate and your MAGI is under $100k (phasing out to $0 by $150k); unused losses carry forward. On sale, claimed depreciation is recaptured at up to 25%, and gains may owe capital-gains tax (a 1031 exchange can defer both). Figures are a year-1 estimate at your 24.0% rate — not tax advice; consult a CPA.
Schools (NCES district)
- District
- China Spring ISD
- NCES district ID
- 4813960
- Math proficiency
- 58% ▼ -2.00%
- Reading proficiency
- 56% ▼ -1.00%
- Median HH income
- $71,314
- Composite
- 50.64/100
- National rank
- #1837
- State rank
- #70 of 826 in TX
Livability — Waco
- Score
- 74/100
- State rank
- #166
- US rank
- #4378
Category grades
Schools grade is shown separately in the Schools card above.
Census & demographics
- Census place
- Waco, TX
- County
- McLennan County · 213,088 people
- City population
- 125,319
- Metro
- Waco, TX
- Population (ZIP)
- 27,790
- Household income
- $68,856
- Rent vs Own
- Severe rent burden
- 583.0
Population outlook (McLennan County) Hauer SSP2
- Today (2025)
- 264,191 people
- By 2030
- 273,578 · +3.6%
- By 2040
- 291,506 · +10.3%
- By 2050
- 308,044 · +16.6%
- By 2075
- 349,648 · +32.3%
- By 2100
- 364,779 · +38.1%
Race, ethnicity, and origin ACS 2023
- Neighborhood character
- Diverse neighborhood (Simpson 0.63)
- Race & ethnicity
- White 50% Hispanic / Latino 31% Two or more races 20% Black 13% Asian 2%
- Hispanic origin (detail)
- Mexican 28%
- Common ancestry
- Slovak 2% Lithuanian 1% Italian 1%
- Foreign-born
- 11% · Canada, Vietnam
- Languages at home
- 76% English-only · Spanish 21% Other Asian/Pacific 1%
Political lean MEDSL · McLennan
- 2024 margin
- Solid R (+30.9) · D 34.0% · R 64.9% · Other 1.0%
- 2008→2024 swing
- -7.0pp toward R · 2008: -23.9pp · 2024: -30.9pp
- All cycles
- 2024: R+30.9 2020: R+23.4 2016: R+27.1 2012: R+29.8 2008: R+23.9
Not yet ingested
- Civics
- —
Market trends
- HPI YoY
- ▼ -78.80%
- Current HPI
- 218.9643
- Rent YoY
- ▼ -0.80%
- Metro
- Waco, TX
- State GDP YoY
- ▲ 3.95%
- F500 in state
- 110
Industry mix (Fortune 500 HQ in TX)
| Industry | F500 HQs | Revenue |
|---|---|---|
| Energy | 16 | $1,198B |
|
||
| Technology | 5 | $198B |
|
||
| Engineering / Construction | 4 | $72B |
|
||
| Energy Services | 3 | $60B |
|
||
| Utilities | 3 | $41B |
|
||
| Healthcare | 2 | $330B |
|
||
Cash-flow waterfall
monthlySold comps — $/sqft
last 12 mo · ≤1 miLoading sold comps…