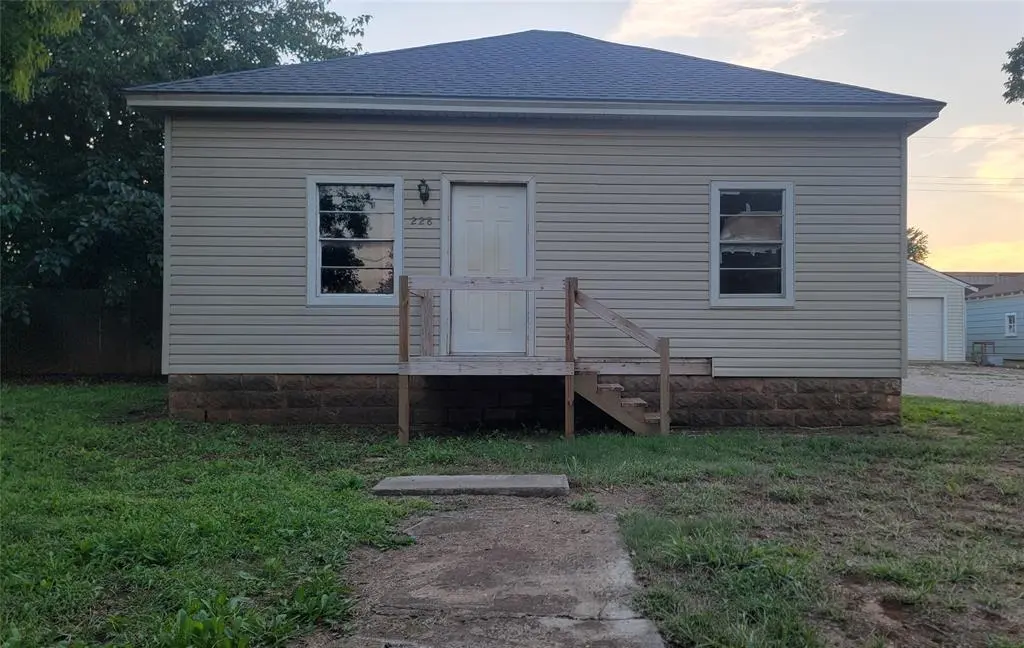
228 S 2nd St · Waukomis, OK
Flood risk 1/10 · Minimal
- FEMA flood zone
- X (unshaded)
- Chance of flooding over 30 yrs
- 0.0%
- Est. flood insurance / yr
- $507 – $1,088
Fire risk 3/10 · Minor
- Est. fire insurance / yr
- $2,463 – $4,575
Heat risk 5/10 · Moderate
- Hot days now (above 109°F)
- 6 days/yr
- Hot days in 30 yrs
- 16 days/yr
Wind risk 2/10 · Minimal
- Chance of severe wind over 30 yrs
- 2.0%
Air-quality risk 2/10 · Minimal
- Unhealthy air days now
- 0 days/yr
- Unhealthy air days in 30 yrs
- 1 days/yr
Risk factors via First Street. Map © Google.
Why this score? — see what drove the B grade
The composite is a weighted blend of 9 inputs, each scored 0–100. Each bar is that input's sub-score; the figure is the points it added to the 100-point composite (weight × sub-score).
- Cash flow +30.0/30.0
- 1% rule +10.0/10.0
- DSCR +10.0/10.0
- ARV discount +7.5/15.0
- Appreciation +6.3/10.0
- Livability +3.4/5.0
- Rent growth +2.5/5.0
- Condition / age +2.5/5.0
- Schools +1.3/10.0
$40,900
🖨 Deal sheet (PDF) 📄 Offer letter ✓ Due diligence
Listing remarks
Attention investors, great opportunity in Garfield, County, single family home built in 1910. Located 7 miles from Vance Air Force Base and Enid, OK. Currently a 2 bedroom home with one bath and 2 living areas. Has a large 2-car detached garage. Being sold as is. Listing agent is related to seller.
Key facts
- 0.28 acre lot
- 2 garage spots
- Built 1910
Property features AI
Finance
- Other: Vacant and available; Living area listed as 1,120 (assessor)
- Financial info: Listing offered as-is; terms include cash and conventional; Not assumable
- HOA & community: No mandatory association dues; Homestead exempt
Exterior
- Parking: 2-car garage
- Utilities: No storm shelter
- Home design: Single-family residence; One-level property; Property faces east; Residential
- Construction: Frame construction; Composition roof (replaced/installed in 2020); Conventional foundation
- Exterior features: Open patio; Wood fencing; Interior lot
Interior
- Bedrooms: 2 bedrooms
- Bathrooms: 1 full bathroom
- Heating & cooling: Floor furnace heating; Window air conditioning units
- Interior features: No fireplace; No in-law plan; Two living areas
Neighborhood map
What this means for you Summary
Snapshot
- This is a 2-bed/1.0-bath single-family listed at $41k.
Deal economics
- At list price, monthly cash flow is $537 ($6k/yr) — positive.
- The deal already cash-flows at list — no discount required.
- Meets the 1% rule at list price ($995 rent vs $41k).
- Recommended offer: $40k (3.0% below list) — sets the bar for market timing.
Location & tenants
- Location reads 68/100 on livability (#70 in OK) — a middle-class / working-renter tenant base. Strengths: cost of living A+, housing A+, crime A; Watch: amenities F, commute F, health & safety F.
- Waukomis (rural): math 12% / reading 16% proficiency, ranked #217 of 270 in OK (top 80%) — low school quality limits family demand, transient renter base, plan for 1-2y turnover.
- Zoned schools: Waukomis Es (math 12% / reading 12%, grade F, #667 of 845 statewide, top 82%, 276 students, 0% FRL); Waukomis Hs (math 30% / reading 50%, grade F, #25 of 447 statewide, top 8%, 109 students, 0% FRL) — zoned schools average 0% FRL vs 41% district-wide (41 pts lower); this property's tenant base skews higher-income than the district average.
- Market conditions: 12 active listings in the ZIP; 19 units permitted in Garfield County in 2024 (0 in 5+ unit buildings).
Forward outlook
- In year one you build about $1k of equity ($283 loan paydown + $1k appreciation (2.5% local appreciation)).
- Garfield County population projected at +27% by 2050 — long-run rental-demand tailwind backs the buy-and-hold thesis.
- At projected returns (2.5% appreciation + 3.0% rent growth), your $11k cash investment doubles in ~2 years — after that, you're playing with house money.
Negotiation context
- It's been on market 49 days — a 3% lower offer ($40k) is reasonable based on typical stale-listing flexibility.
- 2 sale attempts with the ask held roughly flat each time — persistent listings suggest the price (not the market) is what's stuck; bring a comps-based counter.
Risks & watch-outs
- Watch-outs: built in 1910 — expect roof / HVAC / electrical / plumbing capex.
- Climate carrying-cost: extreme-heat days projected 6→16/yr by 2055 (HVAC capex compounding) — expect insurance premiums to compound above CPI over the hold.
Questions for the listing agent
- It's been on market 49 days. Have you received any prior offers? Is the seller open to a 3% concession, seller financing, or rate buy-down credit?
- Built in 1910 — when were the roof, HVAC, electrical panel, plumbing, and water heater last replaced?
- Is there a deadline driving the sale (1031 exchange, divorce, estate, relocation)? That informs how much negotiation room exists.
- Schools are F-rated, which usually means shorter tenancies and higher turnover. Who's the typical renter profile here, and what's been the actual vacancy rate?
- What's the average days-on-market for RENTAL listings here right now (not sales)? A rising rental-DOM trend means longer vacancies and softer asking-rent achievability than the comps imply.
- What's the recent tenant-quality profile in this submarket — average credit score on applications, eviction rate, late-payment / NSF rate, and stable-employment percentage? A property-management company in the area should have these aggregated.
- How much new for-sale + rental construction is in the pipeline within 1–3 miles? Heavy new supply typically softens prices + rents 12–24 months out; constrained supply supports both.
Investment metrics
- 1% rule
- 2.43% ✓
- Cap rate
- 22.04%
- Cash-on-cash
- 56.24%
- DSCR
- 3.50
- GRM
- 3.4
CMA / ARV
- ARV (on-the-fly)
- $124,320
- Comps found
- 6
Show comp detail 6 sales within ~0.75 mi
| Address | Dist | Beds/Ba | Sqft | Sold | Price | $/sf | Match |
|---|---|---|---|---|---|---|---|
| 609 Lisa Ln | 0.62mi | 3/1.5 (+1) | 1,117 (-0%) | 9mo | $143,500 | $128 | 56 |
| 501 Highland Dr | 0.45mi | 3/1.5 (+1) | 1,053 (-6%) | 14mo | $115,000 | $109 | 51 |
| 510 Highland Dr | 0.49mi | 3/1.5 (+1) | 1,065 (-5%) | 14mo | $118,700 | $111 | 51 |
| 608 Amy Dr | 0.69mi | 3/1.0 (+1) | 1,103 (-2%) | 14mo | $90,000 | $82 | 49 |
| 615 W Cherokee St | 0.55mi | 3/2.0 (+1) | 1,066 (-5%) | 18mo | $85,000 | $80 | 42 |
| 605 Highland Dr | 0.49mi | 3/1.5 (+1) | 1,262 (+13%) | 13mo | $140,000 | $111 | 38 |
Match score weights: distance 35% · size 25% · config 20% · recency 20%. Top-matched comps best support the ARV.
Projected returns pro-forma
2.54% appreciation · 3.0% rent growth · sell at horizon
- IRR
- 60.7%
- Equity multiple
- 4.33×
- Total profit
- $38,112
- Equity at exit
- $17,334
- IRR
- 60.6%
- Equity multiple
- 8.77×
- Total profit
- $89,026
- Equity at exit
- $25,920
Cash invested: $11,452 (down + closing). Projections, not guarantees.
Landlord ↔ Tenant lean methodology
- Overall (STATE)
- 83 Strongly Landlord-Friendly
- State Oklahoma
- 83 Strongly Landlord-Friendly · R+20
- County
- — inherits STATE
- City
- — inherits STATE
ZIP-level market 73773
- Home prices YoY
- 1.7%
- Active inventory
- 12
- Price-to-rent
- 3.4×
Monthly cashflow live
- Estimated rent
- $995 medium interval (Pro) →
- Mortgage (P&I)
- −$214
- Tax from tax record
- −$18 /mo · $218/yr
- Insurance
- −$17
- HOA
- −$0
- Vacancy / Maint / Mgmt
- −$209
- Net cashflow
- $537
Break-even live
Sensitivity live
| Price | -10% $560 | -5% $548 | +0% $537 | +5% $525 | +10% $514 |
|---|---|---|---|---|---|
| Rent | -10% $458 | -5% $497 | +0% $537 | +5% $576 | +10% $615 |
| Rate | -1.0pp $557 | -0.5pp $547 | base $537 | +0.5pp $526 | +1.0pp $515 |
UW: 25.0% down · 7.5% · 30yr · 1.5% tax · 5.0% vac · 8.0% maint · 8.0% mgmt
Financing live
Cash to close
- Down payment
- $10,225
- Closing costs
- $1,227
- Reserves months
- —
- Total cash needed
- —
Loan-product check · same deal, 3 products live
Conventional
25% down · 7.5% · 30yr
- Down + closing
- —
- Monthly P&I
- —
- Monthly cashflow
- —
- DSCR
- —
- Eligible?
- —
Personal DTI + credit; lowest rate.
DSCR
20% down · 8.5% · 30yr
- Down + closing
- —
- Monthly P&I
- —
- Monthly cashflow
- —
- DSCR
- —
- Eligible?
- —
No personal income docs; deal must DSCR.
Hard money
10% down · 12.0% · 12mo
- Down + closing
- —
- Monthly P&I
- —
- Monthly cashflow
- —
- DSCR
- —
- Eligible?
- —
Short-term bridge; refi at stabilization.
Listing history 22 events
-
2026-06-19days on market $40,900 Active 49 DOM
-
2026-06-18days on market $40,900 Active 48 DOM
-
2026-06-17days on market $40,900 Active 47 DOM
-
2026-06-16days on market $40,900 Active 46 DOM
-
2026-06-15days on market $40,900 Active 45 DOM
-
2026-06-14days on market $40,900 Active 43 DOM
-
2026-06-12days on market $40,900 Active 42 DOM
-
2026-06-09days on market $40,900 Active 39 DOM
-
2026-06-08days on market $40,900 Active 38 DOM
-
2026-06-07days on market $40,900 Active 37 DOM
-
2026-06-05days on market $40,900 Active 34 DOM
-
2026-06-03days on market $40,900 Active 33 DOM
-
2026-06-02days on market $40,900 Active 32 DOM
-
2026-06-01days on market $40,900 Active 31 DOM
-
2026-05-31days on market $40,900 Active 30 DOM
-
2026-05-30days on market $40,900 Active 29 DOM
-
2026-04-30$40,900 Active
-
2026-04-06historical
-
2026-02-18price $45,900
-
2025-11-06price $49,900
-
2025-09-04price $54,900
-
2025-09-03$58,500 Active
ⓘ Source: listings_history table (triggers on properties + properties_extension) + one-shot
backfill from property_details.listing_events for pre-trigger history.
Tax reassessment forecast OK · Resets to sale price
- Current annual tax
- $218 · $18/mo
- Projected year-2 tax
- $368 · $31/mo
- Expected delta
- +$150/yr (+$13/mo · 68.9%)
ⓘ Screening estimate from a state-policy table — verify with the county assessor before closing.
Climate risk First Street
- Flood 1/10 Low FEMA zone X (unshaded) · 0% chance over 30 yrs
- Wildfire 3/10 Moderate
- Heat 5/10 Major 6 d/yr ≥109°F today · 16 d/yr by 30 yrs out
- Wind 2/10 Low 2% chance of damaging wind over 30 yrs
- Air quality 2/10 Low 0 unhealthy d/yr today · 1 by 30 yrs out
Nearby sold comps map
Loading sold comps map…
Walkable amenities ~0.75 mi
Loading nearby amenities…
Taxation est. · year 1
- Rental income
- $11,945
- − Mortgage interest
- −$2,291
- − Property taxes
- −$218
- − Insurance
- −$204
- − Repairs & maintenance
- −$956
- − Management
- −$956
- − Depreciation
- −$1,190
- Taxable income
- $6,131
- Est. tax owed @ 24.0%
- −$1,471
- After-tax cash flow
- $4,969/yr
For passive investors: Depreciation is non-cash, so a rental often shows a tax loss while cash-flowing — sheltering income. Rental losses are passive: they offset passive income freely, and up to $25,000/yr can offset ordinary (W-2) income if you actively participate and your MAGI is under $100k (phasing out to $0 by $150k); unused losses carry forward. On sale, claimed depreciation is recaptured at up to 25%, and gains may owe capital-gains tax (a 1031 exchange can defer both). Figures are a year-1 estimate at your 24.0% rate — not tax advice; consult a CPA.
Schools (NCES district)
- District
- Waukomis
- NCES district ID
- 4031950
- Math proficiency
- 12% ▼ -33.00%
- Reading proficiency
- 16% ▼ -14.00%
- Median HH income
- $53,601
- Composite
- 13.27/100
- National rank
- #9546
- State rank
- #217 of 270 in OK
Livability — Waukomis
- Score
- 68/100
- State rank
- #70
- US rank
- #9716
Category grades
Schools grade is shown separately in the Schools card above.
Census & demographics
- Census place
- Waukomis, OK
- Population (ZIP)
- 1,537
Population outlook (Garfield County) Hauer SSP2
- Today (2025)
- 69,026 people
- By 2030
- 72,171 · +4.6%
- By 2040
- 79,366 · +15.0%
- By 2050
- 87,847 · +27.3%
- By 2075
- 112,714 · +63.3%
- By 2100
- 135,682 · +96.6%
Race, ethnicity, and origin ACS 2023
- Neighborhood character
- Predominantly White (93%)
- Race & ethnicity
- White 93% Hispanic / Latino 5% Two or more races 5%
- Common ancestry
- Iranian 3% Lithuanian 2% Slovak 2%
- Foreign-born
- 0% · Canada
Political lean MEDSL · Garfield
- 2024 margin
- Solid R (+53.8) · D 22.2% · R 76.0% · Other 1.8%
- 2008→2024 swing
- -2.8pp toward R · 2008: -51.0pp · 2024: -53.8pp
- All cycles
- 2024: R+53.8 2020: R+53.7 2016: R+53.5 2012: R+52.5 2008: R+51.0
Not yet ingested
- Civics
- —
Market trends
- HPI YoY
- ▲ 2.54%
- Current HPI
- 148.0306
- Rent YoY
- —
- Metro
- —
- State GDP YoY
- ▲ 1.55%
- F500 in state
- 6
Industry mix (Fortune 500 HQ in OK)
| Industry | F500 HQs | Revenue |
|---|---|---|
| Energy | 3 | $48B |
|
||
Price history
-30.1% since first listed6 events — show timeline
- 2026-04-30 Listed $40,900 MLSOK
- 2026-04-06 Listing Removed — MLSOK
- 2026-02-18 Price Changed $45,900 MLSOK
- 2025-11-06 Price Changed $49,900 MLSOK
- 2025-09-04 Price Changed $54,900 MLSOK
- 2025-09-03 Listed $58,500 MLSOK
Property tax history
+2.5%/yrLatest (2025): $218 · -1.8% YoY. Source: county tax records.
Cash-flow waterfall
monthlySold comps — $/sqft
last 12 mo · ≤1 miLoading sold comps…