985 Fairledge Ave · Orion, MI
Flood risk 1/10 · Minimal
- FEMA flood zone
- X (unshaded)
- Chance of flooding over 30 yrs
- 0.0%
- Est. flood insurance / yr
- $473 – $860
Fire risk 1/10 · Minimal
- Est. fire insurance / yr
- $784 – $1,456
Heat risk 2/10 · Minimal
- Hot days now (above 96°F)
- 7 days/yr
- Hot days in 30 yrs
- 15 days/yr
Wind risk 2/10 · Minimal
- Chance of severe wind over 30 yrs
- —
Air-quality risk 3/10 · Minor
- Unhealthy air days now
- 2 days/yr
- Unhealthy air days in 30 yrs
- 4 days/yr
Risk factors via First Street. Map © Google.
Why this score? — see what drove the F grade
The composite is a weighted blend of 9 inputs, each scored 0–100. Each bar is that input's sub-score; the figure is the points it added to the 100-point composite (weight × sub-score).
- Cash flow +12.5/30.0
- Schools +5.1/10.0
- DSCR +3.7/10.0
- 1% rule +3.4/10.0
- Rent growth +2.5/5.0
- Livability +2.5/5.0
- Condition / age +2.5/5.0
- ARV discount +2.0/15.0
- Appreciation +0.0/10.0
$349,900
🖨 Deal sheet 📄 Offer letter ✓ Due diligence
Listing remarks MLS
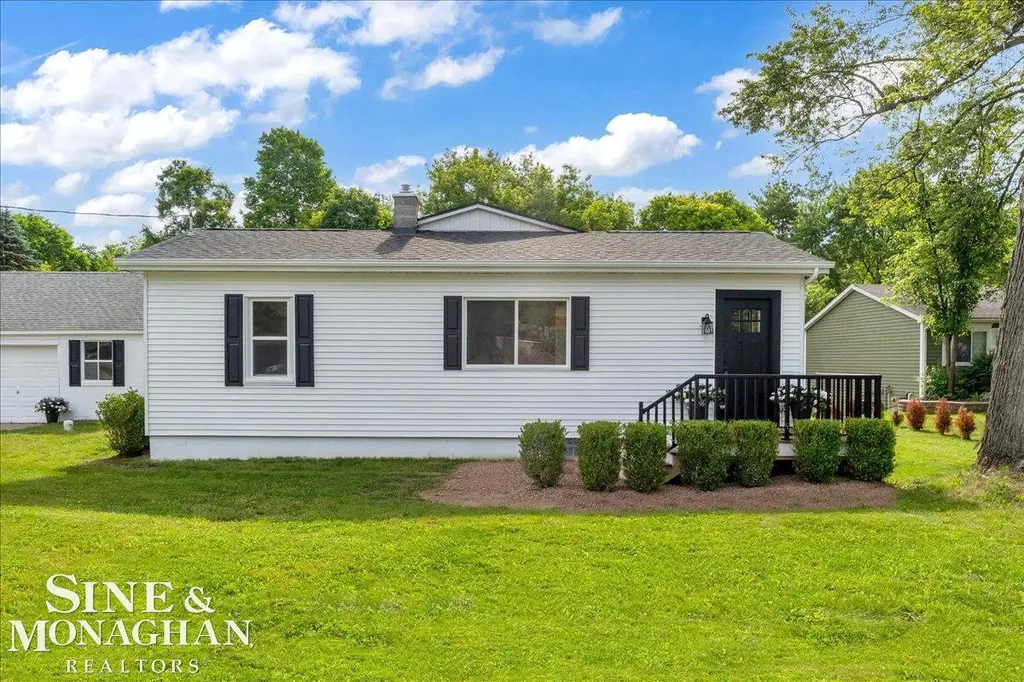
This reimagined and redefined 3-bedroom, 2-bath lake access ranch has been completely renovated to offer the perfect blend of modern comfort and timeless style. Light, airy, and filled with neutral finishes, the home features brand-new stainless steel appliances, a new roof, and a new electrical panel, making it truly move-in ready. Situated on a spacious half-acre lot, with deeded lake access, you'll enjoy all the benefits of the waterfront living just moments from your doorstep. Spend your days boating, swimming, and enjoying the water, then head just five minutes into downtown to explore local shopping, boutiques, and restaurants. Lake life isn't just a destination—it's a way of living. An expansive 20' x 34' garage with loft space provides plenty of room for your boat, water toys, vehicles, or workshop, while the full basement offers exceptional storage. Thoughtfully updated from top to bottom, this completely renovated, reimagined, and redefined ranch delivers the lifestyle, convenience, and quality today's buyers are looking for.
Key facts
- Half-acre lot
- 20 x 34 garage
- New electrical panel
Tags
Property features AI
Finance
- Other: Above-grade finished area approximately 1,382; Below-grade finished area approximately 720
- HOA & community: Homeowners association with an annual fee of $60 (about $5/month)
Exterior
- Parking: Attached 2-car garage
- Utilities: Private well water; Septic tank sewer
- Home design: Single-family residence; One story
- Construction: Vinyl siding
- Exterior features: Lake privileges; 120 x 180 lot dimensions; Lake Orion nearby
Interior
- Bedrooms: Total of 5 rooms (includes bedrooms and living areas)
- Bathrooms: 2 full bathrooms
- Heating & cooling: Central air conditioning; Forced air heating; Natural gas heating
- Interior features: Crawl space basement
Neighborhood map
What this means for you Summary
Snapshot
- This is a 3-bed/1.5-bath single-family listed at $350k.
Deal economics
- At list price, monthly cash flow is $-49 ($-591/yr) — negative.
- To cash-flow at today's rent, offer at most $341k (2.5% below list).
- To meet the 1% rule (rent ≥ 1% of price), the offer needs to be $292k (16.5% below list).
- Recommended offer: $292k (16.5% below list) — sets the bar for 1% rule.
Location & tenants
- Location reads: area grade F — affects rentability + tenant quality, not the cash-flow math above.
- Lake Orion Community Schools (suburban): math 49% / reading 64% proficiency, ranked #45 of 540 in MI (top 8%) — acceptable for families but not a draw, mixed tenant base, ~2y average lease; only 16% free/reduced lunch — higher-income household profile.
- Market conditions: 88 active listings in the ZIP; 3 comparable units currently listed for rent nearby; rentals leasing fast (median 2d on market — plan ~1-2 weeks tenant-placement turnaround); 2,614 units permitted in Oakland County in 2024 (721 in 5+ unit buildings).
Forward outlook
- Local home prices are declining (-3.0%/yr); year-one equity from $2k of loan paydown is wiped out by about $10k of value loss. Plan a longer hold.
- Oakland County population projected at +10% by 2050 — modest demand growth; plan on rents tracking national, not racing it.
Negotiation context
- Only 13 days on market — expect competitive offers; lowballing is unlikely to land.
- 16 sale attempts since 29y ago with the ask held roughly flat each time — persistent listings suggest the price (not the market) is what's stuck; bring a comps-based counter.
- Current owner paid $215k; list at $350k implies a 63% gain — meaningful room to come down on a strong offer.
Risks & watch-outs
- Watch-outs: built in 1950 — expect roof / HVAC / electrical / plumbing capex.
Questions for the listing agent
- What do current leases actually rent for vs. the listed asking? Can we see a recent rent roll and the last 12 months of T-12 income?
- Built in 1950 — when were the roof, HVAC, electrical panel, plumbing, and water heater last replaced?
- What does the HOA fee cover, when was the last increase, and are there any pending special assessments or reserve-fund shortfalls?
- Is there a deadline driving the sale (1031 exchange, divorce, estate, relocation)? That informs how much negotiation room exists.
- The area grade is low — what's the realistic commute time and amenity access for the typical tenant pool here? Any planned neighborhood developments (good or bad) we should know about?
- What's the average days-on-market for RENTAL listings here right now (not sales)? A rising rental-DOM trend means longer vacancies and softer asking-rent achievability than the comps imply.
- What's the recent tenant-quality profile in this submarket — average credit score on applications, eviction rate, late-payment / NSF rate, and stable-employment percentage? A property-management company in the area should have these aggregated.
- How much new for-sale + rental construction is in the pipeline within 1–3 miles? Heavy new supply typically softens prices + rents 12–24 months out; constrained supply supports both.
Investment metrics
- 1% rule
- 0.84% ✗
- Cap rate
- 6.12%
- Cash-on-cash
- -0.60%
- DSCR
- 0.97
- GRM
- 10.0
CMA / ARV
- ARV (on-the-fly)
- $311,904
- Comps found
- 12
Show comp detail 12 sales within ~0.75 mi
| Address | Dist | Beds/Ba | Sqft | Sold | Price | $/sf | Match |
|---|---|---|---|---|---|---|---|
| 985 Fairledge St | 0.00mi | 3/1.5 | 1,382 (+1%) | 5mo | $215,000 | $156 | 94 |
| 816 Vernita Dr | 0.52mi | 3/2.0 | 1,390 (+2%) | 6mo | $320,000 | $230 | 66 |
| 708 Birmingham St | 0.36mi | 4/1.0 (+1) | 1,380 (+1%) | 10mo | $315,000 | $228 | 66 |
| 694 Ferndale Ave | 0.35mi | 3/1.0 | 1,286 (-6%) | 7mo | $258,100 | $201 | 66 |
| 845 Harry Paul Dr | 0.58mi | 3/1.5 | 1,402 (+2%) | 5mo | $250,000 | $178 | 65 |
| 390 Oakland St | 0.46mi | 3/1.0 | 1,416 (+4%) | 13mo | $312,000 | $220 | 60 |
| 654 Alan Dr | 0.59mi | 3/1.5 | 1,448 (+6%) | 5mo | $275,000 | $190 | 59 |
| 561 Bellevue Ave | 0.48mi | 3/2.0 | 1,510 (+10%) | 1mo | $630,000 | $417 | 57 |
| 980 Sherry Dr | 0.37mi | 3/1.5 | 1,200 (-12%) | 7mo | $304,000 | $253 | 56 |
| 567 Bellevue Ave | 0.48mi | 2/2.0 (-1) | 1,504 (+10%) | 0mo | $502,000 | $334 | 54 |
| 561 Bellevue Ave | 0.48mi | 3/2.0 | 1,510 (+10%) | 10mo | $610,000 | $404 | 50 |
| 802 Vernita Dr | 0.52mi | 3/1.0 | 1,471 (+8%) | 15mo | $188,000 | $128 | 49 |
Match score weights: distance 35% · size 25% · config 20% · recency 20%. Top-matched comps best support the ARV.
Projected returns pro-forma
-3.0% appreciation · 3.0% rent growth · sell at horizon
- IRR
- -17.3%
- Equity multiple
- 0.39×
- Total profit
- $-59,829
- Equity at exit
- $52,171
- IRR
- -9.3%
- Equity multiple
- 0.43×
- Total profit
- $-56,108
- Equity at exit
- $30,253
Cash invested: $97,972 (down + closing). Projections, not guarantees.
Landlord ↔ Tenant lean methodology
- Overall (STATE)
- 62 Landlord-Friendly
- State Michigan
- 62 Landlord-Friendly · EVEN
- County
- — inherits STATE
- City
- — inherits STATE
ZIP-level market 48362
- Active inventory
- 88
- Price-to-rent
- 10.0×
Monthly cashflow live
- Estimated rent
- $2,923 medium interval (Pro) →
- Mortgage (P&I)
- −$1,835
- Tax from tax record
- −$373 /mo · $4,473/yr
- Insurance
- −$146
- HOA
- −$5
- Vacancy / Maint / Mgmt
- −$614
- Net cashflow
- $-49
Break-even live
UW: 25.0% down · 7.5% · 30yr · 1.5% tax · 5.0% vac · 8.0% maint · 8.0% mgmt
Financing live
Cash to close
- Down payment
- $87,475
- Closing costs
- $10,497
- Reserves months
- —
- Total cash needed
- —
Loan-product check · same deal, 3 products live
Conventional
25% down · 7.5% · 30yr
- Down + closing
- —
- Monthly P&I
- —
- Monthly cashflow
- —
- DSCR
- —
- Eligible?
- —
Personal DTI + credit; lowest rate.
DSCR
20% down · 8.5% · 30yr
- Down + closing
- —
- Monthly P&I
- —
- Monthly cashflow
- —
- DSCR
- —
- Eligible?
- —
No personal income docs; deal must DSCR.
Hard money
10% down · 12.0% · 12mo
- Down + closing
- —
- Monthly P&I
- —
- Monthly cashflow
- —
- DSCR
- —
- Eligible?
- —
Short-term bridge; refi at stabilization.
Rent comps 3 comps
| Address | Beds | Baths | Sqft | Rent | $/sqft | DOM | Units | Dist |
|---|---|---|---|---|---|---|---|---|
| 711 Kimberly Lake Orion, MI | 1.0–2.0 | 1.0–1.5 | 985 | $1,149 | $1.17 | 1d | 6 | 0.79mi |
| 442 Mystic Cove Ln Lake Orion, MI | 2.0–4.0 | 2.0–3.0 | 1989 | $5,350 | $2.69 | 1d | 4 | 1.04mi |
| 120 S Broadway St Lake Orion, MI | 2.0 | 2.0 | 1065 | $2,950 | $2.77 | 14d | 1 | 1.33mi |
HOA detail
- Monthly dues
- $5 · $60/yr
- Likely covers
- waterelectric
Listing history 9 events
-
2026-06-18days on market $349,900 Active 13 DOM
-
2026-06-17days on market $349,900 Active 12 DOM
-
2026-06-16days on market $349,900 Active 11 DOM
-
2026-06-15days on market $349,900 Active 10 DOM
-
2026-06-13days on market $349,900 Active 8 DOM
-
2026-06-09days on market $349,900 Active 4 DOM
-
2026-06-08days on market $349,900 Active 3 DOM
-
2026-06-07remarks 699-char remark
-
2026-06-07$349,900 Active 2 DOM
ⓘ Source: listings_history table (triggers on properties + properties_extension) + one-shot
backfill from property_details.listing_events for pre-trigger history.
Tax reassessment forecast MI · Partial reset (capped growth)
- Current annual tax
- $4,473 · $373/mo
- Projected year-2 tax
- $4,931 · $411/mo
- Expected delta
- +$458/yr (+$38/mo · 10.2%)
ⓘ Screening estimate from a state-policy table — verify with the county assessor before closing.
Climate risk First Street
- Flood 1/10 Low FEMA zone X (unshaded) · 0% chance over 30 yrs
- Wildfire 1/10 Low
- Heat 2/10 Low 7 d/yr ≥96°F today · 15 d/yr by 30 yrs out
- Wind 2/10 Low
- Air quality 3/10 Moderate 2 unhealthy d/yr today · 4 by 30 yrs out
Nearby sold comps map
Loading sold comps map…
Walkable amenities ~0.75 mi
Loading nearby amenities…
Taxation est. · year 1
- Rental income
- $35,076
- − Mortgage interest
- −$19,600
- − Property taxes
- −$4,473
- − Insurance
- −$1,750
- − Repairs & maintenance
- −$2,806
- − Management
- −$2,806
- − HOA
- −$60
- − Depreciation
- −$10,179
- Taxable loss
- −$6,597
- Est. tax savings @ 24.0%
- +$1,583
- After-tax cash flow
- $992/yr
For passive investors: Depreciation is non-cash, so a rental often shows a tax loss while cash-flowing — sheltering income. Rental losses are passive: they offset passive income freely, and up to $25,000/yr can offset ordinary (W-2) income if you actively participate and your MAGI is under $100k (phasing out to $0 by $150k); unused losses carry forward. On sale, claimed depreciation is recaptured at up to 25%, and gains may owe capital-gains tax (a 1031 exchange can defer both). Figures are a year-1 estimate at your 24.0% rate — not tax advice; consult a CPA.
Schools (NCES district)
- District
- Lake Orion Community Schools
- NCES district ID
- 2620730
- Math proficiency
- 49% ▼ -10.00%
- Reading proficiency
- 64% ▼ -10.00%
- Median HH income
- $82,396
- Composite
- 51.21/100
- National rank
- #1755
- State rank
- #45 of 540 in MI
Livability — Orion
No livability data for this city. (Only ~50 U.S. cities are tracked.)
Census & demographics
- City population
- 10,401
- Population (ZIP)
- 14,746
Population outlook (Oakland County) Hauer SSP2
- Today (2025)
- 1,335,747 people
- By 2030
- 1,375,100 · +2.9%
- By 2040
- 1,435,385 · +7.5%
- By 2050
- 1,469,250 · +10.0%
- By 2075
- 1,531,946 · +14.7%
- By 2100
- 1,450,485 · +8.6%
Race, ethnicity, and origin ACS 2023
- Neighborhood character
- Predominantly White (88%)
- Race & ethnicity
- White 88% Two or more races 5% Hispanic / Latino 4% Black 2% Asian 2%
- Common ancestry
- Romanian 11% Lithuanian 5% Slovak 3%
- Foreign-born
- 6% · Canada, China, Dominican Republic
- Languages at home
- 95% English-only · Spanish 1% Chinese 1% German/W. Germanic 1%
Political lean MEDSL · Oakland
- 2024 margin
- D (+10.6) · D 54.4% · R 43.8% · Other 1.9%
- 2008→2024 swing
- -3.9pp toward R · 2008: 14.5pp · 2024: 10.6pp
- All cycles
- 2024: D+10.6 2020: D+14.1 2016: D+8.1 2012: D+8.1 2008: D+14.5
Not yet ingested
- Civics
- —
Market trends
- HPI YoY
- ▼ -307.96%
- Current HPI
- 182.3653
- Rent YoY
- —
- Metro
- —
- State GDP YoY
- ▲ 1.37%
- F500 in state
- 28
Industry mix (Fortune 500 HQ in MI)
| Industry | F500 HQs | Revenue |
|---|---|---|
| Automotive Parts | 3 | $48B |
|
||
| Automotive | 2 | $372B |
|
||
| Chemicals | 1 | $45B |
|
||
| Automotive Retail | 1 | $29B |
|
||
| Healthcare / Medical Devices | 1 | $23B |
|
||
| Automotive Technology | 1 | $20B |
|
||
Price history
+337.9% since first listed38 events — show timeline
- 2026-06-05 Listed $349,900 MiRealSource-MiMLS
- 2026-06-05 Listed $349,900 REALCOMP
- 2026-01-09 Sold (MLS) $215,000 MiRealSource-MiMLS
- 2026-01-09 Sold (MLS) $215,000 REALCOMP
- 2025-12-09 Pending — MiRealSource-MiMLS
- 2025-12-09 Pending — REALCOMP
- 2025-12-04 Relisted — MiRealSource-MiMLS
- 2025-12-04 Relisted — REALCOMP
- 2025-11-30 Pending — MiRealSource-MiMLS
- 2025-11-30 Pending — REALCOMP
- 2025-11-26 Relisted — MiRealSource-MiMLS
- 2025-11-26 Relisted — REALCOMP
- 2025-11-05 Pending — MiRealSource-MiMLS
- 2025-11-05 Pending — REALCOMP
- 2025-10-24 Listed $218,000 MiRealSource-MiMLS
- 2025-10-24 Listed $218,000 REALCOMP
- 2022-09-22 Sold (Public Records) $199,900 Public Records
- 2022-08-29 Sold (MLS) $199,900 MiRealSource-MiMLS
- 2022-08-29 Sold (MLS) $199,900 REALCOMP
- 2022-08-26 Pending — REALCOMP
- 2022-08-26 Listing Removed — MiRealSource-MiMLS
- 2022-08-26 Listed $199,900 MiRealSource-MiMLS
- 2022-08-26 Listed $199,900 REALCOMP
- 2011-05-31 Sold (MLS) $41,000 MiRealSource-MiMLS
- 2011-05-31 Sold (MLS) $41,000 REALCOMP
- 2011-05-30 Listing Removed — MiRealSource-MiMLS
- 2011-05-30 Listed $45,900 MiRealSource-MiMLS
- 2011-05-30 Listed $45,900 REALCOMP
- 2011-05-29 Listing Removed — REALCOMP
- 2011-05-29 Listing Removed — MiRealSource-MiMLS
- 2011-02-28 Listed $45,900 REALCOMP
- 2011-02-28 Listed $45,900 MiRealSource-MiMLS
- 1998-07-29 Sold (Public Records) $121,500 Public Records
- 1998-07-02 Sold (MLS) $121,500 REALCOMP
- 1998-02-25 Listed $124,900 REALCOMP
- 1997-06-11 Sold (Public Records) $79,900 Public Records
- 1997-04-28 Sold (MLS) $79,900 REALCOMP
- 1997-03-24 Listed $79,900 REALCOMP
Property tax history
+6.5%/yrLatest (2025): $4,473 · +1.9% YoY. Source: county tax records.
Cash-flow waterfall
monthlySold comps — $/sqft
last 12 mo · ≤1 miLoading sold comps…