 🏷️ Likely Rental
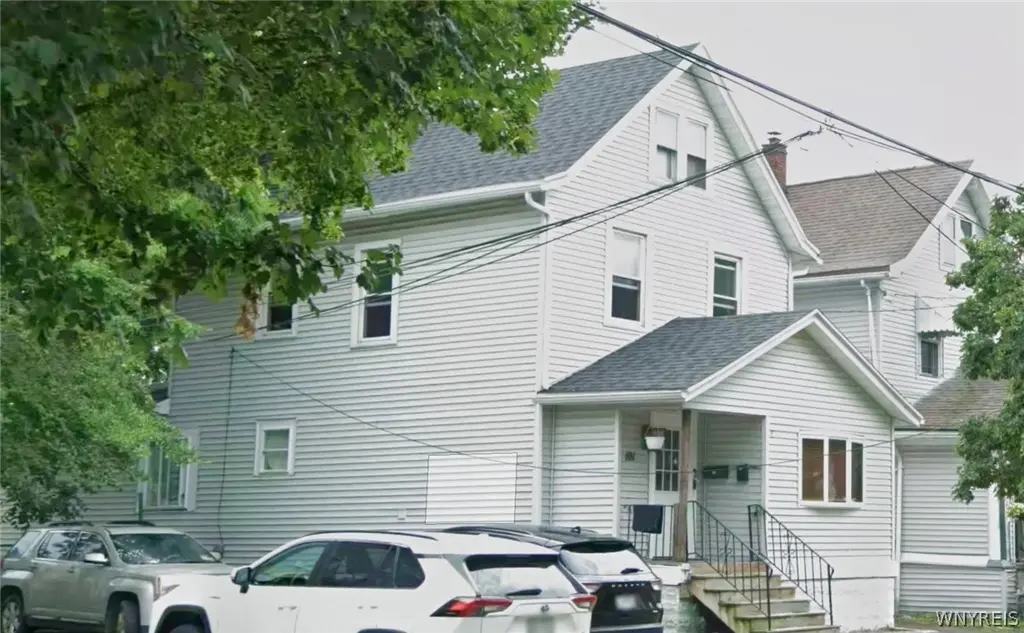
101 Wiley Pl · Buffalo, NY
Flood risk 3/10 · Minor
- FEMA flood zone
- X (unshaded)
- Chance of flooding over 30 yrs
- 0.1%
- Est. flood insurance / yr
- $473 – $860
Fire risk 1/10 · Minimal
- Est. fire insurance / yr
- $691 – $1,283
Heat risk 3/10 · Minor
- Hot days now (above 93°F)
- 7 days/yr
- Hot days in 30 yrs
- 15 days/yr
Wind risk 1/10 · Minimal
- Chance of severe wind over 30 yrs
- —
Air-quality risk 3/10 · Minor
- Unhealthy air days now
- 3 days/yr
- Unhealthy air days in 30 yrs
- 4 days/yr
Risk factors via First Street. Map © Google.
Why this score? — see what drove the B+ grade
The composite is a weighted blend of 9 inputs, each scored 0–100. Each bar is that input's sub-score; the figure is the points it added to the 100-point composite (weight × sub-score).
- Cash flow +30.0/30.0
- ARV discount +15.0/15.0
- 1% rule +10.0/10.0
- DSCR +10.0/10.0
- Rent growth +4.5/5.0
- Livability +3.9/5.0
- Schools +3.3/10.0
- Condition / age +2.5/5.0
- Appreciation +0.0/10.0
$164,000
🖨 Deal sheet (PDF) 📄 Offer letter ✓ Due diligence
Multi-family units
County records classify this as Multi-Family (2-4 Unit). Listing-text estimate: 2 units. confirmed
Listing remarks
Turnkey Cash-Flow Duplex – 101 Wiley Pl, Buffalo, NY 14207!Fully rented and ready to own — This 4-bed, 2-bath 2/2 duplex is currently generating $2,100 per month in stable rental income with tenants in place. Offering 1,556 sq ft on a 3,360 sq ft lot in the Riverside/Black Rock neighborhood (ZIP 14207), this 1927-built multi-family home delivers immediate returns in a high-demand rental market. Solid fundamentals make it low-maintenance and investor-friendly. Perfect for hands-off investors looking for reliable cash flow, portfolio growth, or a BRRRR opportunity with minimal work needed. Live in one unit and rent the other, or keep both rented for strong monthly income. Proven i
Key facts
- Cash flow duplex
- Investor friendly
- Stable rental income
Tags
Property features AI
Finance
- Financial info: Property is a two-unit multifamily building; Each unit has separate gas and electric meters; Owner pays water; water included in rent; Operating expenses include water/sewer; Current rents: approximately $1,125 for the 1-bedroom unit and $975 for the 2-bedroom unit
Exterior
- Parking: Detached garage with 1 vehicle space; Concrete parking surfaces
- Utilities: Public water connected; Sewer connected
- Home design: Two-story building; Resale property; Vinyl siding exterior
- Construction: Vinyl siding construction
- Exterior features: Rectangular residential lot; City street frontage; Lot dimensions approximately 30 x 112
Interior
- Kitchen: Eat-in kitchen (in 1-bedroom unit); Dining area with living room (in 2-bedroom unit)
- Bedrooms: One 1-bedroom unit; One 2-bedroom unit
- Flooring: Vinyl flooring; Varied flooring throughout
- Bathrooms: Two full bathrooms (one in each unit)
- Heating & cooling: Gas forced-air heating
- Interior features: Full basement
- Laundry & utility: Gas water heater
Neighborhood map
What this means for you Summary
Snapshot
- This is a 2 × 3-bed/2.0-bath units multifamily listed at $164k.
Deal economics
- At list price, monthly cash flow is $1k ($17k/yr) — positive. Per door: $726/mo.
- The deal already cash-flows at list — no discount required.
- Meets the 1% rule at list price ($3k rent vs $164k).
- Recommended offer: $159k (3.0% below list) — sets the bar for market timing.
- Cap rate 16.9% vs local median 8.0% in Buffalo — top-decile yield for the area; either an underpriced asset or a hidden risk that comps aren't pricing in. Stress-test before assuming the spread holds.
Location & tenants
- Location reads 77/100 on livability (#195 in NY, #3,011 nationally) — a middle-class / working-renter tenant base. Strengths: commute A+, housing A+, health & safety A+; Watch: crime F, employment D-.
- Buffalo City School District (urban): math 41% / reading 40% proficiency, ranked #535 of 590 in NY (top 91%) — families likely to look elsewhere, expect single-tenant / working-renter base with shorter leases; 75% free/reduced lunch — lower-income household profile, screen leases tightly.
- Market conditions: Rents rising fast (+8.2%/yr); 199 active listings in the ZIP; 9 comparable units currently listed for rent nearby; rentals leasing fast (median 4d on market — plan ~1-2 weeks tenant-placement turnaround); lower-income renter base — watch delinquency; 1,244 units permitted in Erie County in 2024 (563 in 5+ unit buildings).
- At $3,059/mo this rent would consume 92% of the median local household income ($40k/yr) (locally 2177% of renters already pay >50% of income on rent) — very limited rent-growth headroom before tenants either downsize or default.
Forward outlook
- Local home prices are declining (-3.0%/yr); year-one equity from $1k of loan paydown is wiped out by about $5k of value loss. Plan a longer hold.
- At projected returns (-3.0% appreciation + 8.0% rent growth), your $46k cash investment doubles in ~3 years — after that, you're playing with house money.
Negotiation context
- It's been on market 36 days — a 3% lower offer ($159k) is reasonable based on typical stale-listing flexibility.
Risks & watch-outs
- Watch-outs: built in 1927 — expect roof / HVAC / electrical / plumbing capex.
Questions for the listing agent
- It's been on market 36 days. Have you received any prior offers? Is the seller open to a 3% concession, seller financing, or rate buy-down credit?
- Can we see the unit-by-unit rent roll, current vacancy, and any below-market leases? What's the average tenancy length?
- What capital expenditures (roof, boiler, parking lot, exteriors) have been made in the last 5 years, and what's planned in the next 2?
- Built in 1927 — when were the roof, HVAC, electrical panel, plumbing, and water heater last replaced?
- Is there a deadline driving the sale (1031 exchange, divorce, estate, relocation)? That informs how much negotiation room exists.
- Crime grade is F in this area — have there been break-ins, vandalism, or insurance claims at this property in the last 3 years? What carrier currently insures it and at what premium?
- What's the average days-on-market for RENTAL listings here right now (not sales)? A rising rental-DOM trend means longer vacancies and softer asking-rent achievability than the comps imply.
- What's the recent tenant-quality profile in this submarket — average credit score on applications, eviction rate, late-payment / NSF rate, and stable-employment percentage? A property-management company in the area should have these aggregated.
- How much new apartment / multifamily construction is in the pipeline within 1–3 miles? Heavy new supply (>2% of stock underway) typically softens rents 12–24 months out; light construction supports rent growth.
Investment metrics
- 1% rule
- 1.87% ✓
- Cap rate
- 16.92%
- Cash-on-cash
- 37.94%
- DSCR
- 2.69
- GRM
- 4.5
CMA / ARV
- ARV (on-the-fly)
- $206,948
- Comps found
- 12
Show comp detail 12 sales within ~0.75 mi
| Address | Dist | Beds/Ba | Sqft | Sold | Price | $/sf | Match |
|---|---|---|---|---|---|---|---|
| 15 Blum Ave | 0.46mi | 4/2.0 | 1,600 (+3%) | 1mo | $212,000 | $133 | 74 |
| 315 Roesch Ave | 0.28mi | 3/2.0 (-1) | 1,498 (-4%) | 6mo | $167,000 | $111 | 71 |
| 23 Wyandotte Ave | 0.39mi | 4/2.0 | 1,496 (-4%) | 6mo | $150,000 | $100 | 70 |
| 77 Eckhert St | 0.58mi | 4/2.0 | 1,584 (+2%) | 6mo | $211,000 | $133 | 65 |
| 365 Washington Ave | 0.58mi | 4/2.0 | 1,536 (-1%) | 10mo | $249,000 | $162 | 62 |
| 170 Mayville Ave | 0.69mi | 4/2.0 | 1,612 (+4%) | 3mo | $199,000 | $123 | 59 |
| 345 Westgate Rd | 0.57mi | 3/2.0 (-1) | 1,538 (-1%) | 9mo | $217,000 | $141 | 59 |
| 151 Crowley Ave | 0.74mi | 4/2.0 | 1,565 (+1%) | 10mo | $89,000 | $57 | 56 |
| 108 Eckhert St | 0.63mi | 5/2.0 (+1) | 1,629 (+5%) | 6mo | $230,000 | $141 | 53 |
| 87 Laird Ave | 0.58mi | 4/2.0 | 1,419 (-9%) | 7mo | $150,000 | $106 | 53 |
| 175 Mayville Ave | 0.70mi | 4/2.0 | 1,674 (+8%) | 5mo | $225,000 | $134 | 50 |
| 379 Victoria Blvd | 0.51mi | 4/2.0 | 1,764 (+13%) | 6mo | $285,606 | $162 | 49 |
Match score weights: distance 35% · size 25% · config 20% · recency 20%. Top-matched comps best support the ARV.
Projected returns pro-forma
-3.0% appreciation · 8.0% rent growth · sell at horizon
- IRR
- 39.2%
- Equity multiple
- 2.79×
- Total profit
- $82,000
- Equity at exit
- $24,453
- IRR
- 47.9%
- Equity multiple
- 6.75×
- Total profit
- $263,816
- Equity at exit
- $14,180
Cash invested: $45,920 (down + closing). Projections, not guarantees.
Landlord ↔ Tenant lean methodology
- Overall (STATE)
- 15 Strongly Tenant-Friendly
- State New York
- 15 Strongly Tenant-Friendly · D+10
- County
- — inherits STATE
- City
- — inherits STATE
ZIP-level market 14207
- Home prices YoY
- -18.9%
- Rents YoY
- 8.2%
- Active inventory
- 199
- Price-to-rent
- 8.9×
Monthly cashflow live
- Estimated rent
- $3,059 high interval (Pro) →
- Mortgage (P&I)
- −$860
- Tax from tax record
- −$36 /mo · $437/yr
- Insurance
- −$68
- HOA
- −$0
- Vacancy / Maint / Mgmt
- −$642
- Net cashflow
- $1,452
Break-even live
Sensitivity live
| Price | -10% $1,545 | -5% $1,498 | +0% $1,452 | +5% $1,405 | +10% $1,359 |
|---|---|---|---|---|---|
| Rent | -10% $1,210 | -5% $1,331 | +0% $1,452 | +5% $1,573 | +10% $1,693 |
| Rate | -1.0pp $1,534 | -0.5pp $1,494 | base $1,452 | +0.5pp $1,409 | +1.0pp $1,366 |
2-unit breakdown (identical units grouped — click to expand)
| Units | Beds | Baths | Est. rent |
|---|---|---|---|
| 2× units | 3 | 2 | $3,060 |
| #1 | 3 | 2 | $1,530 |
| #2 | 3 | 2 | $1,530 |
| Total (2 units) | $3,059 | ||
UW: 25.0% down · 7.5% · 30yr · 1.5% tax · 5.0% vac · 8.0% maint · 8.0% mgmt
Financing live
Cash to close
- Down payment
- $41,000
- Closing costs
- $4,920
- Reserves months
- —
- Total cash needed
- —
Loan-product check · same deal, 3 products live
Conventional
25% down · 7.5% · 30yr
- Down + closing
- —
- Monthly P&I
- —
- Monthly cashflow
- —
- DSCR
- —
- Eligible?
- —
Personal DTI + credit; lowest rate.
DSCR
20% down · 8.5% · 30yr
- Down + closing
- —
- Monthly P&I
- —
- Monthly cashflow
- —
- DSCR
- —
- Eligible?
- —
No personal income docs; deal must DSCR.
Hard money
10% down · 12.0% · 12mo
- Down + closing
- —
- Monthly P&I
- —
- Monthly cashflow
- —
- DSCR
- —
- Eligible?
- —
Short-term bridge; refi at stabilization.
Rent comps 9 comps
| Address | Beds | Baths | Sqft | Rent | $/sqft | DOM | Units | Dist |
|---|---|---|---|---|---|---|---|---|
| 62 Seabrook St Buffalo, NY | 4.0 | 1.0 | 1300 | $2,000 | $1.54 | 2d | 1 | 0.21mi |
| 158 Chadduck Ave Buffalo, NY | 4.0 | 1.0 | 1200 | $1,250 | $1.04 | 24d | 1 | 0.64mi |
| 61 Baxter St Buffalo, NY | 3.0 | 1.0 | 2014 | $1,400 | $0.70 | 2d | 1 | 0.70mi |
| 172 Tremont Ave Kenmore, NY | 3.0 | 1.5 | 1569 | $2,500 | $1.59 | 11d | 1 | 0.90mi |
| 237 W Girard Blvd Buffalo, NY | 4.0 | 1.5 | 1329 | $4,000 | $3.01 | 24d | 1 | 0.94mi |
| 118 Rano St Buffalo, NY | 3.0 | 1.0 | 1050 | $1,200 | $1.14 | 22d | 1 | 0.96mi |
| 2522 Delaware Ave Buffalo, NY | 3.0 | 1.0 | 1150 | $1,625 | $1.41 | 2d | 1 | 1.40mi |
| 2514 Delaware Ave Unit 1 Buffalo, NY | 3.0 | 1.0 | 1620 | $1,650 | $1.02 | 2d | 1 | 1.41mi |
| 244 Hartwell Rd Buffalo, NY | 3.0 | 1.0 | 1250 | $1,500 | $1.20 | 4d | 1 | 1.48mi |
Listing history 20 events
-
2026-06-21days on market $164,000 Active 36 DOM
-
2026-06-18days on market $164,000 Active 33 DOM
-
2026-06-17days on market $164,000 Active 32 DOM
-
2026-06-16days on market $164,000 Active 31 DOM
-
2026-06-15days on market $164,000 Active 30 DOM
-
2026-06-13days on market $164,000 Active 28 DOM
-
2026-06-13days on market $164,000 Active 27 DOM
-
2026-06-10pricedays on market $164,000 Active 25 DOM
-
2026-06-09days on market $169,000 Active 24 DOM
-
2026-06-08days on market $169,000 Active 23 DOM
-
2026-06-07days on market $169,000 Active 22 DOM
-
2026-06-03days on market $169,000 Active 18 DOM
-
2026-06-02days on market $169,000 Active 17 DOM
-
2026-06-01days on market $169,000 Active 16 DOM
-
2026-05-31days on market $169,000 Active 15 DOM
-
2026-05-15$175,000 Active
-
2021-12-13soldstatus $1,980,000
-
2008-05-12soldstatus $60,000
-
2005-01-07soldstatus $36,000
-
1993-03-15soldstatus $40,000
ⓘ Source: listings_history table (triggers on properties + properties_extension) + one-shot
backfill from property_details.listing_events for pre-trigger history.
Tax reassessment forecast NY · Partial reset (capped growth)
- Current annual tax
- $437 · $36/mo
- Projected year-2 tax
- $1,604 · $134/mo
- Expected delta
- +$1,167/yr (+$97/mo · 267.0%)
ⓘ Screening estimate from a state-policy table — verify with the county assessor before closing.
Climate risk First Street
- Flood 3/10 Moderate FEMA zone X (unshaded) · 10% chance over 30 yrs
- Wildfire 1/10 Low
- Heat 3/10 Moderate 7 d/yr ≥93°F today · 15 d/yr by 30 yrs out
- Wind 1/10 Low
- Air quality 3/10 Moderate 3 unhealthy d/yr today · 4 by 30 yrs out
Nearby sold comps map
Loading sold comps map…
Walkable amenities ~0.75 mi
Loading nearby amenities…
Taxation est. · year 1
- Rental income
- $36,708
- − Mortgage interest
- −$9,187
- − Property taxes
- −$437
- − Insurance
- −$820
- − Repairs & maintenance
- −$2,937
- − Management
- −$2,937
- − Depreciation
- −$4,771
- Taxable income
- $15,620
- Est. tax owed @ 24.0%
- −$3,749
- After-tax cash flow
- $13,673/yr
For passive investors: Depreciation is non-cash, so a rental often shows a tax loss while cash-flowing — sheltering income. Rental losses are passive: they offset passive income freely, and up to $25,000/yr can offset ordinary (W-2) income if you actively participate and your MAGI is under $100k (phasing out to $0 by $150k); unused losses carry forward. On sale, claimed depreciation is recaptured at up to 25%, and gains may owe capital-gains tax (a 1031 exchange can defer both). Figures are a year-1 estimate at your 24.0% rate — not tax advice; consult a CPA.
Schools (NCES district)
- District
- Buffalo City School District
- NCES district ID
- 3605850
- Math proficiency
- 41% ▲ 11.00%
- Reading proficiency
- 40% ▲ 7.00%
- Median HH income
- $31,665
- Composite
- 33.17/100
- National rank
- #5544
- State rank
- #535 of 590 in NY
Livability — Buffalo
- Score
- 77/100
- State rank
- #195
- US rank
- #3011
Category grades
Schools grade is shown separately in the Schools card above.
Census & demographics
- Census place
- Buffalo, NY
- County
- Erie County · 714,559 people
- City population
- 440,021
- Metro
- Buffalo-Cheektowaga, NY
- Population (ZIP)
- 26,327
- Household income
- $39,753
- Rent vs Own
- Severe rent burden
- 2177.0
Population outlook (Erie County) Hauer SSP2
- Today (2025)
- 933,037 people
- By 2030
- 935,181 · +0.2%
- By 2040
- 928,531 · -0.5%
- By 2050
- 905,725 · -2.9%
- By 2075
- 834,037 · -10.6%
- By 2100
- 708,033 · -24.1%
Race, ethnicity, and origin ACS 2023
- Neighborhood character
- Highly diverse neighborhood (Simpson 0.74)
- Race & ethnicity
- White 40% Hispanic / Latino 23% Black 16% Asian 15% Two or more races 14%
- Hispanic origin (detail)
- Puerto Rican 18% Dominican 2%
- Common ancestry
- Romanian 8% Portuguese 1% Arab 1%
- Foreign-born
- 19% · Philippines, Canada, India
- Languages at home
- 65% English-only · Spanish 14% Other Asian/Pacific 10% Other Indo-European 5%
Political lean MEDSL · Erie
- 2024 margin
- Lean D (+9.7) · D 54.8% · R 45.2%
- 2008→2024 swing
- -7.9pp toward R · 2008: 17.5pp · 2024: 9.7pp
- All cycles
- 2024: D+9.7 2020: D+14.7 2016: D+4.8 2012: D+15.6 2008: D+17.5
Not yet ingested
- Civics
- —
Market trends
- HPI YoY
- ▼ -54.42%
- Current HPI
- 233.0902
- Rent YoY
- ▲ 8.19%
- Metro
- Buffalo-Cheektowaga, NY
- State GDP YoY
- ▲ 2.60%
- F500 in state
- 92
Industry mix (Fortune 500 HQ in NY)
| Industry | F500 HQs | Revenue |
|---|---|---|
| Financial Services | 10 | $950B |
|
||
| Consumer Goods | 9 | $162B |
|
||
| Insurance | 4 | $225B |
|
||
| Telecommunications | 2 | $144B |
|
||
| Pharmaceuticals | 2 | $112B |
|
||
| Media / Entertainment | 2 | $69B |
|
||
Price history
+337.5% since first listed5 events — show timeline
- 2026-05-15 Listed $175,000 WNYREIS
- 2021-12-13 Sold (Public Records) $1,980,000 Public Records
- 2008-05-12 Sold (Public Records) $60,000 Public Records
- 2005-01-07 Sold (Public Records) $36,000 Public Records
- 1993-03-15 Sold (Public Records) $40,000 Public Records
Property tax history
+3.2%/yrLatest (2025): $437 · +0.0% YoY. Source: county tax records.
Cash-flow waterfall
monthlySold comps — $/sqft
last 12 mo · ≤1 miLoading sold comps…