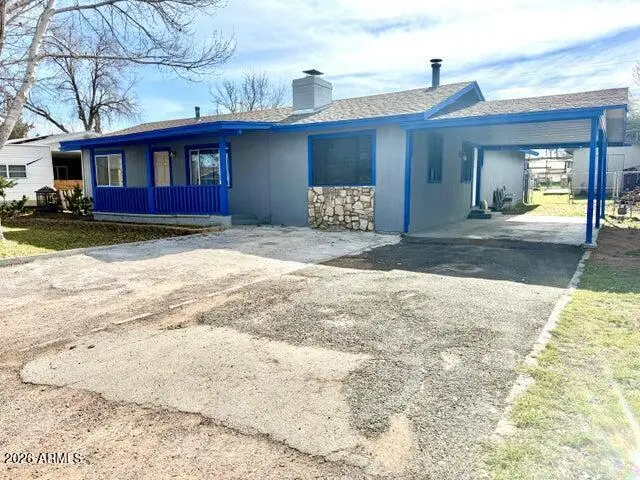
207 E Aero Dr · Payson, AZ
Flood risk 1/10 · Minimal
- FEMA flood zone
- X (unshaded)
- Chance of flooding over 30 yrs
- 0.0%
- Est. flood insurance / yr
- $507 – $1,088
Fire risk 8/10 · Major
- Est. fire insurance / yr
- $610 – $1,132
Heat risk 4/10 · Minor
- Hot days now (above 96°F)
- 7 days/yr
- Hot days in 30 yrs
- 20 days/yr
Wind risk 1/10 · Minimal
- Chance of severe wind over 30 yrs
- —
Air-quality risk 1/10 · Minimal
- Unhealthy air days now
- 0 days/yr
- Unhealthy air days in 30 yrs
- 0 days/yr
Risk factors via First Street. Map © Google.
Why this score? — see what drove the D grade
The composite is a weighted blend of 9 inputs, each scored 0–100. Each bar is that input's sub-score; the figure is the points it added to the 100-point composite (weight × sub-score).
- ARV discount +15.0/15.0
- Cash flow +12.1/30.0
- DSCR +3.6/10.0
- Livability +3.5/5.0
- Rent growth +2.5/5.0
- Condition / age +2.5/5.0
- 1% rule +2.3/10.0
- Schools +2.2/10.0
- Appreciation +0.0/10.0
$309,000
🖨 Deal sheet (PDF) 📄 Offer letter ✓ Due diligence
Listing remarks MLS
Motivated seller, Nice 4-bedroom 2-bath site-built home in Payson. Large lot. 24 acre, with a large, fenced back yard. There is a pellet stove in the family room and a fireplace in the living room. laminate and tile flooring. large utility shed on a slab in the backyard, separated garden area with the metal shed as well with a little TLC. This would make a great starter home.
Key facts
- Fenced back yard
- Utility shed
- Large lot
Tags
Neighborhood map
What this means for you Summary
Snapshot
- This is a 4-bed/2.0-bath single-family listed at $309k.
Deal economics
- At list price, monthly cash flow is $-68 ($-819/yr) — negative.
- To cash-flow at today's rent, offer at most $297k (3.9% below list).
- To meet the 1% rule (rent ≥ 1% of price), the offer needs to be $225k (27.2% below list).
- Recommended offer: $225k (27.2% below list) — sets the bar for 1% rule.
- Cap rate 6.0% vs local median 3.3% in Payson — top-decile yield for the area; either an underpriced asset or a hidden risk that comps aren't pricing in. Stress-test before assuming the spread holds.
Location & tenants
- Location reads 69/100 on livability (#44 in AZ) — a middle-class / working-renter tenant base. Strengths: housing A, crime B, cost of living B; Watch: amenities D-, commute F, health & safety F.
- Payson Unified District (4209) (town): math 20% / reading 32% proficiency, ranked #138 of 249 in AZ (top 55%) — low school quality limits family demand, transient renter base, plan for 1-2y turnover.
- Zoned schools: Julia Randall Elementary School (math 20% / reading 36%, grade F, #586 of 1,109 statewide, top 53%, 576 students, 58% FRL); Rim Country Middle School (math 21% / reading 31%, grade F, #100 of 218 statewide, top 47%, 493 students, 53% FRL); Payson High School (math 22% / reading 32%, grade F, #141 of 381 statewide, top 38%, 790 students, 40% FRL) — zoned schools at 50% FRL track the district average.
- Market conditions: 710 active listings in the ZIP; 1 comparable units currently listed for rent nearby; 217 units permitted in Gila County in 2024 (0 in 5+ unit buildings).
- This rent runs 41% of the median local income ($66k/yr) — at the standard rent-burdened threshold; future hikes will face affordability resistance.
Forward outlook
- Local home prices are declining (-3.0%/yr); year-one equity from $2k of loan paydown is wiped out by about $9k of value loss. Plan a longer hold.
- Gila County population projected at -18% by 2050 — secular population decline; favor cash flow + early exit over multi-decade hold.
Negotiation context
- It's been on market 126 days — a 12% lower offer ($272k) is reasonable based on typical stale-listing flexibility.
- 8 sale attempts since 17y ago with the ask held roughly flat each time — persistent listings suggest the price (not the market) is what's stuck; bring a comps-based counter.
- Current owner paid $195k; list at $309k implies a 58% gain — meaningful room to come down on a strong offer.
Risks & watch-outs
- Climate carrying-cost: severe wildfire risk — expect insurance premiums to compound above CPI over the hold.
Questions for the listing agent
- What do current leases actually rent for vs. the listed asking? Can we see a recent rent roll and the last 12 months of T-12 income?
- It's been on market 126 days. Have you received any prior offers? Is the seller open to a 27% concession, seller financing, or rate buy-down credit?
- Built in 1966 — when were the roof, HVAC, electrical panel, plumbing, and water heater last replaced?
- Why hasn't it sold? Are there any deal-killer items the seller is aware of (foundation, flood, title, zoning, code violations)?
- Is there a deadline driving the sale (1031 exchange, divorce, estate, relocation)? That informs how much negotiation room exists.
- The area grade is low — what's the realistic commute time and amenity access for the typical tenant pool here? Any planned neighborhood developments (good or bad) we should know about?
- What's the average days-on-market for RENTAL listings here right now (not sales)? A rising rental-DOM trend means longer vacancies and softer asking-rent achievability than the comps imply.
- What's the recent tenant-quality profile in this submarket — average credit score on applications, eviction rate, late-payment / NSF rate, and stable-employment percentage? A property-management company in the area should have these aggregated.
- How much new for-sale + rental construction is in the pipeline within 1–3 miles? Heavy new supply typically softens prices + rents 12–24 months out; constrained supply supports both.
Investment metrics
- 1% rule
- 0.73% ✗
- Cap rate
- 6.03%
- Cash-on-cash
- -0.95%
- DSCR
- 0.96
- GRM
- 11.4
CMA / ARV
- ARV (median comp)
- $421,981
- List price
- $309,000
- Delta
- -26.77%
- Verdict
- UNDERPRICED
- Comps
- 20 within 1.0 mi
Show comp detail 12 sales within ~0.75 mi
| Address | Dist | Beds/Ba | Sqft | Sold | Price | $/sf | Match |
|---|---|---|---|---|---|---|---|
| 1017 S Ponderosa St | 0.22mi | 3/2.0 (-1) | 1,462 (+0%) | 4mo | $375,000 | $256 | 81 |
| 214 E Aero Dr | 0.04mi | 3/2.0 (-1) | 1,296 (-11%) | 5mo | $295,000 | $228 | 71 |
| 1019 S Ponderosa St | 0.22mi | 3/2.0 (-1) | 1,650 (+13%) | 0mo | $530,000 | $321 | 62 |
| 207 E Phoenix St | 0.19mi | 3/2.0 (-1) | 1,600 (+10%) | 10mo | $475,000 | $297 | 61 |
| 609 E Phoenix St | 0.43mi | 3/2.0 (-1) | 1,456 (+0%) | 18mo | $380,000 | $261 | 60 |
| 414 W Frontier St | 0.52mi | 3/2.0 (-1) | 1,412 (-3%) | 11mo | $275,000 | $195 | 57 |
| 604 E Amarillo Cir | 0.57mi | 3/2.0 (-1) | 1,515 (+4%) | 9mo | $475,000 | $314 | 54 |
| 913 S Coronado Way | 0.63mi | 3/2.0 (-1) | 1,580 (+9%) | 8mo | $520,000 | $329 | 44 |
| 912 S Coronado Way | 0.60mi | 3/2.0 (-1) | 1,280 (-12%) | 11mo | $475,000 | $371 | 38 |
| 917 S Palomino Cir | 0.73mi | 3/2.0 (-1) | 1,242 (-15%) | 1mo | $459,000 | $370 | 36 |
| 212 S Goodnow Rd | 0.73mi | 3/2.0 (-1) | 1,250 (-14%) | 4mo | $470,000 | $376 | 34 |
| 707 E Cherry St | 0.74mi | 3/2.0 (-1) | 1,600 (+10%) | 16mo | $474,900 | $297 | 31 |
Match score weights: distance 35% · size 25% · config 20% · recency 20%. Top-matched comps best support the ARV.
Projected returns pro-forma
-3.0% appreciation · 3.0% rent growth · sell at horizon
- IRR
- -17.9%
- Equity multiple
- 0.37×
- Total profit
- $-54,564
- Equity at exit
- $46,073
- IRR
- -10.2%
- Equity multiple
- 0.38×
- Total profit
- $-53,698
- Equity at exit
- $26,717
Cash invested: $86,520 (down + closing). Projections, not guarantees.
Landlord ↔ Tenant lean methodology
- Overall (STATE)
- 87 Strongly Landlord-Friendly
- State Arizona
- 87 Strongly Landlord-Friendly · R+3
- County
- — inherits STATE
- City
- — inherits STATE
ZIP-level market 85541
- Home prices YoY
- -6.6%
- Active inventory
- 710
- Price-to-rent
- 11.4×
Monthly cashflow live
- Estimated rent
- $2,250 medium interval (Pro) →
- Mortgage (P&I)
- −$1,620
- Tax from tax record
- −$97 /mo · $1,158/yr
- Insurance
- −$129
- HOA
- −$0
- Vacancy / Maint / Mgmt
- −$472
- Net cashflow
- $-68
Break-even live
Sensitivity live
| Price | -10% $107 | -5% $19 | +0% $-68 | +5% $-156 | +10% $-243 |
|---|---|---|---|---|---|
| Rent | -10% $-246 | -5% $-157 | +0% $-68 | +5% $21 | +10% $109 |
| Rate | -1.0pp $87 | -0.5pp $10 | base $-68 | +0.5pp $-148 | +1.0pp $-230 |
UW: 25.0% down · 7.5% · 30yr · 1.5% tax · 5.0% vac · 8.0% maint · 8.0% mgmt
Financing live
Cash to close
- Down payment
- $77,250
- Closing costs
- $9,270
- Reserves months
- —
- Total cash needed
- —
Loan-product check · same deal, 3 products live
Conventional
25% down · 7.5% · 30yr
- Down + closing
- —
- Monthly P&I
- —
- Monthly cashflow
- —
- DSCR
- —
- Eligible?
- —
Personal DTI + credit; lowest rate.
DSCR
20% down · 8.5% · 30yr
- Down + closing
- —
- Monthly P&I
- —
- Monthly cashflow
- —
- DSCR
- —
- Eligible?
- —
No personal income docs; deal must DSCR.
Hard money
10% down · 12.0% · 12mo
- Down + closing
- —
- Monthly P&I
- —
- Monthly cashflow
- —
- DSCR
- —
- Eligible?
- —
Short-term bridge; refi at stabilization.
Rent comps 1 comps
| Address | Beds | Baths | Sqft | Rent | $/sqft | DOM | Units | Dist |
|---|---|---|---|---|---|---|---|---|
| 1015 S Goodfellow Rd Payson, AZ | 3.0 | 2.0 | 1092 | $2,000 | $1.83 | 23d | 1 | 0.48mi |
Listing history 37 events
-
2026-06-22days on market $309,000 Active 126 DOM
-
2026-06-21days on market $309,000 Active 125 DOM
-
2026-06-19days on market $309,000 Active 123 DOM
-
2026-06-18days on market $309,000 Active 122 DOM
-
2026-06-17days on market $309,000 Active 121 DOM
-
2026-06-16days on market $309,000 Active 120 DOM
-
2026-06-15days on market $309,000 Active 119 DOM
-
2026-06-14days on market $309,000 Active 117 DOM
-
2026-06-12days on market $309,000 Active 116 DOM
-
2026-06-09days on market $309,000 Active 113 DOM
-
2026-06-08days on market $309,000 Active 112 DOM
-
2026-06-07days on market $309,000 Active 111 DOM
-
2026-06-03days on market $309,000 Active 107 DOM
-
2026-06-02days on market $309,000 Active 106 DOM
-
2026-06-01days on market $309,000 Active 105 DOM
-
2026-05-31days on market $309,000 Active 104 DOM
-
2026-05-31days on market $309,000 Active 103 DOM
-
2026-04-01price $314,000 379-char remark
Show marketing remark (377 chars)
Nice 4-bedroom 2-bath site-built home in Payson. Large lot.24 acre, with a large, fenced back yard. There is a pellet stove in the family room and a fireplace in the living room. laminate and tile flooring. large utility shed on a slab in the backyard, separated garden area with the metal shed as well with a little TLC. This would make a great starter home. Motivated seller
-
2026-04-01price $314,000 377-char remark
Show marketing remark (377 chars)
Nice 4-bedroom 2-bath site-built home in Payson. Large lot.24 acre, with a large, fenced back yard. There is a pellet stove in the family room and a fireplace in the living room. laminate and tile flooring. large utility shed on a slab in the backyard, separated garden area with the metal shed as well with a little TLC. This would make a great starter home. Motivated seller
-
2026-02-16$319,000 Active 377-char remark
Show marketing remark (377 chars)
Nice 4-bedroom 2-bath site-built home in Payson. Large lot.24 acre, with a large, fenced back yard. There is a pellet stove in the family room and a fireplace in the living room. laminate and tile flooring. large utility shed on a slab in the backyard, separated garden area with the metal shed as well with a little TLC. This would make a great starter home. Motivated seller
-
2026-02-15$319,000 Active 379-char remark
Show marketing remark (379 chars)
Motivated seller, Nice 4-bedroom 2-bath site-built home in Payson. Large lot. 24 acre, with a large, fenced back yard. There is a pellet stove in the family room and a fireplace in the living room. laminate and tile flooring. large utility shed on a slab in the backyard, separated garden area with the metal shed as well with a little TLC. This would make a great starter home.
-
2020-05-04soldstatus $195,000
-
2020-05-04soldstatus $195,000
-
2019-08-26$190,000
-
2019-07-05soldstatus $155,000
-
2019-07-05soldstatus $155,000
-
2018-07-17$159,000
-
2018-07-17$159,000
-
2017-11-01historical
-
2017-10-05$160,000
-
2017-09-30historical
-
2016-12-27$160,000
-
2010-01-02historical
-
2009-07-03$154,900
-
2003-04-11soldstatus $109,500
-
1996-05-30soldstatus $69,000
-
1990-03-09soldstatus $51,900
ⓘ Source: listings_history table (triggers on properties + properties_extension) + one-shot
backfill from property_details.listing_events for pre-trigger history.
Tax reassessment forecast AZ · Resets to sale price
- Current annual tax
- $1,158 · $97/mo
- Projected year-2 tax
- $2,039 · $170/mo
- Expected delta
- +$881/yr (+$73/mo · 76.0%)
ⓘ Screening estimate from a state-policy table — verify with the county assessor before closing.
Climate risk First Street
- Flood 1/10 Low FEMA zone X (unshaded) · 0% chance over 30 yrs
- Wildfire 8/10 Severe
- Heat 4/10 Moderate 7 d/yr ≥96°F today · 20 d/yr by 30 yrs out
- Wind 1/10 Low
- Air quality 1/10 Low 0 unhealthy d/yr today · 0 by 30 yrs out
Nearby sold comps map
Loading sold comps map…
Walkable amenities ~0.75 mi
Loading nearby amenities…
Taxation est. · year 1
- Rental income
- $26,999
- − Mortgage interest
- −$17,309
- − Property taxes
- −$1,158
- − Insurance
- −$1,545
- − Repairs & maintenance
- −$2,160
- − Management
- −$2,160
- − Depreciation
- −$8,989
- Taxable loss
- −$6,322
- Est. tax savings @ 24.0%
- +$1,517
- After-tax cash flow
- $698/yr
For passive investors: Depreciation is non-cash, so a rental often shows a tax loss while cash-flowing — sheltering income. Rental losses are passive: they offset passive income freely, and up to $25,000/yr can offset ordinary (W-2) income if you actively participate and your MAGI is under $100k (phasing out to $0 by $150k); unused losses carry forward. On sale, claimed depreciation is recaptured at up to 25%, and gains may owe capital-gains tax (a 1031 exchange can defer both). Figures are a year-1 estimate at your 24.0% rate — not tax advice; consult a CPA.
Schools (NCES district)
- District
- Payson Unified District (4209)
- NCES district ID
- 0406070
- Math proficiency
- 20% ▼ -21.00%
- Reading proficiency
- 32% ▼ -16.00%
- Median HH income
- $41,440
- Composite
- 22.03/100
- National rank
- #8200
- State rank
- #138 of 249 in AZ
Livability — Payson
- Score
- 69/100
- State rank
- #44
- US rank
- #8740
Category grades
Schools grade is shown separately in the Schools card above.
Census & demographics
- Census place
- Payson, AZ
- County
- Gila County · 23,382 people
- City population
- 23,382
- Metro
- Payson, AZ
- Population (ZIP)
- 23,382
- Household income
- $66,383
- Rent vs Own
- Severe rent burden
- 523.0
Population outlook (Gila County) Hauer SSP2
- Today (2025)
- 50,229 people
- By 2030
- 48,202 · -4.0%
- By 2040
- 44,101 · -12.2%
- By 2050
- 41,041 · -18.3%
- By 2075
- 37,536 · -25.3%
- By 2100
- 32,485 · -35.3%
Race, ethnicity, and origin ACS 2023
- Neighborhood character
- Predominantly White (84%)
- Race & ethnicity
- White 84% Hispanic / Latino 11% Two or more races 8% Native American 1%
- Hispanic origin (detail)
- Mexican 9%
- Common ancestry
- Portuguese 3% Lithuanian 2% Iranian 2%
- Foreign-born
- 3% · Canada
- Languages at home
- 93% English-only · Spanish 5% German/W. Germanic 1%
Political lean MEDSL · Gila
- 2024 margin
- Solid R (+37.6) · D 30.8% · R 68.4%
- 2008→2024 swing
- -9.8pp toward R · 2008: -27.8pp · 2024: -37.6pp
- All cycles
- 2024: R+37.6 2020: R+34.1 2016: R+32.4 2012: R+26.4 2008: R+27.8
Not yet ingested
- Civics
- —
Market trends
- HPI YoY
- ▼ -29.47%
- Current HPI
- 416.4005
- Rent YoY
- —
- Metro
- Payson, AZ
- State GDP YoY
- ▲ 4.54%
- F500 in state
- 20
Industry mix (Fortune 500 HQ in AZ)
| Industry | F500 HQs | Revenue |
|---|---|---|
| Technology | 2 | $13B |
|
||
| Mining / Metals | 1 | $23B |
|
||
| Environmental Services | 1 | $16B |
|
||
| Metals / Steel | 1 | $14B |
|
||
| Technology Distribution | 1 | $9B |
|
||
| Homebuilding | 1 | $8B |
|
||
Price history
+505.0% since first listed20 events — show timeline
- 2026-04-01 Price Changed $314,000 CAAR
- 2026-04-01 Price Changed $314,000 ARMLS
- 2026-02-16 Listed $319,000 ARMLS
- 2026-02-15 Listed $319,000 CAAR
- 2020-05-04 Sold (Public Records) $195,000 Public Records
- 2020-05-04 Sold (MLS) $195,000 CAAR
- 2019-08-26 Listed $190,000 CAAR
- 2019-07-05 Sold (Public Records) $155,000 Public Records
- 2019-07-05 Sold (MLS) $155,000 CAAR
- 2018-07-17 Listed $159,000 ARMLS
- 2018-07-17 Listed $159,000 CAAR
- 2017-11-01 Listing Removed — ARMLS
- 2017-10-05 Listed $160,000 ARMLS
- 2017-09-30 Listing Removed — ARMLS
- 2016-12-27 Listed $160,000 ARMLS
- 2010-01-02 Listing Removed — ARMLS
- 2009-07-03 Listed $154,900 ARMLS
- 2003-04-11 Sold (Public Records) $109,500 Public Records
- 1996-05-30 Sold (Public Records) $69,000 Public Records
- 1990-03-09 Sold (Public Records) $51,900 Public Records
Property tax history
+2.6%/yrLatest (2025): $1,158 · +0.8% YoY. Source: county tax records.
Cash-flow waterfall
monthlySold comps — $/sqft
last 12 mo · ≤1 miLoading sold comps…