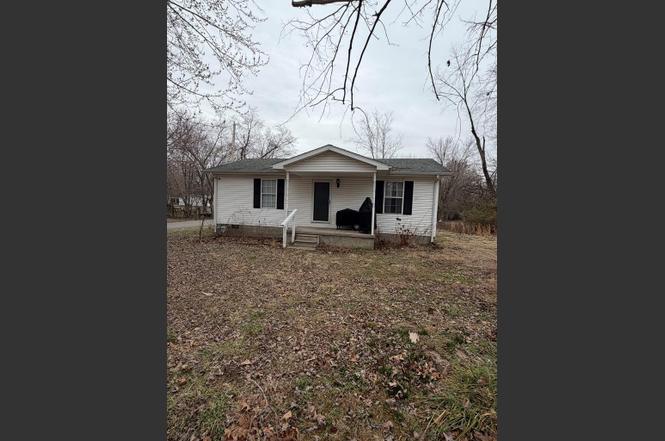
800 Lakeview Ave · Providence, KY
Flood risk 1/10 · Minimal
- FEMA flood zone
- X (unshaded)
- Chance of flooding over 30 yrs
- 0.0%
- Est. flood insurance / yr
- $507 – $1,088
Fire risk 4/10 · Minor
- Est. fire insurance / yr
- $839 – $1,559
Heat risk 5/10 · Moderate
- Hot days now (above 109°F)
- 7 days/yr
- Hot days in 30 yrs
- 19 days/yr
Wind risk 3/10 · Minor
- Chance of severe wind over 30 yrs
- 5.0%
Air-quality risk 2/10 · Minimal
- Unhealthy air days now
- 1 days/yr
- Unhealthy air days in 30 yrs
- 1 days/yr
Risk factors via First Street. Map © Google.
Why this score? — see what drove the C grade
The composite is a weighted blend of 9 inputs, each scored 0–100. Each bar is that input's sub-score; the figure is the points it added to the 100-point composite (weight × sub-score).
- Cash flow +25.2/30.0
- DSCR +8.3/10.0
- Appreciation +7.7/10.0
- 1% rule +6.0/10.0
- Livability +3.1/5.0
- Rent growth +2.5/5.0
- Schools +2.5/10.0
- Condition / age +2.5/5.0
- ARV discount +0.0/15.0
$85,000
🖨 Deal sheet 📄 Offer letter ✓ Due diligence
Listing remarks
What a great buy for a first time home buyer. Two bed and one bath home with a open floor plan. This would also be a good investment opportunity. Contact Linda Ramsey for a tour. 270-339-1745
Key facts
- 6,098 sq ft lot
- Listed 43 days
Property features AI
Exterior
- Parking: Gravel parking
- Security: Smoke detector(s)
- Utilities: Public water; Public sewer
- Home design: Single-family residence; Residential property
- Construction: Vinyl siding; Composition roof
- Exterior features: Covered deck
Interior
- Kitchen: Range; Gas range; Dishwasher; Refrigerator
- Bedrooms: 2 bedrooms on the main level
- Flooring: Hardwood
- Bathrooms: 1 full bathroom (main level)
- Heating & cooling: Natural gas heating; Central air; Ceiling fan(s)
- Interior features: Hardwood floors; Smoke detector(s)
- Laundry & utility: Washer and dryer on the main level; Gas water heater
Neighborhood map
What this means for you Summary
Snapshot
- This is a 2-bed/1.0-bath single-family listed at $85k.
Deal economics
- At list price, monthly cash flow is $191 ($2k/yr) — positive.
- The deal already cash-flows at list — no discount required.
- Meets the 1% rule at list price ($934 rent vs $85k).
- Recommended offer: $82k (3.0% below list) — sets the bar for market timing.
Location & tenants
- Location reads 62/100 on livability (#352 in KY) — a middle-class / working-renter tenant base. Strengths: crime A+, cost of living A+, housing A; Watch: schools D-, amenities F, commute F.
- Webster County (rural): math 25% / reading 34% proficiency, ranked #114 of 165 in KY (top 69%) — low school quality limits family demand, transient renter base, plan for 1-2y turnover.
- Market conditions: 21 active listings in the ZIP; 6 units permitted in Webster County in 2024 (0 in 5+ unit buildings).
Forward outlook
- In year one you build about $5k of equity ($588 loan paydown + $5k appreciation (5.4% local appreciation)).
- Webster County population projected at -14% by 2050 — secular population decline; favor cash flow + early exit over multi-decade hold.
- At projected returns (5.4% appreciation + 3.0% rent growth), your $24k cash investment doubles in ~3 years — after that, you're playing with house money.
- By year 7, paydown + projected appreciation supports a ~$34k cash-out refi (75% LTV) — recoverable capital for the next deal without selling this one.
Negotiation context
- It's been on market 43 days — a 3% lower offer ($82k) is reasonable based on typical stale-listing flexibility.
- 3 sale attempts with the ask held roughly flat each time — persistent listings suggest the price (not the market) is what's stuck; bring a comps-based counter.
Risks & watch-outs
- Climate carrying-cost: extreme-heat days projected 7→19/yr by 2055 (HVAC capex compounding) — expect insurance premiums to compound above CPI over the hold.
Questions for the listing agent
- It's been on market 43 days. Have you received any prior offers? Is the seller open to a 3% concession, seller financing, or rate buy-down credit?
- Is there a deadline driving the sale (1031 exchange, divorce, estate, relocation)? That informs how much negotiation room exists.
- Schools are D-rated, which usually means shorter tenancies and higher turnover. Who's the typical renter profile here, and what's been the actual vacancy rate?
- What's the average days-on-market for RENTAL listings here right now (not sales)? A rising rental-DOM trend means longer vacancies and softer asking-rent achievability than the comps imply.
- What's the recent tenant-quality profile in this submarket — average credit score on applications, eviction rate, late-payment / NSF rate, and stable-employment percentage? A property-management company in the area should have these aggregated.
- How much new for-sale + rental construction is in the pipeline within 1–3 miles? Heavy new supply typically softens prices + rents 12–24 months out; constrained supply supports both.
Investment metrics
- 1% rule
- 1.10% ✓
- Cap rate
- 8.99%
- Cash-on-cash
- 9.62%
- DSCR
- 1.43
- GRM
- 7.6
CMA / ARV
- ARV (on-the-fly)
- $65,520
- Comps found
- 8
Show comp detail 8 sales within ~0.75 mi
| Address | Dist | Beds/Ba | Sqft | Sold | Price | $/sf | Match |
|---|---|---|---|---|---|---|---|
| 505 Church St | 0.23mi | 2/1.0 | 1,050 (+1%) | 11mo | $45,000 | $43 | 78 |
| 805 Givens St | 0.29mi | 3/1.0 (+1) | 1,075 (+3%) | 2mo | $18,000 | $17 | 74 |
| 403 Church St | 0.31mi | 3/1.0 (+1) | 1,050 (+1%) | 6mo | $140,000 | $133 | 74 |
| 614 Saint Bernard St | 0.10mi | 2/1.0 | 888 (-15%) | 0mo | $74,000 | $83 | 71 |
| 708 Maple St | 0.38mi | 3/1.0 (+1) | 1,040 (0%) | 11mo | $65,000 | $63 | 68 |
| 701 Maple St | 0.36mi | 3/1.0 (+1) | 1,148 (+10%) | 10mo | $81,500 | $71 | 53 |
| 111 Vaughn St | 0.57mi | 1/1.0 (-1) | 979 (-6%) | 15mo | $14,800 | $15 | 46 |
| 217 N Green St | 0.55mi | 2/1.0 | 884 (-15%) | 23mo | $30,000 | $34 | 31 |
Match score weights: distance 35% · size 25% · config 20% · recency 20%. Top-matched comps best support the ARV.
Projected returns pro-forma
5.4% appreciation · 3.0% rent growth · sell at horizon
- IRR
- 22.0%
- Equity multiple
- 2.41×
- Total profit
- $33,676
- Equity at exit
- $50,235
- IRR
- 21.3%
- Equity multiple
- 4.80×
- Total profit
- $90,426
- Equity at exit
- $88,457
Cash invested: $23,800 (down + closing). Projections, not guarantees.
Landlord ↔ Tenant lean methodology
- Overall (STATE)
- 83 Strongly Landlord-Friendly
- State Kentucky
- 83 Strongly Landlord-Friendly · R+16
- County
- — inherits STATE
- City
- — inherits STATE
ZIP-level market 42450
- Home prices YoY
- 2.3%
- Active inventory
- 21
- Price-to-rent
- 7.6×
Monthly cashflow live
- Estimated rent
- $934 medium interval (Pro) →
- Mortgage (P&I)
- −$446
- Tax from tax record
- −$66 /mo · $794/yr
- Insurance
- −$35
- HOA
- −$0
- Vacancy / Maint / Mgmt
- −$196
- Net cashflow
- $191
Break-even live
UW: 25.0% down · 7.5% · 30yr · 1.5% tax · 5.0% vac · 8.0% maint · 8.0% mgmt
Financing live
Cash to close
- Down payment
- $21,250
- Closing costs
- $2,550
- Reserves months
- —
- Total cash needed
- —
Loan-product check · same deal, 3 products live
Conventional
25% down · 7.5% · 30yr
- Down + closing
- —
- Monthly P&I
- —
- Monthly cashflow
- —
- DSCR
- —
- Eligible?
- —
Personal DTI + credit; lowest rate.
DSCR
20% down · 8.5% · 30yr
- Down + closing
- —
- Monthly P&I
- —
- Monthly cashflow
- —
- DSCR
- —
- Eligible?
- —
No personal income docs; deal must DSCR.
Hard money
10% down · 12.0% · 12mo
- Down + closing
- —
- Monthly P&I
- —
- Monthly cashflow
- —
- DSCR
- —
- Eligible?
- —
Short-term bridge; refi at stabilization.
Listing history 9 events
-
2026-05-31status $85,000 Pending 43 DOM
-
2026-05-31days on market $85,000 Active 43 DOM
-
2026-05-31days on market $85,000 Active 42 DOM
-
2026-05-22status Active
-
2026-04-27status Pending
-
2026-04-08status Active
-
2026-03-11status Pending
-
2026-02-25$85,000 Active
-
2023-09-06soldstatus $75,000
ⓘ Source: listings_history table (triggers on properties + properties_extension) + one-shot
backfill from property_details.listing_events for pre-trigger history.
Tax reassessment forecast KY · Resets to sale price
- Current annual tax
- $794 · $66/mo
- Projected year-2 tax
- $794 · $66/mo
- Expected delta
- $0/yr ($0/mo · 0.0%)
ⓘ Screening estimate from a state-policy table — verify with the county assessor before closing.
Climate risk First Street
- Flood 1/10 Low FEMA zone X (unshaded) · 0% chance over 30 yrs
- Wildfire 4/10 Moderate
- Heat 5/10 Major 7 d/yr ≥109°F today · 19 d/yr by 30 yrs out
- Wind 3/10 Moderate 5% chance of damaging wind over 30 yrs
- Air quality 2/10 Low 1 unhealthy d/yr today · 1 by 30 yrs out
Nearby sold comps map
Loading sold comps map…
Walkable amenities ~0.75 mi
Loading nearby amenities…
Taxation est. · year 1
- Rental income
- $11,212
- − Mortgage interest
- −$4,761
- − Property taxes
- −$794
- − Insurance
- −$425
- − Repairs & maintenance
- −$897
- − Management
- −$897
- − Depreciation
- −$2,473
- Taxable income
- $965
- Est. tax owed @ 24.0%
- −$232
- After-tax cash flow
- $2,058/yr
For passive investors: Depreciation is non-cash, so a rental often shows a tax loss while cash-flowing — sheltering income. Rental losses are passive: they offset passive income freely, and up to $25,000/yr can offset ordinary (W-2) income if you actively participate and your MAGI is under $100k (phasing out to $0 by $150k); unused losses carry forward. On sale, claimed depreciation is recaptured at up to 25%, and gains may owe capital-gains tax (a 1031 exchange can defer both). Figures are a year-1 estimate at your 24.0% rate — not tax advice; consult a CPA.
Schools (NCES district)
- District
- Webster County
- NCES district ID
- 2105820
- Math proficiency
- 25% ▼ -17.00%
- Reading proficiency
- 34% ▼ -16.00%
- Median HH income
- $39,542
- Composite
- 24.76/100
- National rank
- #7600
- State rank
- #114 of 165 in KY
Livability — Providence
- Score
- 62/100
- State rank
- #352
- US rank
- #16669
Category grades
Schools grade is shown separately in the Schools card above.
Census & demographics
- Census place
- Providence, KY
- Population (ZIP)
- 3,589
Population outlook (Webster County) Hauer SSP2
- Today (2025)
- 12,548 people
- By 2030
- 12,119 · -3.4%
- By 2040
- 11,345 · -9.6%
- By 2050
- 10,761 · -14.2%
- By 2075
- 10,166 · -19.0%
- By 2100
- 10,546 · -16.0%
Race, ethnicity, and origin ACS 2023
- Neighborhood character
- Predominantly White (85%)
- Race & ethnicity
- White 85% Black 12% Two or more races 1%
- Common ancestry
- Italian 4% Iranian 1% Russian 1%
- Languages at home
- 99% English-only · Other Indo-European 1%
Political lean MEDSL · Webster
- 2024 margin
- Solid R (+57.4) · D 20.8% · R 78.1% · Other 1.1%
- 2008→2024 swing
- -45.7pp toward R · 2008: -11.7pp · 2024: -57.4pp
- All cycles
- 2024: R+57.4 2020: R+51.6 2016: R+54.4 2012: R+33.7 2008: R+11.7
Not yet ingested
- Civics
- —
Market trends
- HPI YoY
- ▲ 5.40%
- Current HPI
- 240.0686
- Rent YoY
- —
- Metro
- —
- State GDP YoY
- ▲ 1.81%
- F500 in state
- 4
Industry mix (Fortune 500 HQ in KY)
| Industry | F500 HQs | Revenue |
|---|---|---|
| Healthcare | 1 | $118B |
|
||
| Food / Beverage | 1 | $7B |
|
||
Price history
+13.3% since first listed6 events — show timeline
- 2026-05-22 Relisted — MHCBOR
- 2026-04-27 Pending — MHCBOR
- 2026-04-08 Relisted — MHCBOR
- 2026-03-11 Pending — MHCBOR
- 2026-02-25 Listed $85,000 MHCBOR
- 2023-09-06 Sold (Public Records) $75,000 Public Records
Property tax history
+4.6%/yrLatest (2025): $794 · -0.1% YoY. Source: county tax records.
Cash-flow waterfall
monthlySold comps — $/sqft
last 12 mo · ≤1 miLoading sold comps…