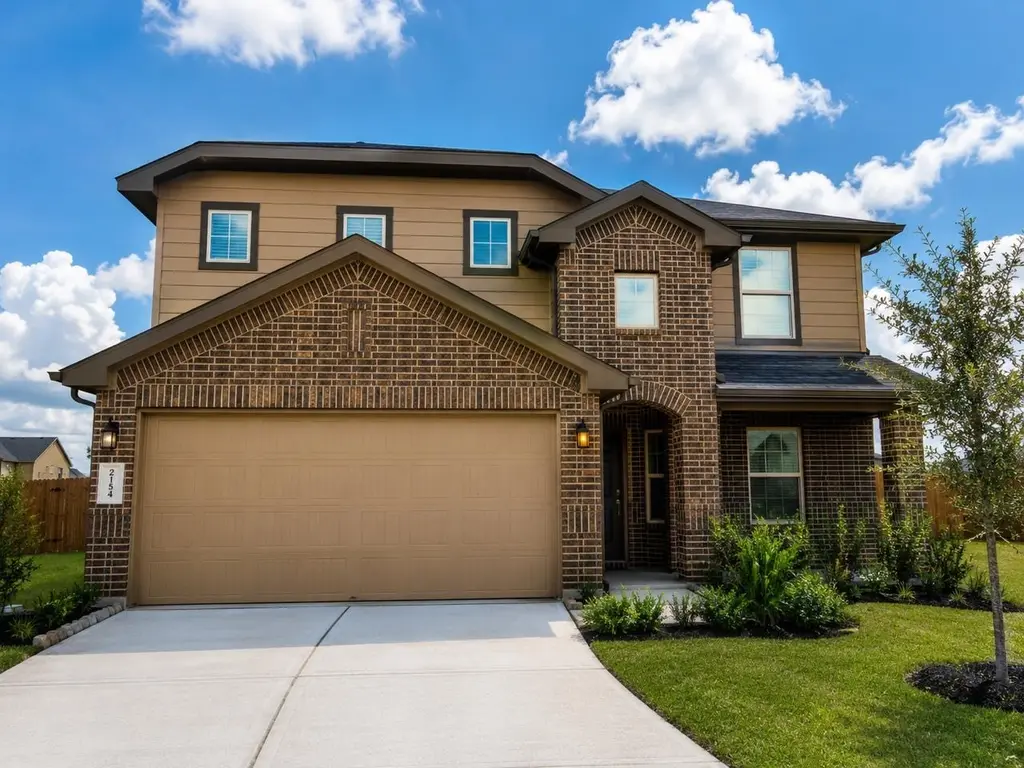
2154 Bravos Manor Ln · Fresno, TX
Flood risk 1/10 · Minimal
- FEMA flood zone
- X (unshaded)
- Chance of flooding over 30 yrs
- 0.0%
- Est. flood insurance / yr
- $507 – $1,088
Fire risk 4/10 · Minor
- Est. fire insurance / yr
- $1,222 – $2,270
Heat risk 9/10 · Severe
- Hot days now (above 110°F)
- 7 days/yr
- Hot days in 30 yrs
- 24 days/yr
Wind risk 9/10 · Severe
- Chance of severe wind over 30 yrs
- 99.0%
Air-quality risk 2/10 · Minimal
- Unhealthy air days now
- 2 days/yr
- Unhealthy air days in 30 yrs
- 2 days/yr
Risk factors via First Street. Map © Google.
Why this score? — see what drove the D grade
The composite is a weighted blend of 9 inputs, each scored 0–100. Each bar is that input's sub-score; the figure is the points it added to the 100-point composite (weight × sub-score).
- Cash flow +10.9/30.0
- ARV discount +6.5/15.0
- Schools +4.5/10.0
- 1% rule +4.1/10.0
- Appreciation +4.0/10.0
- DSCR +3.1/10.0
- Livability +3.1/5.0
- Condition / age +2.5/5.0
- Rent growth +2.3/5.0
$319,999
🖨 Deal sheet (PDF) 📄 Offer letter ✓ Due diligence
Listing remarks MLS
The 2256 Floor Plan, Elevation "A" by D. R. Horton Homes! New Gorgeous two story home showcases 4 bedrooms, 2 1/2 bathrooms, upgraded extended covered front porch entry, rounded corners, soaring ceilings, 2"blinds & tile floors throughout! Elegant formal dining room! Gourmet Kitchen w/ granite counters, tile back-splash, tall cabinets, large island, working station breakfast bar, stainless steel appliances & walk-in pantry which flows gracefully into huge living room with high vaulted ceilings! Master downstairs with Huge luxurious master bathroom with dual sink vanity, huge glass shower, built for two & walk-in-closet! Upstairs you will find huge game room, 3 Large secondary bedrooms & 1 full bath with dual sinks & more! Covered rear patio! Amazing Standard energy features include HERS Energy Rated & Tank-less Water Heater & more! Wonderful Amenity Center with Pool, Splash Pad, Lakes & Walking Trails! NO FLOODING IN SUBDIVISION!
Key facts
- Two-story home
- Primary suite
- Granite countertops
Tags
Property features AI
Finance
- Other: Concrete road surface
- HOA & community: Post Oak Property association; Annual association fee of $650; Community has curbs and gutters
Exterior
- Parking: Attached 2-car garage; Driveway; Garage door opener
- Security: Security gate; Prewired for security; Smoke detectors
- Utilities: Public water; Public sewer
- Home design: Residential property; Faces south; Built in 2018; Slab foundation
- Construction: Brick and cement siding; Composition roof
- Exterior features: Covered patio; Fully fenced backyard; Fence; Paved driveway; Patio; Deck; Subdivision lot
Interior
- Kitchen: Dishwasher; Disposal; Gas oven; Gas range; Microwave; Oven
- Bedrooms: Total rooms: 10
- Flooring: Carpet; Plank; Tile; Vinyl
- Bathrooms: 2 full bathrooms; 1 half bathroom
- Heating & cooling: Central heating (gas); Central air (electric)
- Interior features: Breakfast bar; Double vanity; High ceilings; Kitchen island; Kitchen/family room combo; Bath in primary bedroom; Pantry; Soaking tub; Separate shower; Tub/shower; Vanity; Walk-in pantry; Window treatments; Kitchen/dining combo; Gas log fireplace (1)
- Laundry & utility: Washer hookup; Electric dryer hookup
Neighborhood map
What this means for you Summary
Snapshot
- This is a 4-bed/3.0-bath single-family listed at $320k.
Deal economics
- At list price, monthly cash flow is $-143 ($-2k/yr) — negative.
- To cash-flow at today's rent, offer at most $295k (7.9% below list).
- To meet the 1% rule (rent ≥ 1% of price), the offer needs to be $291k (9.0% below list).
- Recommended offer: $291k (9.0% below list) — sets the bar for 1% rule.
Location & tenants
- Location reads 62/100 on livability (#943 in TX) — a middle-class / working-renter tenant base. Strengths: employment A+, housing A+, cost of living A; Watch: crime C-, amenities F, commute F.
- Fort Bend ISD (suburban): math 44% / reading 53% proficiency, ranked #140 of 826 in TX (top 17%) — families likely to look elsewhere, expect single-tenant / working-renter base with shorter leases.
- Zoned schools: Rosa Parks El (math 16% / reading 27%, grade F, #3,470 of 4,322 statewide, top 81%, 651 students, 76% FRL); Lake Olympia Middle (math 18% / reading 31%, grade F, #1,279 of 1,662 statewide, top 78%, 1,170 students, 71% FRL); Fort Bend Co Alter (26 students, 0% FRL).
- Zoned-school proficiency averages 23% at this address vs 48% district-wide (-26 pts) — the specific schools serving this property underperform the Fort Bend ISD average; the district grade overstates school quality for this exact location.
- Market conditions: Rents soft (-0.9%/yr); 177 active listings in the ZIP; 12 comparable units currently listed for rent nearby; rentals at typical pace (median 23d on market — plan ~3-4 weeks tenant-placement turnaround); solid renter incomes; 12,093 units permitted in Fort Bend County in 2024 (815 in 5+ unit buildings).
- This rent runs 37% of the median local income ($94k/yr) — at the standard rent-burdened threshold; future hikes will face affordability resistance.
Forward outlook
- Local home prices are declining (-2.0%/yr); year-one equity from $2k of loan paydown is wiped out by about $6k of value loss. Plan a longer hold.
- Fort Bend County population projected at +75% by 2050 — long-run rental-demand tailwind backs the buy-and-hold thesis.
Negotiation context
- Only 14 days on market — expect competitive offers; lowballing is unlikely to land.
- 2 sale attempts since 8y ago with the ask held roughly flat each time — persistent listings suggest the price (not the market) is what's stuck; bring a comps-based counter.
Risks & watch-outs
- Climate carrying-cost: severe wind risk, 99% chance of damaging wind over 30y; extreme-heat days projected 7→24/yr by 2055 (HVAC capex compounding) — expect insurance premiums to compound above CPI over the hold.
Questions for the listing agent
- What do current leases actually rent for vs. the listed asking? Can we see a recent rent roll and the last 12 months of T-12 income?
- What does the HOA fee cover, when was the last increase, and are there any pending special assessments or reserve-fund shortfalls?
- Is there a deadline driving the sale (1031 exchange, divorce, estate, relocation)? That informs how much negotiation room exists.
- Schools are D-rated, which usually means shorter tenancies and higher turnover. Who's the typical renter profile here, and what's been the actual vacancy rate?
- The area grade is low — what's the realistic commute time and amenity access for the typical tenant pool here? Any planned neighborhood developments (good or bad) we should know about?
- What's the average days-on-market for RENTAL listings here right now (not sales)? A rising rental-DOM trend means longer vacancies and softer asking-rent achievability than the comps imply.
- What's the recent tenant-quality profile in this submarket — average credit score on applications, eviction rate, late-payment / NSF rate, and stable-employment percentage? A property-management company in the area should have these aggregated.
- How much new for-sale + rental construction is in the pipeline within 1–3 miles? Heavy new supply typically softens prices + rents 12–24 months out; constrained supply supports both.
Investment metrics
- 1% rule
- 0.91% ✗
- Cap rate
- 5.76%
- Cash-on-cash
- -1.92%
- DSCR
- 0.91
- GRM
- 9.2
CMA / ARV
- ARV (on-the-fly)
- $313,292
- Comps found
- 12
Show comp detail 12 sales within ~0.75 mi
| Address | Dist | Beds/Ba | Sqft | Sold | Price | $/sf | Match |
|---|---|---|---|---|---|---|---|
| 3007 Acacia Fair Ln | 0.28mi | 4/2.5 | 2,351 (+1%) | 2mo | $310,000 | $132 | 83 |
| 2543 Tucker Creek Dr | 0.35mi | 4/3.0 | 2,323 (-1%) | 1mo | $300,000 | $129 | 81 |
| 2403 Tall Sequoia Dr | 0.38mi | 4/2.5 | 2,340 (+0%) | 1mo | $332,500 | $142 | 79 |
| 2611 Cottage Step Trl Trl | 0.38mi | 4/2.5 | 2,392 (+2%) | 2mo | $295,000 | $123 | 75 |
| 1931 Acorn Glen Trl | 0.29mi | 4/2.5 | 2,480 (+6%) | 1mo | $279,900 | $113 | 74 |
| 2406 Grove View Trl | 0.18mi | 4/2.0 | 2,165 (-7%) | 2mo | $297,500 | $137 | 74 |
| 1927 Vermillion View St | 0.31mi | 4/2.5 | 2,215 (-5%) | 1mo | $277,500 | $125 | 74 |
| 3111 Cambridge Falls Dr | 0.49mi | 4/2.5 | 2,352 (+1%) | 3mo | $315,000 | $134 | 72 |
| 2923 Vales Point Dr | 0.16mi | 4/2.0 | 2,079 (-11%) | 1mo | $306,900 | $148 | 69 |
| 2050 Bravos Manor Ln | 0.12mi | 4/2.5 | 2,658 (+14%) | 3mo | $369,990 | $139 | 67 |
| 2022 Wellfleet Xing | 0.25mi | 4/2.0 | 2,098 (-10%) | 0mo | $290,000 | $138 | 67 |
| 2531 Tucker Crk | 0.35mi | 5/2.5 (+1) | 2,626 (+12%) | 3mo | $319,900 | $122 | 54 |
Match score weights: distance 35% · size 25% · config 20% · recency 20%. Top-matched comps best support the ARV.
Projected returns pro-forma
-1.98% appreciation · 0.0% rent growth · sell at horizon
- IRR
- -16.3%
- Equity multiple
- 0.38×
- Total profit
- $-55,476
- Equity at exit
- $62,434
- IRR
- -13.8%
- Equity multiple
- 0.11×
- Total profit
- $-79,919
- Equity at exit
- $53,628
Cash invested: $89,600 (down + closing). Projections, not guarantees.
Landlord ↔ Tenant lean methodology
- Overall (STATE)
- 87 Strongly Landlord-Friendly
- State Texas
- 87 Strongly Landlord-Friendly · R+5
- County
- — inherits STATE
- City
- — inherits STATE
ZIP-level market 77545
- Home prices YoY
- -0.8%
- Rents YoY
- -0.9%
- Active inventory
- 177
- Price-to-rent
- 9.2×
Monthly cashflow live
- Estimated rent
- $2,913 high interval (Pro) →
- Mortgage (P&I)
- −$1,678
- Tax from tax record
- −$579 /mo · $6,950/yr
- Insurance
- −$133
- HOA
- −$54
- Vacancy / Maint / Mgmt
- −$612
- Net cashflow
- $-143
Break-even live
Sensitivity live
| Price | -10% $38 | -5% $-52 | +0% $-143 | +5% $-234 | +10% $-324 |
|---|---|---|---|---|---|
| Rent | -10% $-373 | -5% $-258 | +0% $-143 | +5% $-28 | +10% $87 |
| Rate | -1.0pp $18 | -0.5pp $-62 | base $-143 | +0.5pp $-226 | +1.0pp $-310 |
UW: 25.0% down · 7.5% · 30yr · 1.5% tax · 5.0% vac · 8.0% maint · 8.0% mgmt
Financing live
Cash to close
- Down payment
- $80,000
- Closing costs
- $9,600
- Reserves months
- —
- Total cash needed
- —
Loan-product check · same deal, 3 products live
Conventional
25% down · 7.5% · 30yr
- Down + closing
- —
- Monthly P&I
- —
- Monthly cashflow
- —
- DSCR
- —
- Eligible?
- —
Personal DTI + credit; lowest rate.
DSCR
20% down · 8.5% · 30yr
- Down + closing
- —
- Monthly P&I
- —
- Monthly cashflow
- —
- DSCR
- —
- Eligible?
- —
No personal income docs; deal must DSCR.
Hard money
10% down · 12.0% · 12mo
- Down + closing
- —
- Monthly P&I
- —
- Monthly cashflow
- —
- DSCR
- —
- Eligible?
- —
Short-term bridge; refi at stabilization.
Rent comps 12 comps
| Address | Beds | Baths | Sqft | Rent | $/sqft | DOM | Units | Dist |
|---|---|---|---|---|---|---|---|---|
| 2123 Witham Park Ln Fresno, TX | 4.0 | 4.0 | 3026 | $2,850 | $0.94 | 45d | 1 | 0.48mi |
| 3526 Cambridge Falls Dr Fresno, TX | 4.0 | 3.0 | 3136 | $2,624 | $0.84 | 22d | 1 | 0.52mi |
| 2642 Sunlit Meadow Trl Fresno, TX | 5.0 | 3.5 | 2785 | $4,000 | $1.44 | 45d | 1 | 0.59mi |
| 3314 Dry Creek Dr Missouri City, TX | 4.0 | 3.0 | 2600 | $4,200 | $1.62 | 45d | 1 | 1.07mi |
| 3106 Presley Jane Ct Missouri City, TX | 3.0 | 2.0 | 2109 | $2,271 | $1.08 | 7d | 1 | 1.09mi |
| 3932 Teal Run Place Ct Fresno, TX | 4.0 | 2.0 | 1914 | $2,150 | $1.12 | 45d | 1 | 1.18mi |
| 3806 Teal Maple Ct Fresno, TX | 4.0 | 3.5 | 2318 | $2,146 | $0.93 | 4d | 1 | 1.18mi |
| 3218 Clayton Terrace Dr Missouri City, TX | 4.0 | 3.0 | 2278 | $2,395 | $1.05 | 21d | 1 | 1.20mi |
| 3211 Breckinridge Ct Missouri City, TX | 4.0 | 2.5 | 2920 | $2,550 | $0.87 | 22d | 1 | 1.25mi |
| 2709 Troy Dr Missouri City, TX | 3.0 | 2.5 | 2082 | $2,245 | $1.08 | 22d | 1 | 1.37mi |
| 2707 Troy Dr Missouri City, TX | 3.0 | 2.5 | 2082 | $2,245 | $1.08 | 3d | 1 | 1.37mi |
| 3212 Aldridge Dr Missouri City, TX | 4.0 | 2.5 | 2489 | $2,650 | $1.06 | 22d | 1 | 1.37mi |
HOA detail
- Monthly dues
- $54 · $648/yr
- Likely covers
- waterpool
Listing history 10 events
-
2026-06-21days on market $319,999 Active 14 DOM
-
2026-06-18days on market $319,999 Active 11 DOM
-
2026-06-18price $319,999 Active 10 DOM
-
2026-06-17days on market $324,999 Active 10 DOM
-
2026-06-16days on market $324,999 Active 9 DOM
-
2026-06-15days on market $324,999 Active 8 DOM
-
2026-06-13days on market $324,999 Active 6 DOM
-
2026-06-09days on market $324,999 Active 2 DOM
-
2026-06-08remarks 693-char remark
-
2026-06-08$324,999 Active 1 DOM
ⓘ Source: listings_history table (triggers on properties + properties_extension) + one-shot
backfill from property_details.listing_events for pre-trigger history.
Tax reassessment forecast TX · Resets to sale price
- Current annual tax
- $6,950 · $579/mo
- Projected year-2 tax
- $6,950 · $579/mo
- Expected delta
- $0/yr ($0/mo · 0.0%)
ⓘ Screening estimate from a state-policy table — verify with the county assessor before closing.
Climate risk First Street
- Flood 1/10 Low FEMA zone X (unshaded) · 0% chance over 30 yrs
- Wildfire 4/10 Moderate
- Heat 9/10 Extreme 7 d/yr ≥110°F today · 24 d/yr by 30 yrs out
- Wind 9/10 Extreme 99% chance of damaging wind over 30 yrs
- Air quality 2/10 Low 2 unhealthy d/yr today · 2 by 30 yrs out
Nearby sold comps map
Loading sold comps map…
Walkable amenities ~0.75 mi
Loading nearby amenities…
Taxation est. · year 1
- Rental income
- $34,960
- − Mortgage interest
- −$17,925
- − Property taxes
- −$6,950
- − Insurance
- −$1,600
- − Repairs & maintenance
- −$2,797
- − Management
- −$2,797
- − HOA
- −$648
- − Depreciation
- −$9,309
- Taxable loss
- −$7,065
- Est. tax savings @ 24.0%
- +$1,696
- After-tax cash flow
- $-21/yr
For passive investors: Depreciation is non-cash, so a rental often shows a tax loss while cash-flowing — sheltering income. Rental losses are passive: they offset passive income freely, and up to $25,000/yr can offset ordinary (W-2) income if you actively participate and your MAGI is under $100k (phasing out to $0 by $150k); unused losses carry forward. On sale, claimed depreciation is recaptured at up to 25%, and gains may owe capital-gains tax (a 1031 exchange can defer both). Figures are a year-1 estimate at your 24.0% rate — not tax advice; consult a CPA.
Schools (NCES district)
- District
- Fort Bend ISD
- NCES district ID
- 4819650
- Math proficiency
- 44% ▼ -15.00%
- Reading proficiency
- 53% ▼ -4.00%
- Median HH income
- $82,360
- Composite
- 44.61/100
- National rank
- #2779
- State rank
- #140 of 826 in TX
Livability — Fresno
- Score
- 62/100
- State rank
- #943
- US rank
- #16815
Category grades
Schools grade is shown separately in the Schools card above.
Census & demographics
- Census place
- Fresno, TX
- County
- Fort Bend County · 836,777 people
- City population
- 26,236
- Metro
- Houston-The Woodlands-Sugar Land, TX
- Population (ZIP)
- 26,236
- Household income
- $94,474
- Rent vs Own
- Severe rent burden
- 360.0
Population outlook (Fort Bend County) Hauer SSP2
- Today (2025)
- 1,004,526 people
- By 2030
- 1,153,104 · +14.8%
- By 2040
- 1,453,718 · +44.7%
- By 2050
- 1,753,781 · +74.6%
- By 2075
- 2,455,772 · +144.5%
- By 2100
- 2,930,528 · +191.7%
Race, ethnicity, and origin ACS 2023
- Neighborhood character
- Diverse neighborhood (Simpson 0.61)
- Race & ethnicity
- Black 51% Hispanic / Latino 34% Two or more races 12% White 8% Asian 2%
- Hispanic origin (detail)
- Mexican 29%
- Common ancestry
- Portuguese 1%
- Foreign-born
- 18% · Canada
- Languages at home
- 67% English-only · Spanish 29% Other Asian/Pacific 1% Other Indo-European 1%
Political lean MEDSL · Fort Bend
- 2024 margin
- Toss-up / Even · D 49.5% · R 47.9% · Other 2.6%
- 2008→2024 swing
- +4.0pp toward D · 2008: -2.4pp · 2024: 1.6pp
- All cycles
- 2024: D+1.6 2020: D+10.6 2016: D+6.6 2012: R+6.8 2008: R+2.4
Not yet ingested
- Civics
- —
Market trends
- HPI YoY
- ▼ -1.98%
- Current HPI
- 231.3921
- Rent YoY
- ▼ -0.95%
- Metro
- Houston-The Woodlands-Sugar Land, TX
- State GDP YoY
- ▲ 3.95%
- F500 in state
- 110
Industry mix (Fortune 500 HQ in TX)
| Industry | F500 HQs | Revenue |
|---|---|---|
| Energy | 16 | $1,198B |
|
||
| Technology | 5 | $198B |
|
||
| Engineering / Construction | 4 | $72B |
|
||
| Energy Services | 3 | $60B |
|
||
| Utilities | 3 | $41B |
|
||
| Healthcare | 2 | $330B |
|
||
Price history
+28.9% since first listed7 events — show timeline
- 2026-06-07 Listed $324,999 HARMLS
- 2018-11-01 Sold (MLS) — HARMLS
- 2018-10-10 Pending — HARMLS
- 2018-09-12 Price Changed $248,990 HARMLS
- 2018-08-15 Price Changed $252,115 HARMLS
- 2018-08-15 Price Changed $250,990 HARMLS
- 2018-06-06 Listed $252,115 HARMLS
Property tax history
+44.2%/yrLatest (2025): $6,950 · -0.5% YoY. Source: county tax records.
Cash-flow waterfall
monthlySold comps — $/sqft
last 12 mo · ≤1 miLoading sold comps…