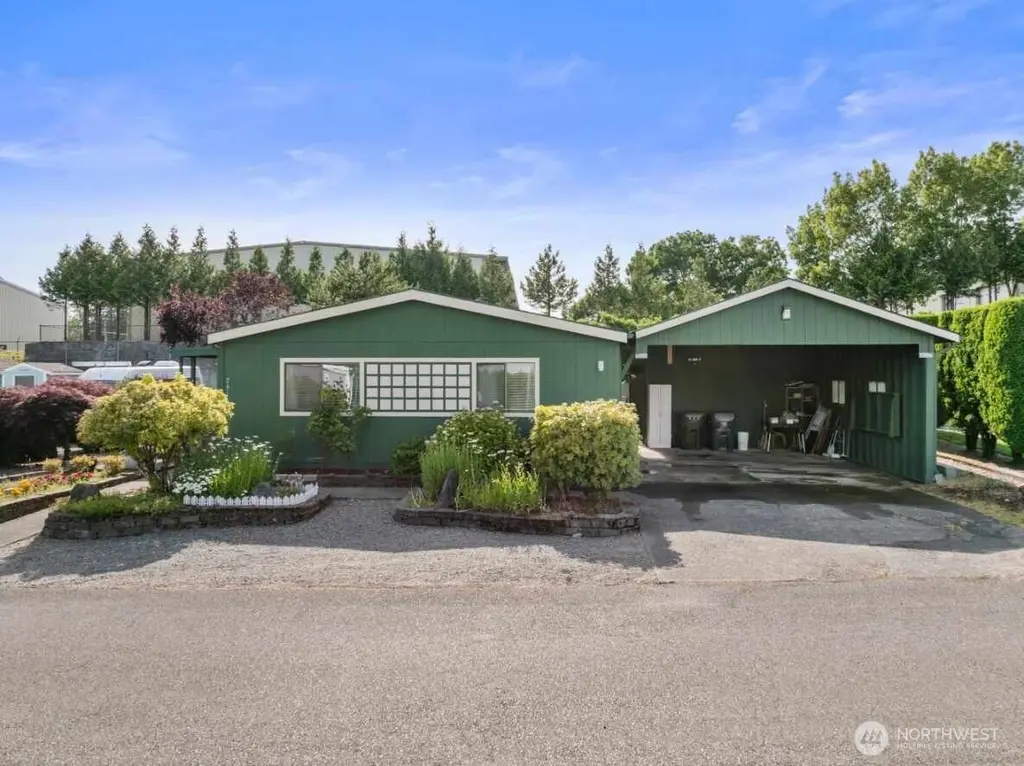
7514 18th Avenue Ct E #12 · Midland, WA
Flood risk 1/10 · Minimal
- FEMA flood zone
- X (unshaded)
- Chance of flooding over 30 yrs
- 0.0%
- Est. flood insurance / yr
- $507 – $1,088
Fire risk 1/10 · Minimal
- Est. fire insurance / yr
- $604 – $1,122
Heat risk 3/10 · Minor
- Hot days now (above 87°F)
- 7 days/yr
- Hot days in 30 yrs
- 15 days/yr
Wind risk 1/10 · Minimal
- Chance of severe wind over 30 yrs
- —
Air-quality risk 7/10 · Major
- Unhealthy air days now
- 10 days/yr
- Unhealthy air days in 30 yrs
- 12 days/yr
Risk factors via First Street. Map © Google.
Why this score? — see what drove the B grade
The composite is a weighted blend of 9 inputs, each scored 0–100. Each bar is that input's sub-score; the figure is the points it added to the 100-point composite (weight × sub-score).
- Cash flow +30.0/30.0
- 1% rule +10.0/10.0
- DSCR +10.0/10.0
- ARV discount +7.5/15.0
- Schools +3.9/10.0
- Livability +3.6/5.0
- Rent growth +2.9/5.0
- Condition / age +2.5/5.0
- Appreciation +0.0/10.0
$135,000
🖨 Deal sheet 📄 Offer letter ✓ Due diligence
Listing remarks
Welcome home to The Maples 55+ Community! This spacious two-bedroom, two-bath residence offers an inviting open living room with vaulted ceilings, abundant natural light, and plenty of space for larger furnishings. The primary suite features its own private bathroom and walk-in closet, while the split-bedroom layout provides comfort and privacy for visiting guests. Step outside to a private backyard ready for gardening, entertaining, or simply unwinding—your own blank canvas. A generous two-car carport connects to an insulated storage area and workshop, perfect for hobbies and projects year-round. Updates involved were floor, interior and exterior paint, Tiles were added to the porch,
Key facts
- Split-bedroom layout
- Private backyard
- Walk-in closet
Tags
Neighborhood map
What this means for you Summary
Snapshot
- This is a 2-bed/2.0-bath manufactured listed at $135k.
Deal economics
- At list price, monthly cash flow is $810 ($10k/yr) — positive.
- The deal already cash-flows at list — no discount required.
- Meets the 1% rule at list price ($2k rent vs $135k).
- Recommended offer: $119k (12.0% below list) — sets the bar for market timing.
- Cap rate 13.5% vs local median 3.2% in Midland — top-decile yield for the area; either an underpriced asset or a hidden risk that comps aren't pricing in. Stress-test before assuming the spread holds.
Location & tenants
- Location reads 72/100 on livability (#208 in WA) — a middle-class / working-renter tenant base. Strengths: housing A+, health & safety A+; Watch: crime D, schools F, amenities F.
- Franklin Pierce School District (suburban): math 35% / reading 51% proficiency, ranked #197 of 291 in WA (top 68%) — families likely to look elsewhere, expect single-tenant / working-renter base with shorter leases.
- Market conditions: Rents rising (+1.6%/yr); 176 active listings in the ZIP; 16 comparable units currently listed for rent nearby; rentals at typical pace (median 24d on market — plan ~3-4 weeks tenant-placement turnaround); solid renter incomes; 3,209 units permitted in Pierce County in 2024 (1,269 in 5+ unit buildings).
- This rent runs 32% of the median local income ($82k/yr) — at the standard rent-burdened threshold; future hikes will face affordability resistance.
Forward outlook
- Local home prices are declining (-3.0%/yr); year-one equity from $933 of loan paydown is wiped out by about $4k of value loss. Plan a longer hold.
- Pierce County population projected at +26% by 2050 — long-run rental-demand tailwind backs the buy-and-hold thesis.
- At projected returns (-3.0% appreciation + 1.6% rent growth), your $38k cash investment doubles in ~5 years — after that, you're playing with house money.
Negotiation context
- It's been on market 122 days — a 12% lower offer ($119k) is reasonable based on typical stale-listing flexibility.
- 3 sale attempts since 18y ago; this cycle's ask has dropped $15k (10%) from the opening price — seller is motivated, your offer sets the floor, not the list.
- Current owner paid $45k; list at $135k implies a 200% gain — meaningful room to come down on a strong offer.
Questions for the listing agent
- It's been on market 122 days. Have you received any prior offers? Is the seller open to a 12% concession, seller financing, or rate buy-down credit?
- Why hasn't it sold? Are there any deal-killer items the seller is aware of (foundation, flood, title, zoning, code violations)?
- Is there a deadline driving the sale (1031 exchange, divorce, estate, relocation)? That informs how much negotiation room exists.
- Schools are F-rated, which usually means shorter tenancies and higher turnover. Who's the typical renter profile here, and what's been the actual vacancy rate?
- Crime grade is D in this area — have there been break-ins, vandalism, or insurance claims at this property in the last 3 years? What carrier currently insures it and at what premium?
- What's the average days-on-market for RENTAL listings here right now (not sales)? A rising rental-DOM trend means longer vacancies and softer asking-rent achievability than the comps imply.
- What's the recent tenant-quality profile in this submarket — average credit score on applications, eviction rate, late-payment / NSF rate, and stable-employment percentage? A property-management company in the area should have these aggregated.
- How much new for-sale + rental construction is in the pipeline within 1–3 miles? Heavy new supply typically softens prices + rents 12–24 months out; constrained supply supports both.
Investment metrics
- 1% rule
- 1.61% ✓
- Cap rate
- 13.50%
- Cash-on-cash
- 25.72%
- DSCR
- 2.14
- GRM
- 5.2
CMA / ARV
- ARV (median comp)
- $418,000
- List price
- $135,000
- Delta
- -67.70%
- Verdict
- UNDERPRICED
- Comps
- 11 within 1.0 mi
Show comp detail 12 sales within ~0.75 mi
| Address | Dist | Beds/Ba | Sqft | Sold | Price | $/sf | Match |
|---|---|---|---|---|---|---|---|
| 7213 17th Ave E #15 | 0.18mi | 3/2.0 (+1) | 1,387 (-1%) | 10mo | $114,000 | $82 | 76 |
| 1822 75th St E #26 | 0.03mi | 3/2.0 (+1) | 1,482 (+6%) | 14mo | $160,000 | $108 | 73 |
| 7907 21st Ave E | 0.28mi | 3/2.0 (+1) | 1,382 (-2%) | 9mo | $435,000 | $315 | 72 |
| 7317 18th Ave E #4 | 0.17mi | 2/2.0 | 1,331 (-5%) | 19mo | $115,000 | $86 | 68 |
| 7605 20th Ave E | 0.14mi | 3/2.0 (+1) | 1,512 (+8%) | 10mo | $479,950 | $317 | 68 |
| 1908 75th St E #30 | 0.10mi | 2/2.0 | 1,274 (-9%) | 17mo | $180,000 | $141 | 65 |
| 1710 73rd Street Ct E | 0.12mi | 3/2.0 (+1) | 1,296 (-8%) | 16mo | $162,500 | $125 | 63 |
| 1906 E 75th St #29 | 0.08mi | 3/2.0 (+1) | 1,590 (+13%) | 10mo | $130,000 | $82 | 60 |
| 2118 77th Street Ct E | 0.24mi | 3/2.0 (+1) | 1,488 (+6%) | 18mo | $360,000 | $242 | 59 |
| 2009 78th Street Ct E | 0.21mi | 3/2.0 (+1) | 1,506 (+7%) | 19mo | $499,888 | $332 | 57 |
| 2111 77th St Ct E | 0.20mi | 3/2.0 (+1) | 1,512 (+8%) | 20mo | $455,000 | $301 | 56 |
| 1909 78th Street Ct E | 0.16mi | 2/2.0 | 1,608 (+14%) | 15mo | $400,000 | $249 | 55 |
Match score weights: distance 35% · size 25% · config 20% · recency 20%. Top-matched comps best support the ARV.
Projected returns pro-forma
-3.0% appreciation · 1.64% rent growth · sell at horizon
- IRR
- 17.8%
- Equity multiple
- 1.71×
- Total profit
- $26,818
- Equity at exit
- $20,129
- IRR
- 25.3%
- Equity multiple
- 3.07×
- Total profit
- $78,168
- Equity at exit
- $11,672
Cash invested: $37,800 (down + closing). Projections, not guarantees.
Landlord ↔ Tenant lean methodology
- Overall (STATE)
- 28 Tenant-Leaning
- State Washington
- 28 Tenant-Leaning · D+8
- County
- — inherits STATE
- City
- — inherits STATE
ZIP-level market 98404
- Rents YoY
- 1.6%
- Active inventory
- 176
- Price-to-rent
- 5.2×
Monthly cashflow live
- Estimated rent
- $2,171 high interval (Pro) →
- Mortgage (P&I)
- −$708
- Tax from tax record
- −$141 /mo · $1,687/yr
- Insurance
- −$56
- HOA
- −$0
- Vacancy / Maint / Mgmt
- −$456
- Net cashflow
- $810
Break-even live
UW: 25.0% down · 7.5% · 30yr · 1.5% tax · 5.0% vac · 8.0% maint · 8.0% mgmt
Financing live
Cash to close
- Down payment
- $33,750
- Closing costs
- $4,050
- Reserves months
- —
- Total cash needed
- —
Loan-product check · same deal, 3 products live
Conventional
25% down · 7.5% · 30yr
- Down + closing
- —
- Monthly P&I
- —
- Monthly cashflow
- —
- DSCR
- —
- Eligible?
- —
Personal DTI + credit; lowest rate.
DSCR
20% down · 8.5% · 30yr
- Down + closing
- —
- Monthly P&I
- —
- Monthly cashflow
- —
- DSCR
- —
- Eligible?
- —
No personal income docs; deal must DSCR.
Hard money
10% down · 12.0% · 12mo
- Down + closing
- —
- Monthly P&I
- —
- Monthly cashflow
- —
- DSCR
- —
- Eligible?
- —
Short-term bridge; refi at stabilization.
Rent comps 16 comps
| Address | Beds | Baths | Sqft | Rent | $/sqft | DOM | Units | Dist |
|---|---|---|---|---|---|---|---|---|
| 1817 80th St E Tacoma, WA | 3.0 | 2.0 | 1188 | $3,200 | $2.69 | 19d | 1 | 0.20mi |
| 10910 22nd Avenue Ct E Unit Jkt Tacoma, WA | 3.0 | 2.0 | 1452 | $2,200 | $1.52 | 24d | 1 | 0.35mi |
| 1402 E 69th St Tacoma, WA | 2.0 | 2.0 | 1000 | $1,795 | $1.79 | 24d | 2 | 0.48mi |
| 2621 80th St E Tacoma, WA | 2.0 | 1.0 | 978 | $2,100 | $2.15 | 4d | 1 | 0.58mi |
| 908 76th Street Ct E Tacoma, WA | 2.0–3.0 | 2.0 | 1065 | $1,699 | $1.60 | 2d | 5 | 0.63mi |
| 901 E 72nd St Tacoma, WA | 1.0–2.0 | 1.0–2.0 | 765 | $1,795 | $2.34 | 23d | 4 | 0.68mi |
| 1928 E 56th St Unit 47 Tacoma, WA | 3.0 | 1.0 | 950 | $1,800 | $1.89 | 24d | 1 | 1.22mi |
| 1706 E 56th St Unit 2 Tacoma, WA | 2.0 | 1.0 | 938 | $1,545 | $1.65 | 24d | 1 | 1.23mi |
| 7603 Pacific Ave Unit 301 Tacoma, WA | 2.0 | 1.0 | 880 | $1,250 | $1.42 | 24d | 1 | 1.31mi |
| 7645 Pacific Ave Tacoma, WA | 2.0 | 1.0 | 932 | $1,650 | $1.77 | 7d | 2 | 1.33mi |
| 7637 Pacific Ave Tacoma, WA | 1.0–2.0 | 1.0–2.0 | 700 | $1,600 | $2.29 | 4d | 6 | 1.35mi |
| 8015 Pacific Ave Unit 20 Tacoma, WA | 2.0 | 1.5 | 1100 | $1,995 | $1.81 | 24d | 1 | 1.36mi |
| 150 S 84th St Unit B Tacoma, WA | 2.0 | 1.0 | 1000 | $1,700 | $1.70 | 2d | 1 | 1.42mi |
| 8445 Pacific Ave Tacoma, WA | 1.0–2.0 | 1.0–2.0 | 715 | $1,975 | $2.76 | 2d | 3 | 1.44mi |
| 7425 S D St Unit 204 Tacoma, WA | 2.0 | 1.0 | 900 | $1,700 | $1.89 | 24d | 1 | 1.47mi |
| 7015 S D St Tacoma, WA | 1.0–2.0 | 1.0–1.5 | 760 | $1,894 | $2.49 | 2d | 9 | 1.50mi |
Listing history 21 events
-
2026-06-18days on market $135,000 Active 122 DOM
-
2026-06-17days on market $135,000 Active 121 DOM
-
2026-06-16days on market $135,000 Active 120 DOM
-
2026-06-15days on market $135,000 Active 119 DOM
-
2026-06-13days on market $135,000 Active 117 DOM
-
2026-06-13days on market $135,000 Active 116 DOM
-
2026-06-09days on market $135,000 Active 113 DOM
-
2026-06-08days on market $135,000 Active 112 DOM
-
2026-06-07days on market $135,000 Active 111 DOM
-
2026-06-04days on market $135,000 Active 108 DOM
-
2026-06-03days on market $135,000 Active 107 DOM
-
2026-06-02days on market $135,000 Active 106 DOM
-
2026-06-01days on market $135,000 Active 105 DOM
-
2026-05-31days on market $135,000 Active 104 DOM
-
2026-05-07price $139,950
-
2026-04-27status Active
-
2026-04-07status Pending
-
2026-01-27$149,888 Active
-
2008-04-23soldstatus $45,000
-
2008-04-18historical
-
2008-03-27$49,950
ⓘ Source: listings_history table (triggers on properties + properties_extension) + one-shot
backfill from property_details.listing_events for pre-trigger history.
Tax reassessment forecast WA · Resets to sale price
- Current annual tax
- $1,687 · $141/mo
- Projected year-2 tax
- $1,687 · $141/mo
- Expected delta
- $0/yr ($0/mo · 0.0%)
ⓘ Screening estimate from a state-policy table — verify with the county assessor before closing.
Climate risk First Street
- Flood 1/10 Low FEMA zone X (unshaded) · 0% chance over 30 yrs
- Wildfire 1/10 Low
- Heat 3/10 Moderate 7 d/yr ≥87°F today · 15 d/yr by 30 yrs out
- Wind 1/10 Low
- Air quality 7/10 Severe 10 unhealthy d/yr today · 12 by 30 yrs out
Nearby sold comps map
Loading sold comps map…
Walkable amenities ~0.75 mi
Loading nearby amenities…
Taxation est. · year 1
- Rental income
- $26,052
- − Mortgage interest
- −$7,562
- − Property taxes
- −$1,687
- − Insurance
- −$675
- − Repairs & maintenance
- −$2,084
- − Management
- −$2,084
- − Depreciation
- −$3,927
- Taxable income
- $8,033
- Est. tax owed @ 24.0%
- −$1,928
- After-tax cash flow
- $7,796/yr
For passive investors: Depreciation is non-cash, so a rental often shows a tax loss while cash-flowing — sheltering income. Rental losses are passive: they offset passive income freely, and up to $25,000/yr can offset ordinary (W-2) income if you actively participate and your MAGI is under $100k (phasing out to $0 by $150k); unused losses carry forward. On sale, claimed depreciation is recaptured at up to 25%, and gains may owe capital-gains tax (a 1031 exchange can defer both). Figures are a year-1 estimate at your 24.0% rate — not tax advice; consult a CPA.
Schools (NCES district)
- District
- Franklin Pierce School District
- NCES district ID
- 5302940
- Math proficiency
- 35% ▬ 0.00%
- Reading proficiency
- 51% ▲ 2.00%
- Median HH income
- $49,240
- Composite
- 39.18/100
- National rank
- #8227
- State rank
- #197 of 291 in WA
Livability — Midland
- Score
- 72/100
- State rank
- #208
- US rank
- #5731
Category grades
Schools grade is shown separately in the Schools card above.
Census & demographics
- Census place
- Midland, WA
- County
- Pierce County · 788,257 people
- Metro
- Seattle-Tacoma-Bellevue, WA
- Population (ZIP)
- 35,961
- Household income
- $82,191
- Rent vs Own
- Severe rent burden
- 989.0
Population outlook (Pierce County) Hauer SSP2
- Today (2025)
- 956,648 people
- By 2030
- 1,010,862 · +5.7%
- By 2040
- 1,113,170 · +16.4%
- By 2050
- 1,206,524 · +26.1%
- By 2075
- 1,436,425 · +50.2%
- By 2100
- 1,563,654 · +63.5%
Race, ethnicity, and origin ACS 2023
- Neighborhood character
- Highly diverse neighborhood (Simpson 0.77)
- Race & ethnicity
- White 38% Hispanic / Latino 20% Asian 17% Two or more races 16% Black 11% Native American 3% Pacific Islander 1%
- Hispanic origin (detail)
- Mexican 16% Puerto Rican 1%
- Common ancestry
- Italian 3% Portuguese 2% Slovak 1%
- Foreign-born
- 20% · Canada, Vietnam, South Korea
- Languages at home
- 68% English-only · Spanish 13% Other Asian/Pacific 7% Vietnamese 4%
Political lean MEDSL · Pierce
- 2024 margin
- D (+10.8) · D 53.9% · R 43.1% · Other 3.0%
- 2008→2024 swing
- -1.4pp toward R · 2008: 12.2pp · 2024: 10.8pp
- All cycles
- 2024: D+10.8 2020: D+11.2 2016: D+7.5 2012: D+11.0 2008: D+12.2
Not yet ingested
- Civics
- —
Market trends
- HPI YoY
- ▼ -462.09%
- Current HPI
- 360.0843
- Rent YoY
- ▲ 1.64%
- Metro
- Seattle-Tacoma-Bellevue, WA
- State GDP YoY
- ▲ 4.65%
- F500 in state
- 22
Industry mix (Fortune 500 HQ in WA)
| Industry | F500 HQs | Revenue |
|---|---|---|
| Retail | 2 | $269B |
|
||
| Technology / Retail | 1 | $638B |
|
||
| Technology | 1 | $245B |
|
||
| Telecommunications | 1 | $38B |
|
||
| Food / Beverage | 1 | $36B |
|
||
| Automotive / Trucks | 1 | $34B |
|
||
Price history
+180.2% since first listed7 events — show timeline
- 2026-05-07 Price Changed $139,950 NWMLS as Distributed by MLS Grid
- 2026-04-27 Relisted — NWMLS as Distributed by MLS Grid
- 2026-04-07 Pending — NWMLS as Distributed by MLS Grid
- 2026-01-27 Listed $149,888 NWMLS as Distributed by MLS Grid
- 2008-04-23 Sold (MLS) $45,000 NWMLS as Distributed by MLS Grid
- 2008-04-18 Delisted — NWMLS as Distributed by MLS Grid
- 2008-03-27 Listed $49,950 NWMLS as Distributed by MLS Grid
Property tax history
+7.1%/yrLatest (2026): $1,687 · +12.9% YoY. Source: county tax records.
Cash-flow waterfall
monthlySold comps — $/sqft
last 12 mo · ≤1 miLoading sold comps…