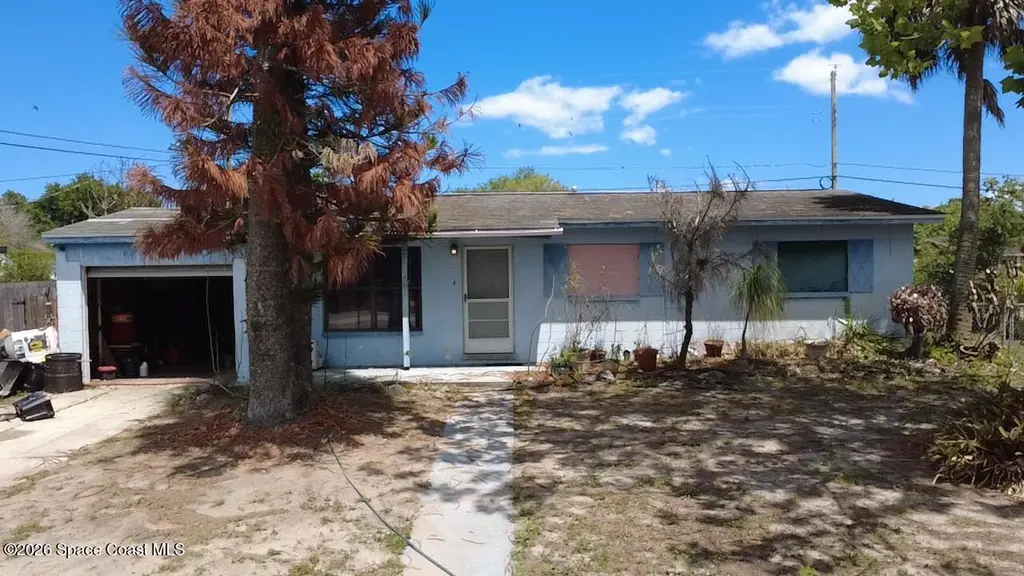
65 Sky Ln · Titusville, FL
Flood risk 1/10 · Minimal
- FEMA flood zone
- X (unshaded)
- Chance of flooding over 30 yrs
- 0.0%
- Est. flood insurance / yr
- $507 – $1,088
Fire risk 7/10 · Major
- Est. fire insurance / yr
- $947 – $1,759
Heat risk 10/10 · Severe
- Hot days now (above 108°F)
- 7 days/yr
- Hot days in 30 yrs
- 22 days/yr
Wind risk 10/10 · Severe
- Chance of severe wind over 30 yrs
- 99.0%
Air-quality risk 2/10 · Minimal
- Unhealthy air days now
- 0 days/yr
- Unhealthy air days in 30 yrs
- 1 days/yr
Risk factors via First Street. Map © Google.
Why this score? — see what drove the C+ grade
The composite is a weighted blend of 9 inputs, each scored 0–100. Each bar is that input's sub-score; the figure is the points it added to the 100-point composite (weight × sub-score).
- Cash flow +25.6/30.0
- DSCR +8.5/10.0
- ARV discount +7.5/15.0
- 1% rule +5.5/10.0
- Schools +4.7/10.0
- Livability +4.2/5.0
- Rent growth +2.6/5.0
- Condition / age +2.5/5.0
- Appreciation +0.0/10.0
$179,999
🖨 Deal sheet 📄 Offer letter ✓ Due diligence
Listing remarks
This property is ready for its next chapter! This home is the perfect opportunity for investors, renovators, or buyers looking to create their dream home. While the property does need significant updating and repairs, the possibilities are undeniable. Situated on a desirable lot in a great location, this is your chance to bring your vision and transform this home into something truly special.
Key facts
- 7,841 sq ft lot
- Garage
- Pool
Property features AI
Exterior
- Parking: Garage (1 car)
- Utilities: Public sewer; Electricity available
- Home design: Single family residence; One story; Faces west
- Construction: Block and frame construction; Shingle roof
- Exterior features: In-ground private pool; Back yard with chain link and wood fencing; Asphalt road access; Corner lot
Interior
- Kitchen: Electric oven and range; Refrigerator
- Bedrooms: 3 bedrooms (all on the first level)
- Flooring: Terrazzo
- Bathrooms: 1 full bathroom
- Heating & cooling: Electric heating; Central air; Wall/window unit(s)
- Interior features: Ceiling fans; Wood-burning fireplace; 6 total rooms
- Laundry & utility: Washer and dryer; Electric water heater
Neighborhood map
What this means for you Summary
Snapshot
- This is a 3-bed/1.0-bath single-family listed at $180k.
Deal economics
- At list price, monthly cash flow is $424 ($5k/yr) — positive.
- The deal already cash-flows at list — no discount required.
- Meets the 1% rule at list price ($2k rent vs $180k).
- Recommended offer: $177k (1.5% below list) — sets the bar for market timing.
Location & tenants
- Location reads 84/100 on livability (#42 in FL, #668 nationally) — a professional / high-income tenant draw. Strengths: commute A+, cost of living A+, housing A+; Watch: crime D, employment D.
- Brevard (suburban): math 53% / reading 57% proficiency, ranked #19 of 73 in FL (top 26%) — acceptable for families but not a draw, mixed tenant base, ~2y average lease.
- Zoned schools: Oak Park Elementary School (math 36% / reading 37%, grade F, #1,656 of 2,144 statewide, top 78%, 501 students, 74% FRL); James Madison Middle School (math 39% / reading 39%, grade F, #381 of 571 statewide, top 67%, 446 students, 65% FRL); Astronaut High School (math 25% / reading 43%, grade F, #394 of 667 statewide, top 60%, 1,112 students, 51% FRL) — zoned schools average 63% FRL vs 43% district-wide (21 pts higher); higher-poverty schools than district average — tighter screening recommended.
- Zoned-school proficiency averages 36% at this address vs 55% district-wide (-18 pts) — the specific schools serving this property underperform the Brevard average; the district grade overstates school quality for this exact location.
- Market conditions: Rents flat; 256 active listings in the ZIP; 3 comparable units currently listed for rent nearby; rentals at typical pace (median 24d on market — plan ~3-4 weeks tenant-placement turnaround); 4,602 units permitted in Brevard County in 2024 (702 in 5+ unit buildings).
- This rent runs 34% of the median local income ($67k/yr) — at the standard rent-burdened threshold; future hikes will face affordability resistance.
Forward outlook
- Local home prices are declining (-3.0%/yr); year-one equity from $1k of loan paydown is wiped out by about $5k of value loss. Plan a longer hold.
- Brevard County population projected at +15% by 2050 — modest demand growth; plan on rents tracking national, not racing it.
Negotiation context
- It's been on market 17 days — a 2% lower offer ($177k) is reasonable based on typical stale-listing flexibility.
- Current owner paid $49k; list at $180k implies a 267% gain — meaningful room to come down on a strong offer.
Risks & watch-outs
- Watch-outs: built in 1957 — expect roof / HVAC / electrical / plumbing capex.
- Climate carrying-cost: severe wind risk, 99% chance of damaging wind over 30y; major wildfire risk; extreme-heat days projected 7→22/yr by 2055 (HVAC capex compounding) — expect insurance premiums to compound above CPI over the hold.
Questions for the listing agent
- Built in 1957 — when were the roof, HVAC, electrical panel, plumbing, and water heater last replaced?
- Is there a deadline driving the sale (1031 exchange, divorce, estate, relocation)? That informs how much negotiation room exists.
- Crime grade is D in this area — have there been break-ins, vandalism, or insurance claims at this property in the last 3 years? What carrier currently insures it and at what premium?
- What's the average days-on-market for RENTAL listings here right now (not sales)? A rising rental-DOM trend means longer vacancies and softer asking-rent achievability than the comps imply.
- What's the recent tenant-quality profile in this submarket — average credit score on applications, eviction rate, late-payment / NSF rate, and stable-employment percentage? A property-management company in the area should have these aggregated.
- How much new for-sale + rental construction is in the pipeline within 1–3 miles? Heavy new supply typically softens prices + rents 12–24 months out; constrained supply supports both.
Investment metrics
- 1% rule
- 1.05% ✓
- Cap rate
- 9.12%
- Cash-on-cash
- 10.09%
- DSCR
- 1.45
- GRM
- 7.9
CMA / ARV
No comps found within radius.
Projected returns pro-forma
-3.0% appreciation · 0.59% rent growth · sell at horizon
- IRR
- -3.7%
- Equity multiple
- 0.87×
- Total profit
- $-6,747
- Equity at exit
- $26,838
- IRR
- 3.4%
- Equity multiple
- 1.22×
- Total profit
- $11,031
- Equity at exit
- $15,563
Cash invested: $50,400 (down + closing). Projections, not guarantees.
Landlord ↔ Tenant lean methodology
- Overall (STATE)
- 87 Strongly Landlord-Friendly
- State Florida
- 87 Strongly Landlord-Friendly · R+3
- County
- — inherits STATE
- City
- — inherits STATE
ZIP-level market 32796
- Rents YoY
- 0.6%
- Active inventory
- 256
- Price-to-rent
- 7.9×
Monthly cashflow live
- Estimated rent
- $1,892 medium interval (Pro) →
- Mortgage (P&I)
- −$944
- Tax from tax record
- −$52 /mo · $627/yr
- Insurance
- −$75
- HOA
- −$0
- Vacancy / Maint / Mgmt
- −$397
- Net cashflow
- $424
Break-even live
UW: 25.0% down · 7.5% · 30yr · 1.5% tax · 5.0% vac · 8.0% maint · 8.0% mgmt
Financing live
Cash to close
- Down payment
- $45,000
- Closing costs
- $5,400
- Reserves months
- —
- Total cash needed
- —
Loan-product check · same deal, 3 products live
Conventional
25% down · 7.5% · 30yr
- Down + closing
- —
- Monthly P&I
- —
- Monthly cashflow
- —
- DSCR
- —
- Eligible?
- —
Personal DTI + credit; lowest rate.
DSCR
20% down · 8.5% · 30yr
- Down + closing
- —
- Monthly P&I
- —
- Monthly cashflow
- —
- DSCR
- —
- Eligible?
- —
No personal income docs; deal must DSCR.
Hard money
10% down · 12.0% · 12mo
- Down + closing
- —
- Monthly P&I
- —
- Monthly cashflow
- —
- DSCR
- —
- Eligible?
- —
Short-term bridge; refi at stabilization.
Rent comps 3 comps
| Address | Beds | Baths | Sqft | Rent | $/sqft | DOM | Units | Dist |
|---|---|---|---|---|---|---|---|---|
| 3960 Barcelona St Titusville, FL | 3.0 | 1.0 | 1040 | $1,800 | $1.73 | 23d | 1 | 0.17mi |
| 955 N Carpenter Rd Titusville, FL | 3.0 | 1.0 | 816 | $1,550 | $1.90 | 21d | 1 | 0.84mi |
| 583 Gardenia Cir Titusville, FL | 3.0 | 2.0 | 1120 | $1,800 | $1.61 | 23d | 1 | 1.13mi |
Listing history 12 events
-
2026-06-07statusdays on market $179,999 Pending 17 DOM
-
2026-06-05days on market $179,999 Active 16 DOM
-
2026-06-03days on market $179,999 Active 15 DOM
-
2026-06-02days on market $179,999 Active 14 DOM
-
2026-06-01days on market $179,999 Active 13 DOM
-
2026-05-31days on market $179,999 Active 12 DOM
-
2026-05-31days on market $179,999 Active 11 DOM
-
2026-05-24status Pending
-
2026-05-14$179,999 Active
-
1990-10-30soldstatus $49,000
-
1984-04-01soldstatus $43,500
-
1983-08-01soldstatus $32,000
ⓘ Source: listings_history table (triggers on properties + properties_extension) + one-shot
backfill from property_details.listing_events for pre-trigger history.
Tax reassessment forecast FL · Resets to sale price
- Current annual tax
- $627 · $52/mo
- Projected year-2 tax
- $1,494 · $124/mo
- Expected delta
- +$867/yr (+$72/mo · 138.4%)
ⓘ Screening estimate from a state-policy table — verify with the county assessor before closing.
Climate risk First Street
- Flood 1/10 Low FEMA zone X (unshaded) · 0% chance over 30 yrs
- Wildfire 7/10 Severe
- Heat 10/10 Extreme 7 d/yr ≥108°F today · 22 d/yr by 30 yrs out
- Wind 10/10 Extreme 99% chance of damaging wind over 30 yrs
- Air quality 2/10 Low 0 unhealthy d/yr today · 1 by 30 yrs out
Nearby sold comps map
Loading sold comps map…
Walkable amenities ~0.75 mi
Loading nearby amenities…
Taxation est. · year 1
- Rental income
- $22,705
- − Mortgage interest
- −$10,083
- − Property taxes
- −$627
- − Insurance
- −$900
- − Repairs & maintenance
- −$1,816
- − Management
- −$1,816
- − Depreciation
- −$5,236
- Taxable income
- $2,227
- Est. tax owed @ 24.0%
- −$534
- After-tax cash flow
- $4,549/yr
For passive investors: Depreciation is non-cash, so a rental often shows a tax loss while cash-flowing — sheltering income. Rental losses are passive: they offset passive income freely, and up to $25,000/yr can offset ordinary (W-2) income if you actively participate and your MAGI is under $100k (phasing out to $0 by $150k); unused losses carry forward. On sale, claimed depreciation is recaptured at up to 25%, and gains may owe capital-gains tax (a 1031 exchange can defer both). Figures are a year-1 estimate at your 24.0% rate — not tax advice; consult a CPA.
Schools (NCES district)
- District
- Brevard
- NCES district ID
- 1200150
- Math proficiency
- 53% ▼ -9.00%
- Reading proficiency
- 57% ▼ -4.00%
- Median HH income
- $49,426
- Composite
- 46.86/100
- National rank
- #2370
- State rank
- #19 of 73 in FL
Livability — Titusville
- Score
- 84/100
- State rank
- #42
- US rank
- #668
Category grades
Schools grade is shown separately in the Schools card above.
Census & demographics
- Census place
- Titusville, FL
- County
- Brevard County · 602,871 people
- City population
- 60,286
- Metro
- Palm Bay-Melbourne-Titusville, FL
- Population (ZIP)
- 20,222
- Household income
- $67,491
- Rent vs Own
- Severe rent burden
- 403.0
Population outlook (Brevard County) Hauer SSP2
- Today (2025)
- 623,254 people
- By 2030
- 648,420 · +4.0%
- By 2040
- 690,009 · +10.7%
- By 2050
- 715,669 · +14.8%
- By 2075
- 775,744 · +24.5%
- By 2100
- 776,687 · +24.6%
Race, ethnicity, and origin ACS 2023
- Neighborhood character
- Predominantly White (81%)
- Race & ethnicity
- White 81% Black 8% Hispanic / Latino 6% Two or more races 4%
- Hispanic origin (detail)
- Puerto Rican 3%
- Common ancestry
- Romanian 3% Italian 3% Slovak 2%
- Foreign-born
- 3% · Canada
- Languages at home
- 94% English-only · Spanish 5%
Political lean MEDSL · Brevard
- 2024 margin
- Strong R (+20.8) · D 39.1% · R 59.9% · Other 1.0%
- 2008→2024 swing
- -10.4pp toward R · 2008: -10.4pp · 2024: -20.8pp
- All cycles
- 2024: R+20.8 2020: R+16.4 2016: R+19.8 2012: R+12.7 2008: R+10.4
Not yet ingested
- Civics
- —
Market trends
- HPI YoY
- ▼ -172.25%
- Current HPI
- 303.5534
- Rent YoY
- ▲ 0.59%
- Metro
- Palm Bay-Melbourne-Titusville, FL
- State GDP YoY
- ▲ 3.28%
- F500 in state
- 36
Industry mix (Fortune 500 HQ in FL)
| Industry | F500 HQs | Revenue |
|---|---|---|
| Industrial Technology | 2 | $29B |
|
||
| Insurance | 2 | $17B |
|
||
| Retail | 1 | $60B |
|
||
| Technology Distribution | 1 | $58B |
|
||
| Homebuilding | 1 | $35B |
|
||
| Technology Manufacturing | 1 | $35B |
|
||
Price history
+462.5% since first listed5 events — show timeline
- 2026-05-24 Pending — SCMLS
- 2026-05-14 Listed $179,999 SCMLS
- 1990-10-30 Sold (Public Records) $49,000 Public Records
- 1984-04-01 Sold (Public Records) $43,500 Public Records
- 1983-08-01 Sold (Public Records) $32,000 Public Records
Property tax history
+2.0%/yrLatest (2025): $627 · +1.5% YoY. Source: county tax records.
Cash-flow waterfall
monthlySold comps — $/sqft
last 12 mo · ≤1 miLoading sold comps…