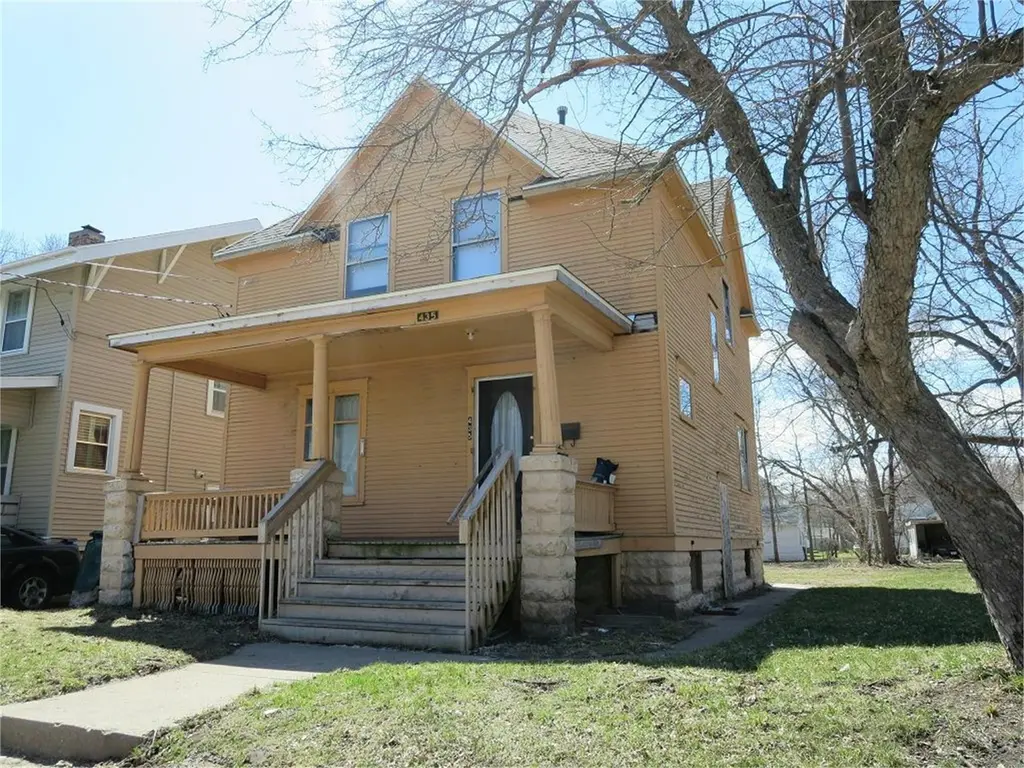
435 Conger St St · Waterloo, IA
Flood risk 1/10 · Minimal
- FEMA flood zone
- X
- Chance of flooding over 30 yrs
- 0.0%
- Est. flood insurance / yr
- $473 – $860
Fire risk 1/10 · Minimal
- Est. fire insurance / yr
- $902 – $1,676
Heat risk 3/10 · Minor
- Hot days now (above 101°F)
- 7 days/yr
- Hot days in 30 yrs
- 16 days/yr
Wind risk 2/10 · Minimal
- Chance of severe wind over 30 yrs
- —
Air-quality risk 1/10 · Minimal
- Unhealthy air days now
- 0 days/yr
- Unhealthy air days in 30 yrs
- 0 days/yr
Risk factors via First Street. Map © Google.
Why this score? — see what drove the B+ grade
The composite is a weighted blend of 9 inputs, each scored 0–100. Each bar is that input's sub-score; the figure is the points it added to the 100-point composite (weight × sub-score).
- Cash flow +30.0/30.0
- ARV discount +12.9/15.0
- 1% rule +10.0/10.0
- DSCR +10.0/10.0
- Schools +4.4/10.0
- Rent growth +4.2/5.0
- Livability +4.0/5.0
- Condition / age +2.5/5.0
- Appreciation +0.0/10.0
$55,000
🖨 Deal sheet 📄 Offer letter ✓ Due diligence
Listing remarks MLS
This 3-bedroom, 1-bath home offers a great opportunity for investors or buyers ready to add their personal touch. Previously used as a rental and currently vacant, the property is ready for improvements and updates. This home has solid potential for renovation, rental income, or a future resale. Convenient layout with room to build equity, this property is being priced to reflect the work needed. Ideal for those seeking a project.
Key facts
- 5,480 sq ft lot
- Parking
- Built 1909
Neighborhood map
What this means for you Summary
Snapshot
- This is a 3-bed/1.0-bath single-family listed at $55k.
Deal economics
- At list price, monthly cash flow is $485 ($6k/yr) — positive.
- The deal already cash-flows at list — no discount required.
- Meets the 1% rule at list price ($1k rent vs $55k).
- Recommended offer: $48k (12.0% below list) — sets the bar for market timing.
- Cap rate 16.9% vs local median 4.2% in Waterloo — top-decile yield for the area; either an underpriced asset or a hidden risk that comps aren't pricing in. Stress-test before assuming the spread holds.
Location & tenants
- Location reads 81/100 on livability (#74 in IA, #1,589 nationally) — a professional / high-income tenant draw. Strengths: commute A+, cost of living A+, housing A+; Watch: schools C-, crime F, employment D-.
- Waterloo Community School District (urban): math 50% / reading 54% proficiency, ranked #276 of 289 in IA (top 96%) — acceptable for families but not a draw, mixed tenant base, ~2y average lease.
- Market conditions: Rents rising fast (+6.7%/yr); 98 active listings in the ZIP; 24 comparable units currently listed for rent nearby; rentals lingering (median 44d on market — plan ~5-8 weeks vacancy on turnover, expect pricing pressure); 54% of comp listings sitting > 30 days — soft ceiling on asking rent; 287 units permitted in Black Hawk County in 2024 (67 in 5+ unit buildings).
Forward outlook
- Local home prices are declining (-3.0%/yr); year-one equity from $380 of loan paydown is wiped out by about $2k of value loss. Plan a longer hold.
- Black Hawk County population projected at +10% by 2050 — modest demand growth; plan on rents tracking national, not racing it.
- At projected returns (-3.0% appreciation + 6.7% rent growth), your $15k cash investment doubles in ~3 years — after that, you're playing with house money.
Negotiation context
- It's been on market 135 days — a 12% lower offer ($48k) is reasonable based on typical stale-listing flexibility.
Risks & watch-outs
- Watch-outs: built in 1909 — expect roof / HVAC / electrical / plumbing capex.
Questions for the listing agent
- It's been on market 135 days. Have you received any prior offers? Is the seller open to a 12% concession, seller financing, or rate buy-down credit?
- Built in 1909 — when were the roof, HVAC, electrical panel, plumbing, and water heater last replaced?
- Why hasn't it sold? Are there any deal-killer items the seller is aware of (foundation, flood, title, zoning, code violations)?
- Is there a deadline driving the sale (1031 exchange, divorce, estate, relocation)? That informs how much negotiation room exists.
- Crime grade is F in this area — have there been break-ins, vandalism, or insurance claims at this property in the last 3 years? What carrier currently insures it and at what premium?
- What's the average days-on-market for RENTAL listings here right now (not sales)? A rising rental-DOM trend means longer vacancies and softer asking-rent achievability than the comps imply.
- What's the recent tenant-quality profile in this submarket — average credit score on applications, eviction rate, late-payment / NSF rate, and stable-employment percentage? A property-management company in the area should have these aggregated.
- How much new for-sale + rental construction is in the pipeline within 1–3 miles? Heavy new supply typically softens prices + rents 12–24 months out; constrained supply supports both.
Investment metrics
- 1% rule
- 1.99% ✓
- Cap rate
- 16.88%
- Cash-on-cash
- 37.81%
- DSCR
- 2.68
- GRM
- 4.2
CMA / ARV
- ARV (median comp)
- $62,434
- List price
- $55,000
- Delta
- -11.91%
- Verdict
- UNDERPRICED
- Comps
- 20 within 1.0 mi
Show comp detail 12 sales within ~0.75 mi
| Address | Dist | Beds/Ba | Sqft | Sold | Price | $/sf | Match |
|---|---|---|---|---|---|---|---|
| 221 Center St | 0.18mi | 3/1.0 | 1,291 (+2%) | 6mo | $38,000 | $29 | 84 |
| 413 Conger Street St | 0.04mi | 3/1.0 | 1,149 (-10%) | 4mo | $65,000 | $57 | 79 |
| 914 Lincoln St | 0.22mi | 3/1.0 | 1,380 (+9%) | 3mo | $29,000 | $21 | 72 |
| 708 Newton St St | 0.44mi | 4/1.0 (+1) | 1,285 (+1%) | 7mo | $71,500 | $56 | 67 |
| 817 Grandview Ave | 0.35mi | 3/1.0 | 1,115 (-12%) | 3mo | $115,000 | $103 | 60 |
| 806 Conger St St | 0.46mi | 3/1.0 | 1,140 (-10%) | 2mo | $85,000 | $75 | 60 |
| 126 Hope Avenue Ave | 0.55mi | 3/1.0 | 1,185 (-7%) | 6mo | $56,000 | $47 | 58 |
| 813 Kern St | 0.51mi | 4/1.0 (+1) | 1,183 (-7%) | 4mo | $165,000 | $139 | 57 |
| 545 W Parker St St | 0.35mi | 3/1.0 | 1,090 (-14%) | 7mo | $71,500 | $66 | 54 |
| 411 Argyle St St | 0.60mi | 4/2.0 (+1) | 1,360 (+7%) | 8mo | $104,000 | $76 | 45 |
| 236 Boston Ave | 0.74mi | 3/1.0 | 1,403 (+10%) | 10mo | $75,000 | $53 | 40 |
| 233 Quincy St | 0.65mi | 2/0.5 (-1) | 1,454 (+14%) | 6mo | $98,750 | $68 | 34 |
Match score weights: distance 35% · size 25% · config 20% · recency 20%. Top-matched comps best support the ARV.
Projected returns pro-forma
-3.0% appreciation · 6.67% rent growth · sell at horizon
- IRR
- 38.0%
- Equity multiple
- 2.70×
- Total profit
- $26,207
- Equity at exit
- $8,201
- IRR
- 46.3%
- Equity multiple
- 6.28×
- Total profit
- $81,250
- Equity at exit
- $4,755
Cash invested: $15,400 (down + closing). Projections, not guarantees.
Landlord ↔ Tenant lean methodology
- Overall (STATE)
- 83 Strongly Landlord-Friendly
- State Iowa
- 83 Strongly Landlord-Friendly · R+6
- County
- — inherits STATE
- City
- — inherits STATE
ZIP-level market 50703
- Rents YoY
- 6.7%
- Active inventory
- 98
- Price-to-rent
- 4.2×
Monthly cashflow live
- Estimated rent
- $1,096 high interval (Pro) →
- Mortgage (P&I)
- −$288
- Tax from tax record
- −$69 /mo · $826/yr
- Insurance
- −$23
- HOA
- −$0
- Vacancy / Maint / Mgmt
- −$230
- Net cashflow
- $485
Break-even live
UW: 25.0% down · 7.5% · 30yr · 1.5% tax · 5.0% vac · 8.0% maint · 8.0% mgmt
Financing live
Cash to close
- Down payment
- $13,750
- Closing costs
- $1,650
- Reserves months
- —
- Total cash needed
- —
Loan-product check · same deal, 3 products live
Conventional
25% down · 7.5% · 30yr
- Down + closing
- —
- Monthly P&I
- —
- Monthly cashflow
- —
- DSCR
- —
- Eligible?
- —
Personal DTI + credit; lowest rate.
DSCR
20% down · 8.5% · 30yr
- Down + closing
- —
- Monthly P&I
- —
- Monthly cashflow
- —
- DSCR
- —
- Eligible?
- —
No personal income docs; deal must DSCR.
Hard money
10% down · 12.0% · 12mo
- Down + closing
- —
- Monthly P&I
- —
- Monthly cashflow
- —
- DSCR
- —
- Eligible?
- —
Short-term bridge; refi at stabilization.
Rent comps 24 comps
| Address | Beds | Baths | Sqft | Rent | $/sqft | DOM | Units | Dist |
|---|---|---|---|---|---|---|---|---|
| 214 Edwards St Waterloo, IA | 3.0 | 1.0 | 1150 | $825 | $0.72 | 21d | 1 | 0.22mi |
| 203 Reed St Waterloo, IA | 3.0 | 1.5 | 1492 | $1,200 | $0.80 | 21d | 1 | 0.23mi |
| 824 Logan Ave Waterloo, IA | 4.0 | 2.0 | 1572 | $1,425 | $0.91 | 21d | 1 | 0.33mi |
| 1125 Ackermant St Waterloo, IA | 3.0 | 2.0 | 1202 | $1,100 | $0.92 | 21d | 1 | 0.38mi |
| 440 Cutler St Waterloo, IA | 3.0 | 1.5 | 1566 | $1,200 | $0.77 | 21d | 1 | 0.49mi |
| 306 Charles St Waterloo, IA | 3.0 | 1.0 | 916 | $925 | $1.01 | 43d | 1 | 0.76mi |
| 401 Charles St Waterloo, IA | 3.0 | 1.0 | 1276 | $995 | $0.78 | 43d | 1 | 0.83mi |
| 311 E 3rd St Waterloo, IA | 2.0 | 2.0 | 1154 | $1,500 | $1.30 | 21d | 1 | 0.84mi |
| 45 W Jefferson St Waterloo, IA | 1.0–2.0 | 1.0–2.0 | 1062 | $1,750 | $1.65 | 21d | 9 | 0.95mi |
| 405 W Donald St Waterloo, IA | 2.0–3.0 | 1.0 | 880 | $1,000 | $1.14 | 21d | 4 | 1.00mi |
| W Mullan Ave Waterloo, IA | 2.0 | 1.0 | 918 | $710 | $0.77 | 43d | 2 | 1.11mi |
| 739 Sherman Ave Waterloo, IA | 3.0 | 1.0 | 875 | $925 | $1.06 | 43d | 1 | 1.11mi |
| 910 Mulberry St Apt 3 Waterloo, IA | 2.0 | 1.0 | 1064 | $695 | $0.65 | 21d | 1 | 1.22mi |
| 223 W 4th St Ste 203 Waterloo, IA | 2.0 | 1.5 | 1466 | $1,250 | $0.85 | 43d | 1 | 1.23mi |
| 824 Sycamore St Unit 824-09 Waterloo, IA | 2.0 | 2.0 | 1054 | $1,250 | $1.19 | 43d | 1 | 1.24mi |
| 920-928 Sycamore St Unit 920-07 Waterloo, IA | 2.0 | 2.0 | 1054 | $1,250 | $1.19 | 43d | 1 | 1.29mi |
| 924 Sycamore St #1 Waterloo, IA | 2.0 | 2.0 | 1054 | $1,250 | $1.19 | 43d | 1 | 1.30mi |
| 919 Oneida St Waterloo, IA | 3.0 | 1.0 | 1144 | $930 | $0.81 | 43d | 1 | 1.31mi |
| 1107 Mulberry St Waterloo, IA | 3.0 | 1.0 | 1248 | $950 | $0.76 | 21d | 1 | 1.35mi |
| 416 Sunnyside Ave Waterloo, IA | 3.0 | 1.0 | 1200 | $825 | $0.69 | 43d | 1 | 1.36mi |
| 418 Sunnyside Ave Waterloo, IA | 3.0 | 1.0 | 1200 | $675 | $0.56 | 43d | 1 | 1.36mi |
| 216 Courtland St Apt 1 Waterloo, IA | 4.0 | 1.0 | 1150 | $825 | $0.72 | 21d | 1 | 1.38mi |
| 820 W 2nd St Apt 2 Waterloo, IA | 2.0 | 1.5 | 1100 | $695 | $0.63 | 43d | 1 | 1.41mi |
| 136 Janney Ave Waterloo, IA | 2.0 | 2.0 | 901 | $1,325 | $1.47 | 43d | 1 | 1.48mi |
Listing history 18 events
-
2026-06-19days on market $55,000 Active 135 DOM
-
2026-06-18days on market $55,000 Active 134 DOM
-
2026-06-17days on market $55,000 Active 133 DOM
-
2026-06-16days on market $55,000 Active 132 DOM
-
2026-06-15days on market $55,000 Active 131 DOM
-
2026-06-14days on market $55,000 Active 129 DOM
-
2026-06-13days on market $55,000 Active 128 DOM
-
2026-06-10days on market $55,000 Active 126 DOM
-
2026-06-09days on market $55,000 Active 125 DOM
-
2026-06-08days on market $55,000 Active 124 DOM
-
2026-06-07days on market $55,000 Active 123 DOM
-
2026-06-05days on market $55,000 Active 120 DOM
-
2026-06-03days on market $55,000 Active 119 DOM
-
2026-06-02days on market $55,000 Active 118 DOM
-
2026-06-01days on market $55,000 Active 117 DOM
-
2026-05-31days on market $55,000 Active 116 DOM
-
2026-05-30days on market $55,000 Active 115 DOM
-
2026-02-04$55,000 Active 434-char remark
Show marketing remark (434 chars)
This 3-bedroom, 1-bath home offers a great opportunity for investors or buyers ready to add their personal touch. Previously used as a rental and currently vacant, the property is ready for improvements and updates. This home has solid potential for renovation, rental income, or a future resale. Convenient layout with room to build equity, this property is being priced to reflect the work needed. Ideal for those seeking a project.
ⓘ Source: listings_history table (triggers on properties + properties_extension) + one-shot
backfill from property_details.listing_events for pre-trigger history.
Tax reassessment forecast IA · Partial reset (capped growth)
- Current annual tax
- $826 · $69/mo
- Projected year-2 tax
- $845 · $70/mo
- Expected delta
- +$19/yr (+$2/mo · 2.3%)
ⓘ Screening estimate from a state-policy table — verify with the county assessor before closing.
Climate risk First Street
- Flood 1/10 Low FEMA zone X · 0% chance over 30 yrs
- Wildfire 1/10 Low
- Heat 3/10 Moderate 7 d/yr ≥101°F today · 16 d/yr by 30 yrs out
- Wind 2/10 Low
- Air quality 1/10 Low 0 unhealthy d/yr today · 0 by 30 yrs out
Nearby sold comps map
Loading sold comps map…
Walkable amenities ~0.75 mi
Loading nearby amenities…
Taxation est. · year 1
- Rental income
- $13,146
- − Mortgage interest
- −$3,081
- − Property taxes
- −$826
- − Insurance
- −$275
- − Repairs & maintenance
- −$1,052
- − Management
- −$1,052
- − Depreciation
- −$1,600
- Taxable income
- $5,261
- Est. tax owed @ 24.0%
- −$1,263
- After-tax cash flow
- $4,561/yr
For passive investors: Depreciation is non-cash, so a rental often shows a tax loss while cash-flowing — sheltering income. Rental losses are passive: they offset passive income freely, and up to $25,000/yr can offset ordinary (W-2) income if you actively participate and your MAGI is under $100k (phasing out to $0 by $150k); unused losses carry forward. On sale, claimed depreciation is recaptured at up to 25%, and gains may owe capital-gains tax (a 1031 exchange can defer both). Figures are a year-1 estimate at your 24.0% rate — not tax advice; consult a CPA.
Schools (NCES district)
- District
- Waterloo Community School District
- NCES district ID
- 1930480
- Math proficiency
- 50% ▼ -4.00%
- Reading proficiency
- 54% ▲ 1.00%
- Median HH income
- $42,545
- Composite
- 43.72/100
- National rank
- #2950
- State rank
- #276 of 289 in IA
Livability — Waterloo
- Score
- 81/100
- State rank
- #74
- US rank
- #1589
Category grades
Schools grade is shown separately in the Schools card above.
Census & demographics
- Census place
- Waterloo, IA
- County
- Black Hawk County · 112,933 people
- City population
- 69,066
- Metro
- Waterloo-Cedar Falls, IA
- Population (ZIP)
- 17,952
- Household income
- $50,060
- Rent vs Own
- Severe rent burden
- 871.0
Population outlook (Black Hawk County) Hauer SSP2
- Today (2025)
- 139,716 people
- By 2030
- 142,853 · +2.2%
- By 2040
- 147,843 · +5.8%
- By 2050
- 153,247 · +9.7%
- By 2075
- 167,977 · +20.2%
- By 2100
- 177,320 · +26.9%
Race, ethnicity, and origin ACS 2023
- Neighborhood character
- Diverse neighborhood (Simpson 0.62)
- Race & ethnicity
- White 55% Black 26% Hispanic / Latino 10% Two or more races 7% Asian 2%
- Hispanic origin (detail)
- Mexican 6%
- Common ancestry
- Iranian 1% Portuguese 1% Lithuanian 1%
- Foreign-born
- 7% · Canada, Philippines, China
- Languages at home
- 89% English-only · Spanish 7% Other Asian/Pacific 2% Russian/Polish/Slavic 1%
Political lean MEDSL · Black Hawk
- 2024 margin
- Toss-up / Even · D 50.0% · R 48.8% · Other 1.2%
- 2008→2024 swing
- -21.3pp toward R · 2008: 22.4pp · 2024: 1.2pp
- All cycles
- 2024: D+1.2 2020: D+9.0 2016: D+7.3 2012: D+20.0 2008: D+22.4
Not yet ingested
- Civics
- —
Market trends
- HPI YoY
- ▼ -117.18%
- Current HPI
- 132.9478
- Rent YoY
- ▲ 6.67%
- Metro
- Waterloo-Cedar Falls, IA
- State GDP YoY
- ▲ 2.48%
- F500 in state
- 4
Industry mix (Fortune 500 HQ in IA)
| Industry | F500 HQs | Revenue |
|---|---|---|
| Financial Services | 1 | $16B |
|
||
| Retail / Convenience | 1 | $15B |
|
||
Price history
1 event — show timeline
- 2026-02-04 Listed $55,000 NEIRBR as distributed by MLS GRID
Property tax history
-0.3%/yrLatest (2025): $826 · +8.7% YoY. Source: county tax records.
Cash-flow waterfall
monthlySold comps — $/sqft
last 12 mo · ≤1 miLoading sold comps…