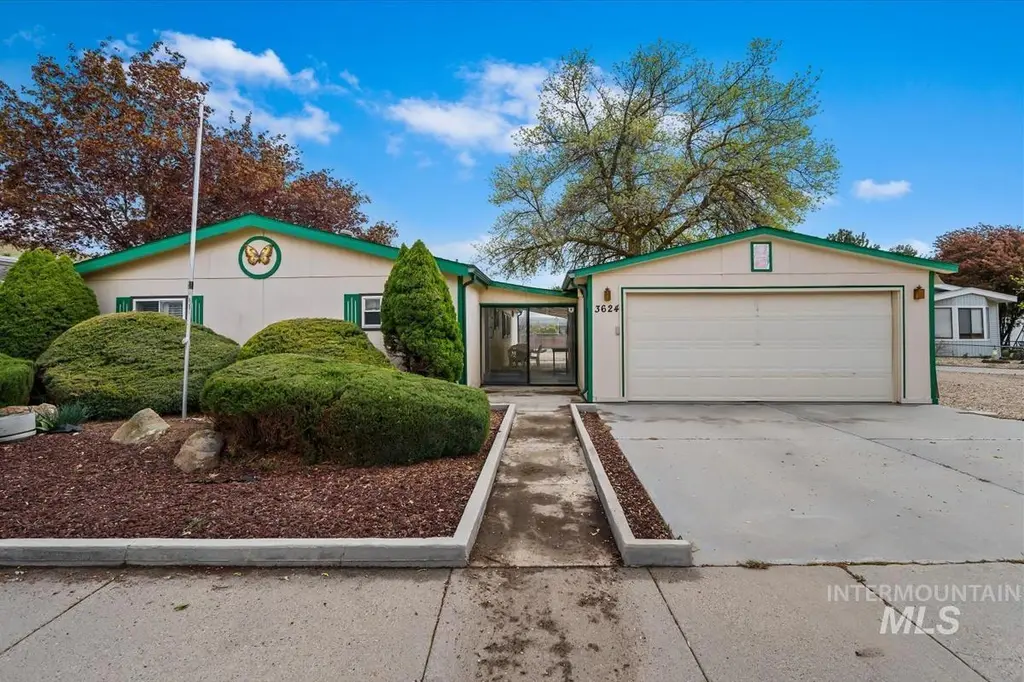
3624 S Licorice Pl · Boise City, ID
Flood risk 1/10 · Minimal
- FEMA flood zone
- X (unshaded)
- Chance of flooding over 30 yrs
- 0.0%
- Est. flood insurance / yr
- $507 – $1,088
Fire risk 10/10 · Severe
- Est. fire insurance / yr
- $584 – $1,086
Heat risk 4/10 · Minor
- Hot days now (above 95°F)
- 7 days/yr
- Hot days in 30 yrs
- 19 days/yr
Wind risk 1/10 · Minimal
- Chance of severe wind over 30 yrs
- —
Air-quality risk 8/10 · Major
- Unhealthy air days now
- 15 days/yr
- Unhealthy air days in 30 yrs
- 18 days/yr
Risk factors via First Street. Map © Google.
Why this score? — see what drove the C grade
The composite is a weighted blend of 9 inputs, each scored 0–100. Each bar is that input's sub-score; the figure is the points it added to the 100-point composite (weight × sub-score).
- Cash flow +23.4/30.0
- ARV discount +7.6/15.0
- DSCR +7.5/10.0
- 1% rule +5.1/10.0
- Schools +4.2/10.0
- Rent growth +3.7/5.0
- Livability +2.5/5.0
- Condition / age +2.5/5.0
- Appreciation +0.0/10.0
$297,500
🖨 Deal sheet 📄 Offer letter ✓ Due diligence
Listing remarks
You own the land here with no HOA or park fees. Located in East Boise, this property offers added privacy with no rear neighbors and a low maintenance setup. The home is on a permanent foundation and qualifies as real property. Inside features include vaulted ceilings, vinyl windows, and well maintained original character. Split bedroom floor plan and all appliances are included for a move in ready experience. Detached two car garage with breezeway provides extra convenience. Close to the Boise River, Greenbelt, parks, and hiking trails, with easy access to nearby coffee shops, restaurants, everyday services, and public transportation. A solid opportunity in a sought after East Boise locati
Key facts
- 6,098 sq ft lot
- 2 garage spots
- Built 1985
Property features AI
Exterior
- Parking: Detached 2-car garage (garage approximately 19 x 23); Finished driveway; 2 covered parking spaces
- Utilities: City water service; Sewer connected; Cable connected; Broadband internet
- Home design: Manufactured on land; Built by Hacienda; Built in 1985; Standard lot with sidewalks; Public, paved road frontage; Zoned R-1C; Subdivision: Barberton Sub
- Construction: Composition roof
- Exterior features: Metal fencing; Covered patio/deck
Interior
- Kitchen: Kitchen on main level (approx. 10 x 13); Dishwasher; Oven/Range (freestanding); Refrigerator; Breakfast bar; Pantry; Laminate counters
- Bedrooms: Primary bedroom on main level (approx. 15 x 12); Bedroom 2 on main level (approx. 15 x 15); Bedroom 3 on main level (approx. 10 x 10)
- Flooring: Carpet; Vinyl
- Bathrooms: 2 bathrooms
- Heating & cooling: Electric forced air heating; Central air conditioning
- Interior features: Bath in primary bedroom; Primary bedroom on main level; Guest room; Formal dining room; Great room; Breakfast bar; Pantry; Laminate counters
- Laundry & utility: Utility room on main level (approx. 9 x 9); Washer; Dryer; Electric water heater
Neighborhood map
What this means for you Summary
Snapshot
- This is a 3-bed/2.0-bath manufactured listed at $298k.
Deal economics
- At list price, monthly cash flow is $548 ($7k/yr) — positive.
- The deal already cash-flows at list — no discount required.
- Meets the 1% rule at list price ($3k rent vs $298k).
- Cap rate 8.5% vs local median 2.6% in Boise City — top-decile yield for the area; either an underpriced asset or a hidden risk that comps aren't pricing in. Stress-test before assuming the spread holds.
Location & tenants
- Location reads: area grade C — affects rentability + tenant quality, not the cash-flow math above.
- Boise Independent District (urban): math 42% / reading 56% proficiency, ranked #36 of 92 in ID (top 39%) — families likely to look elsewhere, expect single-tenant / working-renter base with shorter leases.
- Zoned schools: Timberline High School (math 53% / reading 74%, grade B-, #14 of 169 statewide, top 8%, 1,398 students, 10% FRL) — zoned schools average 10% FRL vs 33% district-wide (24 pts lower); this property's tenant base skews higher-income than the district average.
- Zoned-school proficiency averages 64% at this address vs 49% district-wide (+14 pts) — the actual schools serving this property are materially stronger than the Boise Independent District average implies; a family-tenant draw the district grade alone would hide.
- Market conditions: Rents rising fast (+4.8%/yr); 328 active listings in the ZIP; 2 comparable units currently listed for rent nearby; high-income renter base; 5,129 units permitted in Ada County in 2024 (414 in 5+ unit buildings).
Forward outlook
- Local home prices are declining (-3.0%/yr); year-one equity from $2k of loan paydown is wiped out by about $9k of value loss. Plan a longer hold.
- Ada County population projected at +45% by 2050 — long-run rental-demand tailwind backs the buy-and-hold thesis.
Negotiation context
- Only 7 days on market — expect competitive offers; lowballing is unlikely to land.
- 2 sale attempts; this cycle's ask is 4% above the opening price — seller raised mid-cycle; expect resistance to lowballs.
Risks & watch-outs
- Climate carrying-cost: severe wildfire risk — expect insurance premiums to compound above CPI over the hold.
Questions for the listing agent
- Is there a deadline driving the sale (1031 exchange, divorce, estate, relocation)? That informs how much negotiation room exists.
- What's the average days-on-market for RENTAL listings here right now (not sales)? A rising rental-DOM trend means longer vacancies and softer asking-rent achievability than the comps imply.
- What's the recent tenant-quality profile in this submarket — average credit score on applications, eviction rate, late-payment / NSF rate, and stable-employment percentage? A property-management company in the area should have these aggregated.
- How much new for-sale + rental construction is in the pipeline within 1–3 miles? Heavy new supply typically softens prices + rents 12–24 months out; constrained supply supports both.
Investment metrics
- 1% rule
- 1.01% ✓
- Cap rate
- 8.50%
- Cash-on-cash
- 7.89%
- DSCR
- 1.35
- GRM
- 8.3
CMA / ARV
- ARV (on-the-fly)
- $298,080
- Comps found
- 5
Show comp detail 5 sales within ~0.75 mi
| Address | Dist | Beds/Ba | Sqft | Sold | Price | $/sf | Match |
|---|---|---|---|---|---|---|---|
| 3624 S Licorice Pl | 0.00mi | 3/2.0 | 1,620 (0%) | 1mo | $297,500 | $184 | 99 |
| 5437 E Princess | 0.20mi | 3/2.0 | 1,536 (-5%) | 10mo | $319,900 | $208 | 74 |
| 5730 E Woodcross Dr | 0.10mi | 3/2.0 | 1,512 (-7%) | 18mo | $319,900 | $212 | 70 |
| 3512 Kingsland Way | 0.10mi | 2/2.0 (-1) | 1,440 (-11%) | 14mo | $229,900 | $160 | 60 |
| 5469 E Princess Dr | 0.19mi | 2/2.0 (-1) | 1,440 (-11%) | 11mo | $229,900 | $160 | 58 |
Match score weights: distance 35% · size 25% · config 20% · recency 20%. Top-matched comps best support the ARV.
Projected returns pro-forma
-3.0% appreciation · 4.78% rent growth · sell at horizon
- IRR
- -2.5%
- Equity multiple
- 0.90×
- Total profit
- $-7,962
- Equity at exit
- $44,358
- IRR
- 8.9%
- Equity multiple
- 1.73×
- Total profit
- $60,805
- Equity at exit
- $25,722
Cash invested: $83,300 (down + closing). Projections, not guarantees.
Landlord ↔ Tenant lean methodology
- Overall (STATE)
- 91 Strongly Landlord-Friendly
- State Idaho
- 91 Strongly Landlord-Friendly · R+18
- County
- — inherits STATE
- City
- — inherits STATE
ZIP-level market 83716
- Home prices YoY
- -22.8%
- Rents YoY
- 4.8%
- Active inventory
- 328
- Price-to-rent
- 8.3×
Monthly cashflow live
- Estimated rent
- $2,994 medium interval (Pro) →
- Mortgage (P&I)
- −$1,560
- Tax from tax record
- −$133 /mo · $1,602/yr
- Insurance
- −$124
- HOA
- −$0
- Vacancy / Maint / Mgmt
- −$629
- Net cashflow
- $548
Break-even live
UW: 25.0% down · 7.5% · 30yr · 1.5% tax · 5.0% vac · 8.0% maint · 8.0% mgmt
Financing live
Cash to close
- Down payment
- $74,375
- Closing costs
- $8,925
- Reserves months
- —
- Total cash needed
- —
Loan-product check · same deal, 3 products live
Conventional
25% down · 7.5% · 30yr
- Down + closing
- —
- Monthly P&I
- —
- Monthly cashflow
- —
- DSCR
- —
- Eligible?
- —
Personal DTI + credit; lowest rate.
DSCR
20% down · 8.5% · 30yr
- Down + closing
- —
- Monthly P&I
- —
- Monthly cashflow
- —
- DSCR
- —
- Eligible?
- —
No personal income docs; deal must DSCR.
Hard money
10% down · 12.0% · 12mo
- Down + closing
- —
- Monthly P&I
- —
- Monthly cashflow
- —
- DSCR
- —
- Eligible?
- —
Short-term bridge; refi at stabilization.
Rent comps 2 comps
| Address | Beds | Baths | Sqft | Rent | $/sqft | DOM | Units | Dist |
|---|---|---|---|---|---|---|---|---|
| 4314 E Parkcenter Blvd Boise, ID | 3.0 | 2.5 | 2010 | $3,195 | $1.59 | 10d | 1 | 0.96mi |
| 4402 S Cruzatte Ln Boise, ID | 3.0 | 2.0 | 1593 | $2,995 | $1.88 | 3d | 1 | 1.29mi |
Listing history 6 events
-
2026-06-01price $297,500
-
2026-05-18price $290,000
-
2026-05-05status Pending
-
2026-04-29status Active
-
2026-04-19status Pending
-
2026-04-17$285,000 Active
ⓘ Source: listings_history table (triggers on properties + properties_extension) + one-shot
backfill from property_details.listing_events for pre-trigger history.
Tax reassessment forecast ID · Resets to sale price
- Current annual tax
- $1,602 · $133/mo
- Projected year-2 tax
- $2,053 · $171/mo
- Expected delta
- +$451/yr (+$38/mo · 28.1%)
ⓘ Screening estimate from a state-policy table — verify with the county assessor before closing.
Climate risk First Street
- Flood 1/10 Low FEMA zone X (unshaded) · 0% chance over 30 yrs
- Wildfire 10/10 Extreme
- Heat 4/10 Moderate 7 d/yr ≥95°F today · 19 d/yr by 30 yrs out
- Wind 1/10 Low
- Air quality 8/10 Severe 15 unhealthy d/yr today · 18 by 30 yrs out
Nearby sold comps map
Loading sold comps map…
Walkable amenities ~0.75 mi
Loading nearby amenities…
Taxation est. · year 1
- Rental income
- $35,930
- − Mortgage interest
- −$16,665
- − Property taxes
- −$1,602
- − Insurance
- −$1,488
- − Repairs & maintenance
- −$2,874
- − Management
- −$2,874
- − Depreciation
- −$8,655
- Taxable income
- $1,772
- Est. tax owed @ 24.0%
- −$425
- After-tax cash flow
- $6,148/yr
For passive investors: Depreciation is non-cash, so a rental often shows a tax loss while cash-flowing — sheltering income. Rental losses are passive: they offset passive income freely, and up to $25,000/yr can offset ordinary (W-2) income if you actively participate and your MAGI is under $100k (phasing out to $0 by $150k); unused losses carry forward. On sale, claimed depreciation is recaptured at up to 25%, and gains may owe capital-gains tax (a 1031 exchange can defer both). Figures are a year-1 estimate at your 24.0% rate — not tax advice; consult a CPA.
Schools (NCES district)
- District
- Boise Independent District
- NCES district ID
- 1600360
- Math proficiency
- 42% ▼ -5.00%
- Reading proficiency
- 56% ▼ -1.00%
- Median HH income
- $49,135
- Composite
- 41.82/100
- National rank
- #3388
- State rank
- #36 of 92 in ID
Livability — Boise City
No livability data for this city. (Only ~50 U.S. cities are tracked.)
Census & demographics
- Census place
- Boise City, ID
- County
- Ada County · 522,161 people
- City population
- 152,689
- Metro
- Boise City, ID
- Population (ZIP)
- 21,402
- Household income
- $128,822
- Rent vs Own
- Severe rent burden
- 408.0
Population outlook (Ada County) Hauer SSP2
- Today (2025)
- 535,818 people
- By 2030
- 585,751 · +9.3%
- By 2040
- 682,435 · +27.4%
- By 2050
- 775,818 · +44.8%
- By 2075
- 994,458 · +85.6%
- By 2100
- 1,148,884 · +114.4%
Race, ethnicity, and origin ACS 2023
- Neighborhood character
- Predominantly White (77%)
- Race & ethnicity
- White 77% Asian 9% Two or more races 7% Hispanic / Latino 6%
- Hispanic origin (detail)
- Mexican 3%
- Common ancestry
- Italian 6% Portuguese 2% Slovak 2%
- Foreign-born
- 11% · Canada, China, South Korea
- Languages at home
- 87% English-only · Spanish 4% Chinese 2% Other Asian/Pacific 2%
Political lean MEDSL · Ada
- 2024 margin
- R (+10.3) · D 43.4% · R 53.8% · Other 2.8%
- 2008→2024 swing
- -4.2pp toward R · 2008: -6.2pp · 2024: -10.3pp
- All cycles
- 2024: R+10.3 2020: R+3.9 2016: R+9.2 2012: R+11.3 2008: R+6.2
Not yet ingested
- Civics
- —
Market trends
- HPI YoY
- ▼ -97.80%
- Current HPI
- 332.0696
- Rent YoY
- ▲ 4.78%
- Metro
- Boise City, ID
- State GDP YoY
- ▲ 4.51%
- F500 in state
- 6
Industry mix (Fortune 500 HQ in ID)
| Industry | F500 HQs | Revenue |
|---|---|---|
| Retail | 1 | $79B |
|
||
| Technology | 1 | $25B |
|
||
| Food / Agriculture | 1 | $6B |
|
||
Price history
+4.4% since first listed6 events — show timeline
- 2026-06-01 Price Changed $297,500 IMLS
- 2026-05-18 Price Changed $290,000 IMLS
- 2026-05-05 Pending — IMLS
- 2026-04-29 Relisted — IMLS
- 2026-04-19 Pending — IMLS
- 2026-04-17 Listed $285,000 IMLS
Property tax history
+7.9%/yrLatest (2025): $1,602 · +6.2% YoY. Source: county tax records.
Cash-flow waterfall
monthlySold comps — $/sqft
last 12 mo · ≤1 miLoading sold comps…