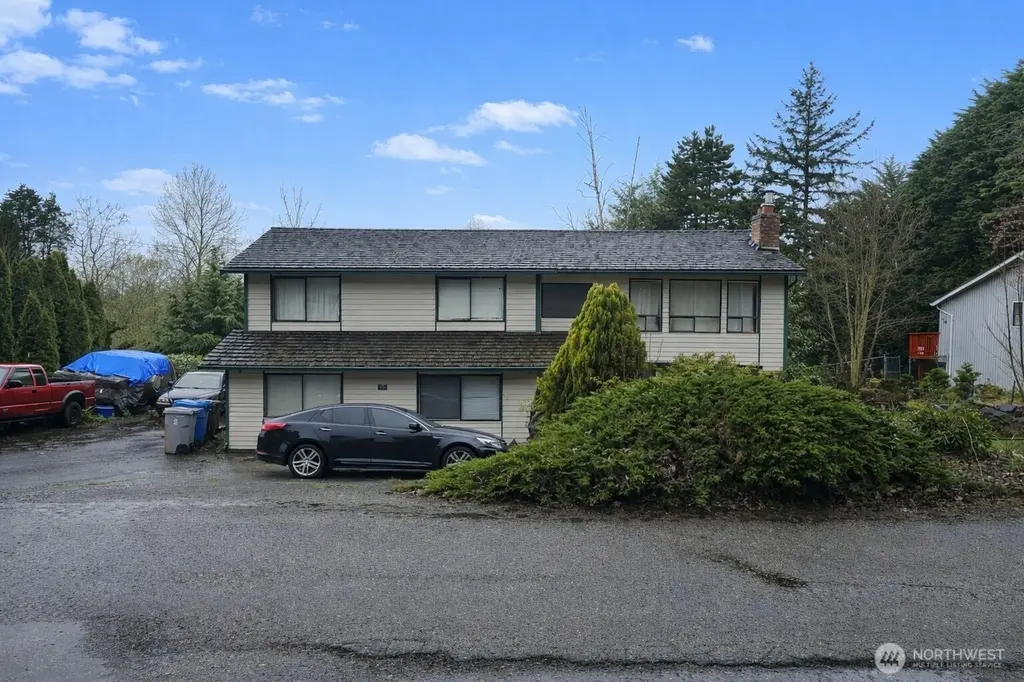
25611 126th Pl SE · Kent, WA
Flood risk 1/10 · Minimal
- FEMA flood zone
- X (unshaded)
- Chance of flooding over 30 yrs
- 0.0%
- Est. flood insurance / yr
- $473 – $860
Fire risk 1/10 · Minimal
- Est. fire insurance / yr
- $604 – $1,122
Heat risk 3/10 · Minor
- Hot days now (above 87°F)
- 7 days/yr
- Hot days in 30 yrs
- 15 days/yr
Wind risk 1/10 · Minimal
- Chance of severe wind over 30 yrs
- —
Air-quality risk 8/10 · Major
- Unhealthy air days now
- 12 days/yr
- Unhealthy air days in 30 yrs
- 12 days/yr
Risk factors via First Street. Map © Google.
Why this score? — see what drove the D grade
The composite is a weighted blend of 9 inputs, each scored 0–100. Each bar is that input's sub-score; the figure is the points it added to the 100-point composite (weight × sub-score).
- ARV discount +15.0/15.0
- Cash flow +8.4/30.0
- Schools +4.8/10.0
- Livability +4.0/5.0
- Rent growth +3.4/5.0
- Condition / age +2.5/5.0
- DSCR +2.3/10.0
- 1% rule +2.1/10.0
- Appreciation +0.0/10.0
$570,000
🖨 Deal sheet (PDF) 📄 Offer letter ✓ Due diligence
Listing remarks
INVESTORS/DEVELOPERS! Discover opportunity & flexibility on a quiet dead-end road in the heart of Kent. Perfectly positioned yet tucked away, this property offers the best of both worlds—privacy w/ convenient access to everything the area has to offer. Sitting on a spacious 1/2 acre lot, the home presents incredible upside for investors or buyers ready to build equity. Inside, the layout offers versatility & future potential—the interior configuration is only limited by your imagination. The primary suite features a roughed-in walk-in closet & en suite bath, all of the material to finish it out are there, providing a head start on customization, or can easily b
Key facts
- Minutes to shopping
- Spacious 1/2 lot
- En suite bath
Tags
Neighborhood map
What this means for you Summary
Snapshot
- This is a 6-bed/3.0-bath single-family listed at $570k.
Deal economics
- At list price, monthly cash flow is $-509 ($-6k/yr) — negative.
- To cash-flow at today's rent, offer at most $480k (15.8% below list).
- To meet the 1% rule (rent ≥ 1% of price), the offer needs to be $407k (28.6% below list).
- Recommended offer: $407k (28.6% below list) — sets the bar for 1% rule.
- Cap rate 5.2% vs local median 2.6% in Kent — top-decile yield for the area; either an underpriced asset or a hidden risk that comps aren't pricing in. Stress-test before assuming the spread holds.
Location & tenants
- Location reads 79/100 on livability (#109 in WA, #2,154 nationally) — a middle-class / working-renter tenant base. Strengths: amenities A+, commute A+, housing A+; Watch: crime F, cost of living F.
- Kent School District (urban): math 47% / reading 57% proficiency, ranked #109 of 291 in WA (top 38%) — acceptable for families but not a draw, mixed tenant base, ~2y average lease.
- Zoned schools: Millennium Elementary School (488 students, 77% FRL); Mattson Middle School (617 students, 54% FRL); Kentlake High School (1,440 students, 54% FRL) — zoned schools average 62% FRL vs 41% district-wide (21 pts higher); higher-poverty schools than district average — tighter screening recommended.
- Market conditions: Rents rising (+3.7%/yr); 173 active listings in the ZIP; 2 comparable units currently listed for rent nearby; solid renter incomes; 10,555 units permitted in King County in 2024 (7,119 in 5+ unit buildings).
- At $4,072/mo this rent would consume 53% of the median local household income ($92k/yr) (locally 1415% of renters already pay >50% of income on rent) — very limited rent-growth headroom before tenants either downsize or default.
Forward outlook
- Local home prices are declining (-3.0%/yr); year-one equity from $4k of loan paydown is wiped out by about $17k of value loss. Plan a longer hold.
- King County population projected at +44% by 2050 — long-run rental-demand tailwind backs the buy-and-hold thesis.
Negotiation context
- It's been on market 38 days — a 3% lower offer ($553k) is reasonable based on typical stale-listing flexibility.
- 3 sale attempts since 15y ago; this cycle's ask is 4% above the opening price — seller raised mid-cycle; expect resistance to lowballs.
- Current owner paid $155k; list at $570k implies a 268% gain — meaningful room to come down on a strong offer.
Questions for the listing agent
- What do current leases actually rent for vs. the listed asking? Can we see a recent rent roll and the last 12 months of T-12 income?
- It's been on market 38 days. Have you received any prior offers? Is the seller open to a 29% concession, seller financing, or rate buy-down credit?
- Built in 1977 — when were the roof, HVAC, electrical panel, plumbing, and water heater last replaced?
- Is there a deadline driving the sale (1031 exchange, divorce, estate, relocation)? That informs how much negotiation room exists.
- Crime grade is F in this area — have there been break-ins, vandalism, or insurance claims at this property in the last 3 years? What carrier currently insures it and at what premium?
- The area grade is low — what's the realistic commute time and amenity access for the typical tenant pool here? Any planned neighborhood developments (good or bad) we should know about?
- What's the average days-on-market for RENTAL listings here right now (not sales)? A rising rental-DOM trend means longer vacancies and softer asking-rent achievability than the comps imply.
- What's the recent tenant-quality profile in this submarket — average credit score on applications, eviction rate, late-payment / NSF rate, and stable-employment percentage? A property-management company in the area should have these aggregated.
- How much new for-sale + rental construction is in the pipeline within 1–3 miles? Heavy new supply typically softens prices + rents 12–24 months out; constrained supply supports both.
Investment metrics
- 1% rule
- 0.71% ✗
- Cap rate
- 5.22%
- Cash-on-cash
- -3.82%
- DSCR
- 0.83
- GRM
- 11.7
CMA / ARV
- ARV (median comp)
- $799,927
- List price
- $570,000
- Delta
- -28.74%
- Verdict
- UNDERPRICED
- Comps
- 20 within 1.0 mi
Show comp detail 7 sales within ~0.75 mi
| Address | Dist | Beds/Ba | Sqft | Sold | Price | $/sf | Match |
|---|---|---|---|---|---|---|---|
| 12433 SE 256th Pl #4 | 0.10mi | 5/3.0 (-1) | 2,540 (-8%) | 7mo | $839,900 | $331 | 71 |
| 12230 SE 254th Pl | 0.27mi | 5/3.0 (-1) | 2,982 (+8%) | 3mo | $1,040,000 | $349 | 67 |
| 12235 SE 253rd St | 0.29mi | 5/3.5 (-1) | 2,632 (-5%) | 5mo | $755,000 | $287 | 67 |
| 25715 127th Ave SE | 0.06mi | 5/3.0 (-1) | 3,060 (+10%) | 20mo | $711,000 | $232 | 58 |
| 25506 132nd Ave SE | 0.39mi | 5/3.0 (-1) | 2,570 (-7%) | 17mo | $775,000 | $302 | 51 |
| 13715 SE 255th Pl | 0.71mi | 5/2.5 (-1) | 2,550 (-8%) | 10mo | $749,950 | $294 | 38 |
| 25429 116th Ave SE | 0.67mi | 5/3.0 (-1) | 2,380 (-14%) | 22mo | $735,000 | $309 | 22 |
Match score weights: distance 35% · size 25% · config 20% · recency 20%. Top-matched comps best support the ARV.
Projected returns pro-forma
-3.0% appreciation · 3.72% rent growth · sell at horizon
- IRR
- -22.0%
- Equity multiple
- 0.24×
- Total profit
- $-121,857
- Equity at exit
- $84,989
- IRR
- -14.4%
- Equity multiple
- 0.15×
- Total profit
- $-135,736
- Equity at exit
- $49,283
Cash invested: $159,600 (down + closing). Projections, not guarantees.
Landlord ↔ Tenant lean methodology
- Overall (STATE)
- 28 Tenant-Leaning
- State Washington
- 28 Tenant-Leaning · D+8
- County
- — inherits STATE
- City
- — inherits STATE
ZIP-level market 98030
- Rents YoY
- 3.7%
- Active inventory
- 173
- Price-to-rent
- 11.7×
Monthly cashflow live
- Estimated rent
- $4,072 medium interval (Pro) →
- Mortgage (P&I)
- −$2,989
- Tax from tax record
- −$499 /mo · $5,986/yr
- Insurance
- −$238
- HOA
- −$0
- Vacancy / Maint / Mgmt
- −$855
- Net cashflow
- $-509
Break-even live
Sensitivity live
| Price | -10% $-186 | -5% $-347 | +0% $-509 | +5% $-670 | +10% $-831 |
|---|---|---|---|---|---|
| Rent | -10% $-830 | -5% $-669 | +0% $-509 | +5% $-348 | +10% $-187 |
| Rate | -1.0pp $-222 | -0.5pp $-364 | base $-509 | +0.5pp $-656 | +1.0pp $-807 |
UW: 25.0% down · 7.5% · 30yr · 1.5% tax · 5.0% vac · 8.0% maint · 8.0% mgmt
Financing live
Cash to close
- Down payment
- $142,500
- Closing costs
- $17,100
- Reserves months
- —
- Total cash needed
- —
Loan-product check · same deal, 3 products live
Conventional
25% down · 7.5% · 30yr
- Down + closing
- —
- Monthly P&I
- —
- Monthly cashflow
- —
- DSCR
- —
- Eligible?
- —
Personal DTI + credit; lowest rate.
DSCR
20% down · 8.5% · 30yr
- Down + closing
- —
- Monthly P&I
- —
- Monthly cashflow
- —
- DSCR
- —
- Eligible?
- —
No personal income docs; deal must DSCR.
Hard money
10% down · 12.0% · 12mo
- Down + closing
- —
- Monthly P&I
- —
- Monthly cashflow
- —
- DSCR
- —
- Eligible?
- —
Short-term bridge; refi at stabilization.
Rent comps 2 comps
| Address | Beds | Baths | Sqft | Rent | $/sqft | DOM | Units | Dist |
|---|---|---|---|---|---|---|---|---|
| 11226 SE 254th St Lot 1 Kent, WA | 5.0 | 3.0 | 2960 | $4,990 | $1.69 | 45d | 1 | 0.86mi |
| 11226 SE 254th St Kent, WA | 5.0 | 3.0 | 2960 | $4,890 | $1.65 | 45d | 1 | 0.86mi |
Listing history 21 events
-
2026-05-09status Pending
-
2026-04-22price $570,000
-
2026-04-13price $575,000
-
2026-04-08price $580,000
-
2026-04-01$550,000 Active
-
2012-10-30soldstatus $155,000 Sold
-
2012-10-30soldstatus $155,000
-
2012-09-24status Pending Short Sale
-
2012-09-20price $160,000
-
2012-09-12price $165,000 Active
-
2012-09-12status Active
-
2012-09-07price $180,000
-
2012-07-11status Pending Short Sale
-
2012-04-20price $199,000
-
2011-09-12price $210,000
-
2011-07-13price $220,000
-
2011-06-29price $225,000
-
2011-06-02$230,000 Active
-
1987-04-22soldstatus $99,900
-
1981-11-03soldstatus $89,990
-
1978-01-11soldstatus $53,000
ⓘ Source: listings_history table (triggers on properties + properties_extension) + one-shot
backfill from property_details.listing_events for pre-trigger history.
Tax reassessment forecast WA · Resets to sale price
- Current annual tax
- $5,986 · $499/mo
- Projected year-2 tax
- $5,986 · $499/mo
- Expected delta
- $0/yr ($0/mo · 0.0%)
ⓘ Screening estimate from a state-policy table — verify with the county assessor before closing.
Climate risk First Street
- Flood 1/10 Low FEMA zone X (unshaded) · 0% chance over 30 yrs
- Wildfire 1/10 Low
- Heat 3/10 Moderate 7 d/yr ≥87°F today · 15 d/yr by 30 yrs out
- Wind 1/10 Low
- Air quality 8/10 Severe 12 unhealthy d/yr today · 12 by 30 yrs out
Nearby sold comps map
Loading sold comps map…
Walkable amenities ~0.75 mi
Loading nearby amenities…
Taxation est. · year 1
- Rental income
- $48,864
- − Mortgage interest
- −$31,929
- − Property taxes
- −$5,986
- − Insurance
- −$2,850
- − Repairs & maintenance
- −$3,909
- − Management
- −$3,909
- − Depreciation
- −$16,582
- Taxable loss
- −$16,301
- Est. tax savings @ 24.0%
- +$3,912
- After-tax cash flow
- $-2,191/yr
For passive investors: Depreciation is non-cash, so a rental often shows a tax loss while cash-flowing — sheltering income. Rental losses are passive: they offset passive income freely, and up to $25,000/yr can offset ordinary (W-2) income if you actively participate and your MAGI is under $100k (phasing out to $0 by $150k); unused losses carry forward. On sale, claimed depreciation is recaptured at up to 25%, and gains may owe capital-gains tax (a 1031 exchange can defer both). Figures are a year-1 estimate at your 24.0% rate — not tax advice; consult a CPA.
Schools (NCES district)
- District
- Kent School District
- NCES district ID
- 5303960
- Math proficiency
- 47% ▼ -1.00%
- Reading proficiency
- 57% ▼ -1.00%
- Median HH income
- $69,823
- Composite
- 48.25/100
- National rank
- #4714
- State rank
- #109 of 291 in WA
Livability — Kent
- Score
- 79/100
- State rank
- #109
- US rank
- #2154
Category grades
Schools grade is shown separately in the Schools card above.
Census & demographics
- Census place
- Kent, WA
- County
- King County · 2,251,916 people
- City population
- 119,479
- Metro
- Seattle-Tacoma-Bellevue, WA
- Population (ZIP)
- 38,523
- Household income
- $91,761
- Rent vs Own
- Severe rent burden
- 1415.0
Population outlook (King County) Hauer SSP2
- Today (2025)
- 2,576,485 people
- By 2030
- 2,803,316 · +8.8%
- By 2040
- 3,255,921 · +26.4%
- By 2050
- 3,706,444 · +43.9%
- By 2075
- 4,746,063 · +84.2%
- By 2100
- 5,407,730 · +109.9%
Race, ethnicity, and origin ACS 2023
- Neighborhood character
- Highly diverse neighborhood (Simpson 0.74)
- Race & ethnicity
- White 41% Asian 24% Hispanic / Latino 15% Black 11% Two or more races 9% Pacific Islander 3%
- Hispanic origin (detail)
- Mexican 12%
- Common ancestry
- Subsaharan African 6% Italian 4% Portuguese 2%
- Foreign-born
- 36% · Canada, Vietnam, Philippines
- Languages at home
- 53% English-only · Spanish 10% Other Indo-European 9% Other Asian/Pacific 8%
Political lean MEDSL · King
- 2024 margin
- Solid D (+51.7) · D 74.2% · R 22.5% · Other 3.4%
- 2008→2024 swing
- +9.6pp toward D · 2008: 42.1pp · 2024: 51.7pp
- All cycles
- 2024: D+51.7 2020: D+52.7 2016: D+50.4 2012: D+39.9 2008: D+42.1
Not yet ingested
- Civics
- —
Market trends
- HPI YoY
- ▼ -494.18%
- Current HPI
- 315.2007
- Rent YoY
- ▲ 3.72%
- Metro
- Seattle-Tacoma-Bellevue, WA
- State GDP YoY
- ▲ 4.65%
- F500 in state
- 22
Industry mix (Fortune 500 HQ in WA)
| Industry | F500 HQs | Revenue |
|---|---|---|
| Retail | 2 | $269B |
|
||
| Technology / Retail | 1 | $638B |
|
||
| Technology | 1 | $245B |
|
||
| Telecommunications | 1 | $38B |
|
||
| Food / Beverage | 1 | $36B |
|
||
| Automotive / Trucks | 1 | $34B |
|
||
Price history
+975.5% since first listed21 events — show timeline
- 2026-05-09 Pending — NWMLS as Distributed by MLS Grid
- 2026-04-22 Price Changed $570,000 NWMLS as Distributed by MLS Grid
- 2026-04-13 Price Changed $575,000 NWMLS as Distributed by MLS Grid
- 2026-04-08 Price Changed $580,000 NWMLS as Distributed by MLS Grid
- 2026-04-01 Listed $550,000 NWMLS as Distributed by MLS Grid
- 2012-10-30 Sold (Public Records) $155,000 Public Records
- 2012-10-30 Sold (MLS) $155,000 NWMLS as Distributed by MLS Grid
- 2012-09-24 Pending — NWMLS as Distributed by MLS Grid
- 2012-09-20 Price Changed $160,000 NWMLS as Distributed by MLS Grid
- 2012-09-12 Relisted — NWMLS as Distributed by MLS Grid
- 2012-09-12 Price Changed $165,000 NWMLS as Distributed by MLS Grid
- 2012-09-07 Price Changed $180,000 NWMLS as Distributed by MLS Grid
- 2012-07-11 Pending — NWMLS as Distributed by MLS Grid
- 2012-04-20 Price Changed $199,000 NWMLS as Distributed by MLS Grid
- 2011-09-12 Price Changed $210,000 NWMLS as Distributed by MLS Grid
- 2011-07-13 Price Changed $220,000 NWMLS as Distributed by MLS Grid
- 2011-06-29 Price Changed $225,000 NWMLS as Distributed by MLS Grid
- 2011-06-02 Listed $230,000 NWMLS as Distributed by MLS Grid
- 1987-04-22 Sold (Public Records) $99,900 Public Records
- 1981-11-03 Sold (Public Records) $89,990 Public Records
- 1978-01-11 Sold (Public Records) $53,000 Public Records
Property tax history
+2.6%/yrLatest (2025): $5,986 · +7.4% YoY. Source: county tax records.
Cash-flow waterfall
monthlySold comps — $/sqft
last 12 mo · ≤1 miLoading sold comps…