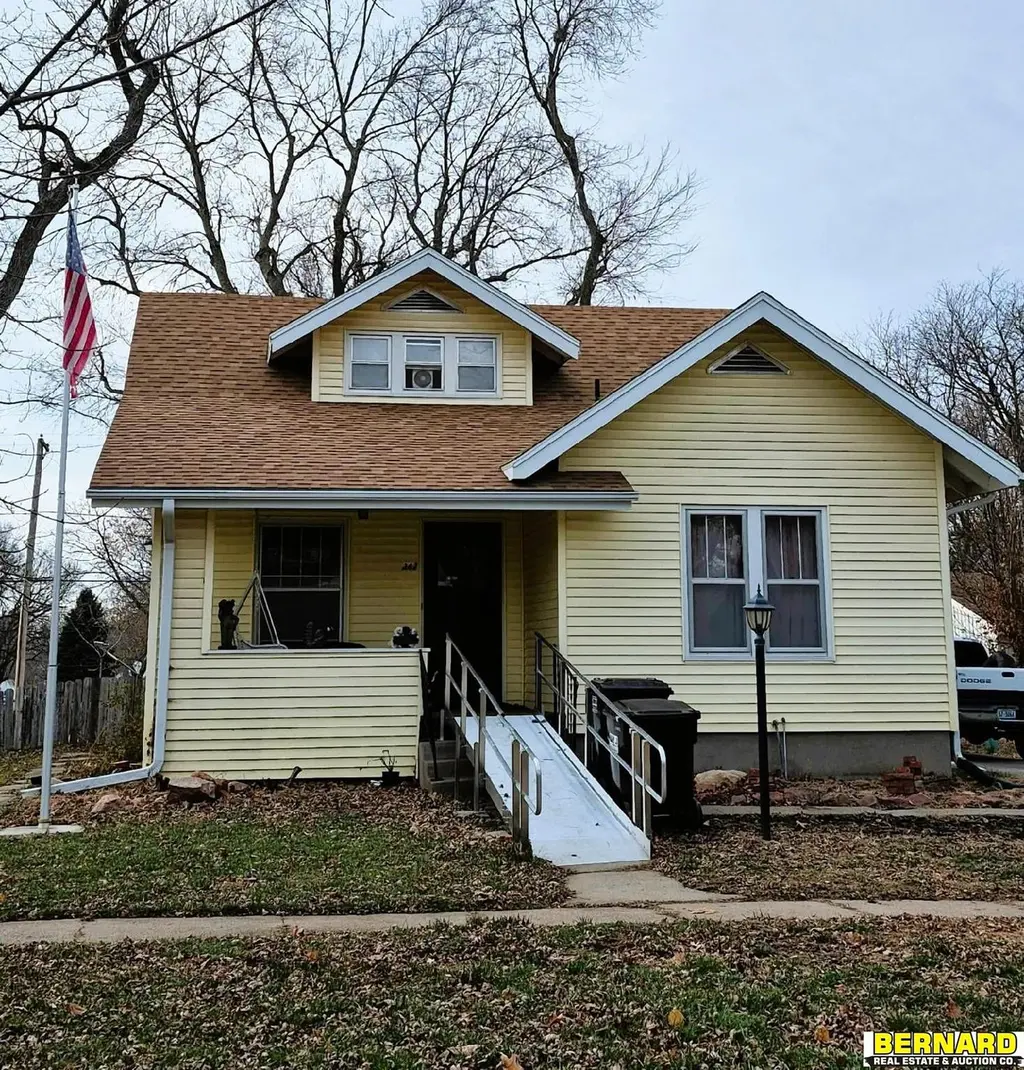
347 N 3rd St · Tecumseh, NE
Flood risk 1/10 · Minimal
- FEMA flood zone
- X (unshaded)
- Chance of flooding over 30 yrs
- 0.0%
- Est. flood insurance / yr
- $473 – $860
Fire risk 4/10 · Minor
- Est. fire insurance / yr
- $1,161 – $2,155
Heat risk 3/10 · Minor
- Hot days now (above 106°F)
- 7 days/yr
- Hot days in 30 yrs
- 16 days/yr
Wind risk 2/10 · Minimal
- Chance of severe wind over 30 yrs
- —
Air-quality risk 2/10 · Minimal
- Unhealthy air days now
- 0 days/yr
- Unhealthy air days in 30 yrs
- 1 days/yr
Risk factors via First Street. Map © Google.
Why this score? — see what drove the C grade
The composite is a weighted blend of 9 inputs, each scored 0–100. Each bar is that input's sub-score; the figure is the points it added to the 100-point composite (weight × sub-score).
- Cash flow +15.9/30.0
- ARV discount +12.5/15.0
- Appreciation +5.8/10.0
- DSCR +4.9/10.0
- Schools +4.0/10.0
- 1% rule +3.8/10.0
- Livability +3.7/5.0
- Rent growth +2.5/5.0
- Condition / age +2.5/5.0
$150,000
🖨 Deal sheet 📄 Offer letter ✓ Due diligence
Listing remarks
This inviting 3-bedroom home offers the convenience of main floor laundry and a thoughtful layout. The main level features a large living room, formal dining room, and a kitchen with plenty of cabinet space. Just off the kitchen is a utility porch—perfect for a freezer, extra shelving, or storage needs. Also on the main floor are a bedroom, full bath, and laundry area. Beautiful wood floors add warmth and character to the living room, dining room, bedroom, and hallway. Built-in storage throughout the home provides both function and charm. The upper level includes two generously sized bedrooms,
Key facts
- Formal dining room
- Main floor laundry
- Large living room
Tags
Neighborhood map
What this means for you Summary
Snapshot
- This is a 4-bed/3.0-bath single-family listed at $150k.
Deal economics
- At list price, monthly cash flow is $71 ($849/yr) — positive.
- The deal already cash-flows at list — no discount required.
- To meet the 1% rule (rent ≥ 1% of price), the offer needs to be $132k (11.8% below list).
- Recommended offer: $132k (11.8% below list) — sets the bar for 1% rule.
Location & tenants
- Location reads 74/100 on livability (#108 in NE, #4,391 nationally) — a middle-class / working-renter tenant base. Strengths: crime A+, cost of living A+, housing A+; Watch: schools C-, amenities F, commute F.
- Johnson County Central Public Schools (rural): math 47% / reading 48% proficiency, ranked #73 of 111 in NE (top 66%) — families likely to look elsewhere, expect single-tenant / working-renter base with shorter leases.
- Market conditions: 14 active listings in the ZIP; 4 units permitted in Johnson County in 2024 (0 in 5+ unit buildings).
Forward outlook
- In year one you build about $3k of equity ($1k loan paydown + $2k appreciation (1.6% local appreciation)).
- Johnson County population projected at +10% by 2050 — modest demand growth; plan on rents tracking national, not racing it.
- At projected returns (1.6% appreciation + 3.0% rent growth), your $42k cash investment doubles in ~8 years — after that, you're playing with house money.
- By year 9, paydown + projected appreciation supports a ~$30k cash-out refi (75% LTV) — recoverable capital for the next deal without selling this one.
Negotiation context
- Only 13 days on market — expect competitive offers; lowballing is unlikely to land.
- 3 sale attempts since 3y ago; this cycle's ask has dropped $15k (9%) from the opening price — seller is motivated, your offer sets the floor, not the list.
- Current owner paid $125k; 20% above their basis — modest negotiation headroom, anchor on the comps not their cost.
Risks & watch-outs
- Watch-outs: built in 1932 — expect roof / HVAC / electrical / plumbing capex.
Questions for the listing agent
- Built in 1932 — when were the roof, HVAC, electrical panel, plumbing, and water heater last replaced?
- Is there a deadline driving the sale (1031 exchange, divorce, estate, relocation)? That informs how much negotiation room exists.
- What's the average days-on-market for RENTAL listings here right now (not sales)? A rising rental-DOM trend means longer vacancies and softer asking-rent achievability than the comps imply.
- What's the recent tenant-quality profile in this submarket — average credit score on applications, eviction rate, late-payment / NSF rate, and stable-employment percentage? A property-management company in the area should have these aggregated.
- How much new for-sale + rental construction is in the pipeline within 1–3 miles? Heavy new supply typically softens prices + rents 12–24 months out; constrained supply supports both.
Investment metrics
- 1% rule
- 0.88% ✗
- Cap rate
- 6.86%
- Cash-on-cash
- 2.02%
- DSCR
- 1.09
- GRM
- 9.4
CMA / ARV
- ARV (median comp)
- $168,775
- List price
- $150,000
- Delta
- -2.24%
- Verdict
- FAIR
- Comps
- 20 within 1.0 mi
Show comp detail 3 sales within ~0.75 mi
| Address | Dist | Beds/Ba | Sqft | Sold | Price | $/sf | Match |
|---|---|---|---|---|---|---|---|
| 425 High St | 0.53mi | 4/2.0 | 2,674 (+4%) | 5mo | $225,000 | $84 | 60 |
| 569 Santee Blvd | 0.68mi | 3/3.5 (-1) | 2,307 (-10%) | 11mo | $300,000 | $130 | 35 |
| 554 Shawnee Blvd | 0.62mi | 3/2.0 (-1) | 2,210 (-14%) | 9mo | $240,000 | $109 | 31 |
Match score weights: distance 35% · size 25% · config 20% · recency 20%. Top-matched comps best support the ARV.
Projected returns pro-forma
1.62% appreciation · 3.0% rent growth · sell at horizon
- IRR
- 5.4%
- Equity multiple
- 1.28×
- Total profit
- $11,898
- Equity at exit
- $56,104
- IRR
- 9.2%
- Equity multiple
- 2.19×
- Total profit
- $50,076
- Equity at exit
- $78,502
Cash invested: $42,000 (down + closing). Projections, not guarantees.
Landlord ↔ Tenant lean methodology
- Overall (STATE)
- 83 Strongly Landlord-Friendly
- State Nebraska
- 83 Strongly Landlord-Friendly · R+13
- County
- — inherits STATE
- City
- — inherits STATE
ZIP-level market 68450
- Home prices YoY
- 0.9%
- Active inventory
- 14
- Price-to-rent
- 9.4×
Monthly cashflow live
- Estimated rent
- $1,323 medium interval (Pro) →
- Mortgage (P&I)
- −$787
- Tax from tax record
- −$125 /mo · $1,506/yr
- Insurance
- −$62
- HOA
- −$0
- Vacancy / Maint / Mgmt
- −$278
- Net cashflow
- $71
Break-even live
UW: 25.0% down · 7.5% · 30yr · 1.5% tax · 5.0% vac · 8.0% maint · 8.0% mgmt
Financing live
Cash to close
- Down payment
- $37,500
- Closing costs
- $4,500
- Reserves months
- —
- Total cash needed
- —
Loan-product check · same deal, 3 products live
Conventional
25% down · 7.5% · 30yr
- Down + closing
- —
- Monthly P&I
- —
- Monthly cashflow
- —
- DSCR
- —
- Eligible?
- —
Personal DTI + credit; lowest rate.
DSCR
20% down · 8.5% · 30yr
- Down + closing
- —
- Monthly P&I
- —
- Monthly cashflow
- —
- DSCR
- —
- Eligible?
- —
No personal income docs; deal must DSCR.
Hard money
10% down · 12.0% · 12mo
- Down + closing
- —
- Monthly P&I
- —
- Monthly cashflow
- —
- DSCR
- —
- Eligible?
- —
Short-term bridge; refi at stabilization.
Listing history 19 events
-
2026-06-18days on market $150,000 Active 13 DOM
-
2026-06-17days on market $150,000 Active 12 DOM
-
2026-06-16days on market $150,000 Active 11 DOM
-
2026-06-15days on market $150,000 Active 10 DOM
-
2026-06-13days on market $150,000 Active 8 DOM
-
2026-06-12statusdays on market $150,000 Active 7 DOM
-
2026-06-09days on market $150,000 New 4 DOM
-
2026-06-08days on market $150,000 New 3 DOM
-
2026-06-07days on market $150,000 New 2 DOM
-
2026-06-07pricestatusdays on market $150,000 New 1 DOM
-
2026-05-19historical
-
2025-12-17$165,000 New
-
2023-12-29soldstatus $125,000
-
2023-12-14historical
-
2023-10-22price $125,000
-
2023-09-25status Back On Market
-
2023-09-18status Pending
-
2023-09-13$135,000 New
-
2006-03-31soldstatus $55,000
ⓘ Source: listings_history table (triggers on properties + properties_extension) + one-shot
backfill from property_details.listing_events for pre-trigger history.
Tax reassessment forecast NE · Resets to sale price
- Current annual tax
- $1,506 · $125/mo
- Projected year-2 tax
- $2,595 · $216/mo
- Expected delta
- +$1,089/yr (+$91/mo · 72.3%)
ⓘ Screening estimate from a state-policy table — verify with the county assessor before closing.
Climate risk First Street
- Flood 1/10 Low FEMA zone X (unshaded) · 0% chance over 30 yrs
- Wildfire 4/10 Moderate
- Heat 3/10 Moderate 7 d/yr ≥106°F today · 16 d/yr by 30 yrs out
- Wind 2/10 Low
- Air quality 2/10 Low 0 unhealthy d/yr today · 1 by 30 yrs out
Nearby sold comps map
Loading sold comps map…
Walkable amenities ~0.75 mi
Loading nearby amenities…
Taxation est. · year 1
- Rental income
- $15,879
- − Mortgage interest
- −$8,402
- − Property taxes
- −$1,506
- − Insurance
- −$750
- − Repairs & maintenance
- −$1,270
- − Management
- −$1,270
- − Depreciation
- −$4,364
- Taxable loss
- −$1,683
- Est. tax savings @ 24.0%
- +$404
- After-tax cash flow
- $1,253/yr
For passive investors: Depreciation is non-cash, so a rental often shows a tax loss while cash-flowing — sheltering income. Rental losses are passive: they offset passive income freely, and up to $25,000/yr can offset ordinary (W-2) income if you actively participate and your MAGI is under $100k (phasing out to $0 by $150k); unused losses carry forward. On sale, claimed depreciation is recaptured at up to 25%, and gains may owe capital-gains tax (a 1031 exchange can defer both). Figures are a year-1 estimate at your 24.0% rate — not tax advice; consult a CPA.
Schools (NCES district)
- District
- Johnson County Central Public Schools
- NCES district ID
- 3100176
- Math proficiency
- 47% ▲ 3.00%
- Reading proficiency
- 48% ▲ 1.00%
- Median HH income
- $44,058
- Composite
- 40.15/100
- National rank
- #3795
- State rank
- #73 of 111 in NE
Livability — Tecumseh
- Score
- 74/100
- State rank
- #108
- US rank
- #4391
Category grades
Schools grade is shown separately in the Schools card above.
Census & demographics
- Census place
- Tecumseh, NE
- Population (ZIP)
- 3,111
Population outlook (Johnson County) Hauer SSP2
- Today (2025)
- 5,198 people
- By 2030
- 5,231 · +0.6%
- By 2040
- 5,408 · +4.0%
- By 2050
- 5,699 · +9.6%
- By 2075
- 6,747 · +29.8%
- By 2100
- 7,066 · +35.9%
Race, ethnicity, and origin ACS 2023
- Neighborhood character
- Predominantly White (67%)
- Race & ethnicity
- White 67% Hispanic / Latino 18% Two or more races 9% Black 8% Native American 2% Asian 2%
- Hispanic origin (detail)
- Mexican 14% Puerto Rican 1%
- Common ancestry
- Iranian 2% Romanian 1% Serbian 1%
- Foreign-born
- 6% · Canada
- Languages at home
- 84% English-only · Spanish 13% Other Asian/Pacific 2%
Political lean MEDSL · Johnson
- 2024 margin
- Solid R (+40.5) · D 29.0% · R 69.5% · Other 1.4%
- 2008→2024 swing
- -29.7pp toward R · 2008: -10.8pp · 2024: -40.5pp
- All cycles
- 2024: R+40.5 2020: R+39.0 2016: R+38.4 2012: R+21.1 2008: R+10.8
Not yet ingested
- Civics
- —
Market trends
- HPI YoY
- ▲ 1.62%
- Current HPI
- 178.9214
- Rent YoY
- —
- Metro
- —
- State GDP YoY
- ▲ 0.68%
- F500 in state
- 2
Industry mix (Fortune 500 HQ in NE)
| Industry | F500 HQs | Revenue |
|---|---|---|
| Conglomerate | 1 | $371B |
|
||
Price history
+200.0% since first listed9 events — show timeline
- 2026-05-19 Listing Removed — GPRMLS
- 2025-12-17 Listed $165,000 GPRMLS
- 2023-12-29 Sold (Public Records) $125,000 Public Records
- 2023-12-14 Listing Removed — GPRMLS
- 2023-10-22 Price Changed $125,000 GPRMLS
- 2023-09-25 Relisted — GPRMLS
- 2023-09-18 Pending — GPRMLS
- 2023-09-13 Listed $135,000 GPRMLS
- 2006-03-31 Sold (Public Records) $55,000 Public Records
Property tax history
+1.6%/yrLatest (2023): $1,506 · +13.5% YoY. Source: county tax records.
Cash-flow waterfall
monthlySold comps — $/sqft
last 12 mo · ≤1 miLoading sold comps…