 6-Plex
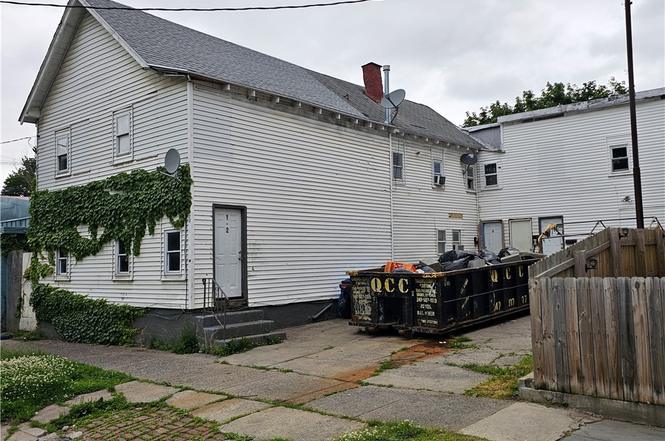
1230 Court St · Utica, NY
Flood risk 1/10 · Minimal
- FEMA flood zone
- X (unshaded)
- Chance of flooding over 30 yrs
- 0.0%
- Est. flood insurance / yr
- $473 – $860
Fire risk 1/10 · Minimal
- Est. fire insurance / yr
- $691 – $1,283
Heat risk 3/10 · Minor
- Hot days now (above 95°F)
- 7 days/yr
- Hot days in 30 yrs
- 16 days/yr
Wind risk 1/10 · Minimal
- Chance of severe wind over 30 yrs
- 1.0%
Air-quality risk 2/10 · Minimal
- Unhealthy air days now
- 0 days/yr
- Unhealthy air days in 30 yrs
- 2 days/yr
Risk factors via First Street. Map © Google.
Why this score? — see what drove the D grade
The composite is a weighted blend of 9 inputs, each scored 0–100. Each bar is that input's sub-score; the figure is the points it added to the 100-point composite (weight × sub-score).
- Cash flow +15.0/30.0
- ARV discount +7.5/15.0
- 1% rule +5.0/10.0
- DSCR +5.0/10.0
- Livability +4.0/5.0
- Schools +2.9/10.0
- Rent growth +2.5/5.0
- Condition / age +2.5/5.0
- Appreciation +0.0/10.0
$149,900
🖨 Deal sheet 📄 Offer letter ✓ Due diligence
Multi-family units
County records classify this as Multi-Family (5+ Unit). Listing-text estimate: 6 units. confirmed
5+ unit building — per-unit beds/baths from public records are typically unavailable; the breakdown below (if shown) is an estimate from the listing text.
Listing remarks
Investor opportunity in Utica, New York – West Utica 6-Unit Building Income-producing , need TLC 6-unit apartment building featuring four 2-bedroom units and two 1-bedroom units. Separated utilities. Off-street parking. Basement offers potential for additional usable space. Solid layout for steady rental income and value-add potential. SOLD AS IS
Key facts
- 3 parking spots
- Built 1960
- Listed 96 days
Neighborhood map
What this means for you Summary
Snapshot
- This is a 6 × 6-bed/?-bath units multifamily listed at $150k.
Deal economics
- At list price, monthly cash flow is $8k ($93k/yr) — positive. Per door: $1k/mo.
- The deal already cash-flows at list — no discount required.
- Meets the 1% rule at list price ($11k rent vs $150k).
- Recommended offer: $136k (9.0% below list) — sets the bar for market timing.
- Cap rate 68.0% vs local median 7.7% in Utica — top-decile yield for the area; either an underpriced asset or a hidden risk that comps aren't pricing in. Stress-test before assuming the spread holds.
Location & tenants
- Location reads 80/100 on livability (#104 in NY, #1,589 nationally) — a professional / high-income tenant draw. Strengths: commute A+, cost of living A+, housing A+; Watch: employment D, schools D-, crime F.
- Utica City School District (urban): math 33% / reading 38% proficiency, ranked #562 of 590 in NY (top 95%) — families likely to look elsewhere, expect single-tenant / working-renter base with shorter leases; 71% free/reduced lunch — lower-income household profile, screen leases tightly.
- Market conditions: 150 active listings in the ZIP; 204 units permitted in Oneida County in 2024 (68 in 5+ unit buildings).
- At $11,022/mo this rent would consume 229% of the median local household income ($58k/yr) (locally 1604% of renters already pay >50% of income on rent) — very limited rent-growth headroom before tenants either downsize or default.
Forward outlook
- Local home prices are declining (-3.0%/yr); year-one equity from $1k of loan paydown is wiped out by about $4k of value loss. Plan a longer hold.
- Oneida County population projected at -12% by 2050 — secular population decline; favor cash flow + early exit over multi-decade hold.
- At projected returns (-3.0% appreciation + 3.0% rent growth), your $42k cash investment doubles in ~1 year — after that, you're playing with house money.
Negotiation context
- It's been on market 96 days — a 9% lower offer ($136k) is reasonable based on typical stale-listing flexibility.
- 3 sale attempts; this cycle's ask has dropped $25k (14%) from the opening price — seller is motivated, your offer sets the floor, not the list.
- Current owner paid $60k; list at $150k implies a 150% gain — meaningful room to come down on a strong offer.
Questions for the listing agent
- It's been on market 96 days. Have you received any prior offers? Is the seller open to a 9% concession, seller financing, or rate buy-down credit?
- Can we see the unit-by-unit rent roll, current vacancy, and any below-market leases? What's the average tenancy length?
- What capital expenditures (roof, boiler, parking lot, exteriors) have been made in the last 5 years, and what's planned in the next 2?
- Built in 1960 — when were the roof, HVAC, electrical panel, plumbing, and water heater last replaced?
- Why hasn't it sold? Are there any deal-killer items the seller is aware of (foundation, flood, title, zoning, code violations)?
- Is there a deadline driving the sale (1031 exchange, divorce, estate, relocation)? That informs how much negotiation room exists.
- Schools are D-rated, which usually means shorter tenancies and higher turnover. Who's the typical renter profile here, and what's been the actual vacancy rate?
- Crime grade is F in this area — have there been break-ins, vandalism, or insurance claims at this property in the last 3 years? What carrier currently insures it and at what premium?
- The area grade is low — what's the realistic commute time and amenity access for the typical tenant pool here? Any planned neighborhood developments (good or bad) we should know about?
- What's the average days-on-market for RENTAL listings here right now (not sales)? A rising rental-DOM trend means longer vacancies and softer asking-rent achievability than the comps imply.
- What's the recent tenant-quality profile in this submarket — average credit score on applications, eviction rate, late-payment / NSF rate, and stable-employment percentage? A property-management company in the area should have these aggregated.
- How much new apartment / multifamily construction is in the pipeline within 1–3 miles? Heavy new supply (>2% of stock underway) typically softens rents 12–24 months out; light construction supports rent growth.
Investment metrics
- 1% rule
- 7.35% ✓
- Cap rate
- 68.04%
- Cash-on-cash
- 220.54%
- DSCR
- 10.81
- GRM
- 1.1
CMA / ARV
No comps found within radius.
Projected returns pro-forma
-3.0% appreciation · 3.0% rent growth · sell at horizon
- IRR
- —
- Equity multiple
- 12.13×
- Total profit
- $467,139
- Equity at exit
- $22,351
- IRR
- —
- Equity multiple
- 25.78×
- Total profit
- $1,039,960
- Equity at exit
- $12,961
Cash invested: $41,972 (down + closing). Projections, not guarantees.
Landlord ↔ Tenant lean methodology
- Overall (STATE)
- 15 Strongly Tenant-Friendly
- State New York
- 15 Strongly Tenant-Friendly · D+10
- County
- — inherits STATE
- City
- — inherits STATE
ZIP-level market 13502
- Home prices YoY
- -12.1%
- Active inventory
- 150
- Price-to-rent
- 6.8×
Monthly cashflow live
- Estimated rent
- $11,022 medium interval (Pro) →
- Mortgage (P&I)
- −$786
- Tax from tax record
- −$145 /mo · $1,742/yr
- Insurance
- −$62
- HOA
- −$0
- Vacancy / Maint / Mgmt
- −$2,315
- Net cashflow
- $7,714
Break-even live
6-unit breakdown (identical units grouped — click to expand)
| Units | Beds | Baths | Est. rent |
|---|---|---|---|
| 6× units | 6 | — | $11,022 |
| #1 | 6 | — | $1,837 |
| #2 | 6 | — | $1,837 |
| #3 | 6 | — | $1,837 |
| #4 | 6 | — | $1,837 |
| #5 | 6 | — | $1,837 |
| #6 | 6 | — | $1,837 |
| Total (6 units) | $11,022 | ||
UW: 25.0% down · 7.5% · 30yr · 1.5% tax · 5.0% vac · 8.0% maint · 8.0% mgmt
Financing live
Cash to close
- Down payment
- $37,475
- Closing costs
- $4,497
- Reserves months
- —
- Total cash needed
- —
Loan-product check · same deal, 3 products live
Conventional
25% down · 7.5% · 30yr
- Down + closing
- —
- Monthly P&I
- —
- Monthly cashflow
- —
- DSCR
- —
- Eligible?
- —
Personal DTI + credit; lowest rate.
DSCR
20% down · 8.5% · 30yr
- Down + closing
- —
- Monthly P&I
- —
- Monthly cashflow
- —
- DSCR
- —
- Eligible?
- —
No personal income docs; deal must DSCR.
Hard money
10% down · 12.0% · 12mo
- Down + closing
- —
- Monthly P&I
- —
- Monthly cashflow
- —
- DSCR
- —
- Eligible?
- —
Short-term bridge; refi at stabilization.
Listing history 11 events
-
2026-03-29status Pending
-
2026-02-21price $149,900
-
2025-12-28historical
-
2025-12-23$175,000 Active
-
2025-12-22historical
-
2025-12-22historical
-
2025-12-22historical
-
2025-07-15status Active
-
2025-06-28status Pending
-
2025-06-19$199,900 Active
-
2017-05-17soldstatus $60,000
ⓘ Source: listings_history table (triggers on properties + properties_extension) + one-shot
backfill from property_details.listing_events for pre-trigger history.
Tax reassessment forecast NY · Partial reset (capped growth)
- Current annual tax
- $1,742 · $145/mo
- Projected year-2 tax
- $2,137 · $178/mo
- Expected delta
- +$396/yr (+$33/mo · 22.7%)
ⓘ Screening estimate from a state-policy table — verify with the county assessor before closing.
Climate risk First Street
- Flood 1/10 Low FEMA zone X (unshaded) · 0% chance over 30 yrs
- Wildfire 1/10 Low
- Heat 3/10 Moderate 7 d/yr ≥95°F today · 16 d/yr by 30 yrs out
- Wind 1/10 Low 100% chance of damaging wind over 30 yrs
- Air quality 2/10 Low 0 unhealthy d/yr today · 2 by 30 yrs out
Nearby sold comps map
Loading sold comps map…
Walkable amenities ~0.75 mi
Loading nearby amenities…
Taxation est. · year 1
- Rental income
- $132,264
- − Mortgage interest
- −$8,397
- − Property taxes
- −$1,742
- − Insurance
- −$750
- − Repairs & maintenance
- −$10,581
- − Management
- −$10,581
- − Depreciation
- −$4,361
- Taxable income
- $95,853
- Est. tax owed @ 24.0%
- −$23,005
- After-tax cash flow
- $69,560/yr
For passive investors: Depreciation is non-cash, so a rental often shows a tax loss while cash-flowing — sheltering income. Rental losses are passive: they offset passive income freely, and up to $25,000/yr can offset ordinary (W-2) income if you actively participate and your MAGI is under $100k (phasing out to $0 by $150k); unused losses carry forward. On sale, claimed depreciation is recaptured at up to 25%, and gains may owe capital-gains tax (a 1031 exchange can defer both). Figures are a year-1 estimate at your 24.0% rate — not tax advice; consult a CPA.
Schools (NCES district)
- District
- Utica City School District
- NCES district ID
- 3629370
- Math proficiency
- 33% ▼ -7.00%
- Reading proficiency
- 38% ▲ 2.00%
- Median HH income
- $31,834
- Composite
- 29.01/100
- National rank
- #6613
- State rank
- #562 of 590 in NY
Livability — Utica
- Score
- 80/100
- State rank
- #104
- US rank
- #1589
Category grades
Schools grade is shown separately in the Schools card above.
Census & demographics
- Census place
- Utica, NY
- County
- Oneida County · 89,710 people
- City population
- 72,968
- Metro
- Utica-Rome, NY
- Population (ZIP)
- 34,037
- Household income
- $57,835
- Rent vs Own
- Severe rent burden
- 1604.0
Population outlook (Oneida County) Hauer SSP2
- Today (2025)
- 225,223 people
- By 2030
- 220,384 · -2.1%
- By 2040
- 209,071 · -7.2%
- By 2050
- 197,920 · -12.1%
- By 2075
- 175,541 · -22.1%
- By 2100
- 148,491 · -34.1%
Race, ethnicity, and origin ACS 2023
- Neighborhood character
- Predominantly White (71%)
- Race & ethnicity
- White 71% Hispanic / Latino 11% Black 9% Two or more races 7% Asian 5%
- Hispanic origin (detail)
- Mexican 2% Puerto Rican 5% Dominican 2%
- Common ancestry
- Romanian 11% Lithuanian 3% American 2%
- Foreign-born
- 12% · Canada, Philippines, China
- Languages at home
- 81% English-only · Spanish 7% Russian/Polish/Slavic 4% Other Asian/Pacific 3%
Political lean MEDSL · Oneida
- 2024 margin
- Strong R (+21.3) · D 39.4% · R 60.6%
- 2008→2024 swing
- -15.2pp toward R · 2008: -6.1pp · 2024: -21.3pp
- All cycles
- 2024: R+21.3 2020: R+15.5 2016: R+21.1 2012: R+5.3 2008: R+6.1
Not yet ingested
- Civics
- —
Market trends
- HPI YoY
- ▼ -50.76%
- Current HPI
- 368.3955
- Rent YoY
- —
- Metro
- Utica-Rome, NY
- State GDP YoY
- ▲ 2.60%
- F500 in state
- 92
Industry mix (Fortune 500 HQ in NY)
| Industry | F500 HQs | Revenue |
|---|---|---|
| Financial Services | 10 | $950B |
|
||
| Consumer Goods | 9 | $162B |
|
||
| Insurance | 4 | $225B |
|
||
| Telecommunications | 2 | $144B |
|
||
| Pharmaceuticals | 2 | $112B |
|
||
| Media / Entertainment | 2 | $69B |
|
||
Price history
+149.8% since first listed11 events — show timeline
- 2026-03-29 Pending — CNYIS
- 2026-02-21 Price Changed $149,900 CNYIS
- 2025-12-28 Listing Removed — CNYIS
- 2025-12-23 Listed $175,000 CNYIS
- 2025-12-22 Listing Removed — CNYIS
- 2025-12-22 Listing Removed — CNYIS
- 2025-12-22 Listing Removed — CNYIS
- 2025-07-15 Relisted — CNYIS
- 2025-06-28 Pending — CNYIS
- 2025-06-19 Listed $199,900 CNYIS
- 2017-05-17 Sold (Public Records) $60,000 Public Records
Property tax history
+4.0%/yrLatest (2025): $1,742 · +5.6% YoY. Source: county tax records.
Cash-flow waterfall
monthlySold comps — $/sqft
last 12 mo · ≤1 miLoading sold comps…