14608 Sage Bloom Ln · Elgin, TX
Flood risk No data
- FEMA flood zone
- —
- Chance of flooding over 30 yrs
- —
- Est. flood insurance / yr
- —
Fire risk No data
- Est. fire insurance / yr
- —
Heat risk No data
- Hot days now (above threshold)
- —
- Hot days in 30 yrs
- —
Wind risk No data
- Chance of severe wind over 30 yrs
- —
Air-quality risk No data
- Unhealthy air days now
- —
- Unhealthy air days in 30 yrs
- —
Risk factors via First Street. Map © Google.
Why this score? — see what drove the B- grade
The composite is a weighted blend of 9 inputs, each scored 0–100. Each bar is that input's sub-score; the figure is the points it added to the 100-point composite (weight × sub-score).
- Cash flow +17.0/30.0
- ARV discount +15.0/15.0
- Appreciation +10.0/10.0
- DSCR +5.3/10.0
- 1% rule +4.8/10.0
- Condition / age +4.0/5.0
- Livability +3.7/5.0
- Rent growth +3.3/5.0
- Schools +2.0/10.0
$212,990
🖨 Deal sheet 📄 Offer letter ✓ Due diligence
Listing remarks MLS
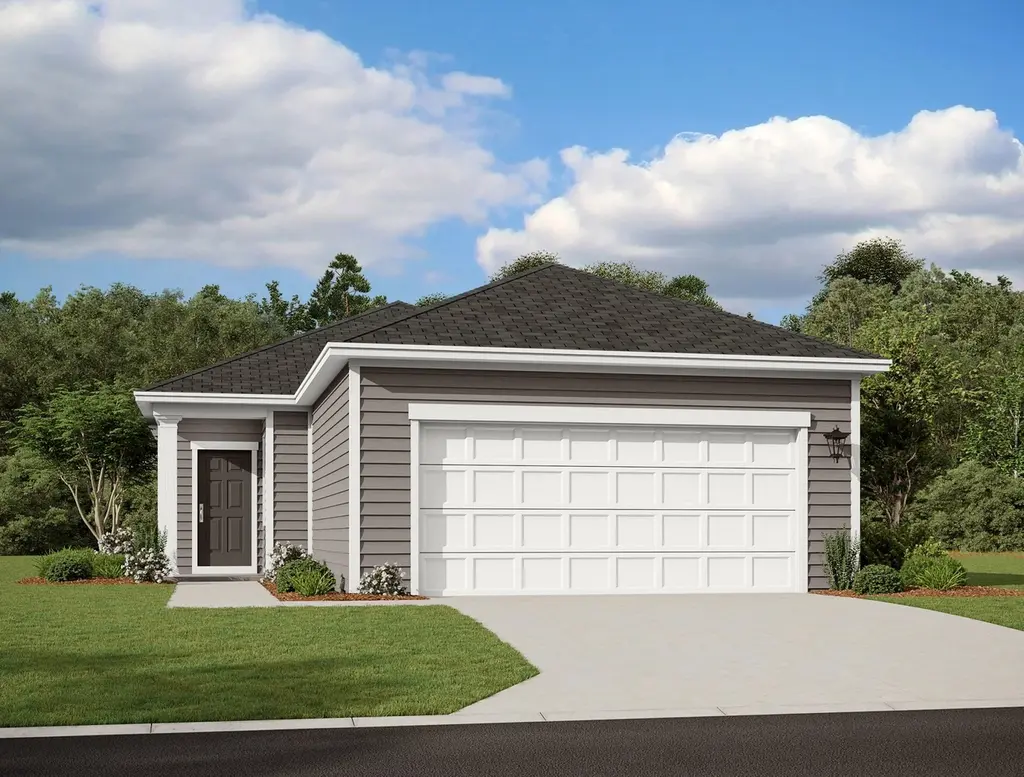
Step through the front porch into a foyer that leads to two bedrooms and a full bath near the front of the home. A coat closet and linen storage are located just off the hallway for added convenience. At the center of the home, the kitchen opens to the family room, creating a connected main living area. The primary bedroom is located at the back and features a walk-in closet and a primary bath. A patio is accessible through the family room, and the two-car garage connects to the home through a hallway near the secondary bedrooms.
Key facts
- Walk-in closet
- Private bath
- Front porch
Tags
Property features AI
Finance
- HOA & community: Homeowners association (Eagles Landing Residential Community HOA); HOA fee $35 monthly (includes common area maintenance); Community features: common grounds, community mailbox, curbs, dog park, playground, park, street lights, sidewalks, trails/paths
Exterior
- Parking: Attached garage; Garage faces front; Driveway; 2 covered parking spaces (2 total)
- Security: Smoke detector(s)
- Utilities: Public water; Public sewer; Electricity available; Cable available; Phone available; Underground utilities
- Home design: Single-story home; New construction by Starlight Homes; Faces north; Slab foundation
- Construction: HardiPlank-style siding and masonry; Composition/shingle roof; Built by builder (new construction)
- Exterior features: Covered front porch; Patio; Fenced backyard with wood privacy fencing; Back yard; Front yard; Sprinklers in front and rear (automatic, in-ground); Smoke detector(s)
Interior
- Kitchen: Granite counters; Kitchen/family room combo; Dining area; Pantry; Dishwasher; Electric cooktop; Range; Self-cleaning oven; Microwave; Refrigerator; Icemaker; Disposal; Stainless steel appliances
- Bedrooms: 3 main-level bedrooms; Main-level primary bedroom
- Flooring: Carpet; Vinyl
- Bathrooms: 2 full bathrooms
- Heating & cooling: Central heating (electric); Central air conditioning (electric)
- Interior features: Open floorplan; Recessed lighting; Entrance foyer; Breakfast bar; Kitchen island; Granite counters; Pantry; No interior steps; See remarks; Blinds; Double-pane windows; Window screens; Walk-in closet(s)
- Laundry & utility: Inside laundry room; Washer hookup; Electric dryer hookup; Washer; Dryer; Electric water heater
Neighborhood map
What this means for you Summary
Snapshot
- This is a 3-bed/2.0-bath single-family listed at $213k. Condition is rated good.
Deal economics
- At list price, monthly cash flow is $146 ($2k/yr) — positive.
- The deal already cash-flows at list — no discount required.
- To meet the 1% rule (rent ≥ 1% of price), the offer needs to be $209k (1.8% below list).
- Recommended offer: $209k (1.8% below list) — sets the bar for 1% rule.
- Cap rate 7.1% vs local median 4.4% in Elgin — top-decile yield for the area; either an underpriced asset or a hidden risk that comps aren't pricing in. Stress-test before assuming the spread holds.
Location & tenants
- Location reads 74/100 on livability (#167 in TX, #4,404 nationally) — a middle-class / working-renter tenant base. Strengths: cost of living A+, housing A+, health & safety A+; Watch: schools F, amenities F, commute F.
- Elgin ISD (rural): math 17% / reading 26% proficiency, ranked #741 of 826 in TX (top 90%) — low school quality limits family demand, transient renter base, plan for 1-2y turnover; 67% free/reduced lunch — lower-income household profile, screen leases tightly.
- Market conditions: Rents rising (+3.1%/yr); 807 active listings in the ZIP; 7 comparable units currently listed for rent nearby; rentals leasing fast (median 11d on market — plan ~1-2 weeks tenant-placement turnaround); solid renter incomes; 17,121 units permitted in Travis County in 2024 (11,963 in 5+ unit buildings).
Forward outlook
- In year one you build about $23k of equity ($1k loan paydown + $21k appreciation (10.0% local appreciation)).
- Travis County population projected at +60% by 2050 — long-run rental-demand tailwind backs the buy-and-hold thesis.
- At projected returns (10.0% appreciation + 3.1% rent growth), your $60k cash investment doubles in ~3 years — after that, you're playing with house money.
- By year 2, paydown + projected appreciation supports a ~$37k cash-out refi (75% LTV) — recoverable capital for the next deal without selling this one.
Negotiation context
- It's been on market 26 days — a 2% lower offer ($210k) is reasonable based on typical stale-listing flexibility.
- 3 sale attempts with the ask held roughly flat each time — persistent listings suggest the price (not the market) is what's stuck; bring a comps-based counter.
Questions for the listing agent
- What does the HOA fee cover, when was the last increase, and are there any pending special assessments or reserve-fund shortfalls?
- Is there a deadline driving the sale (1031 exchange, divorce, estate, relocation)? That informs how much negotiation room exists.
- Schools are F-rated, which usually means shorter tenancies and higher turnover. Who's the typical renter profile here, and what's been the actual vacancy rate?
- What's the average days-on-market for RENTAL listings here right now (not sales)? A rising rental-DOM trend means longer vacancies and softer asking-rent achievability than the comps imply.
- What's the recent tenant-quality profile in this submarket — average credit score on applications, eviction rate, late-payment / NSF rate, and stable-employment percentage? A property-management company in the area should have these aggregated.
- How much new for-sale + rental construction is in the pipeline within 1–3 miles? Heavy new supply typically softens prices + rents 12–24 months out; constrained supply supports both.
Investment metrics
- 1% rule
- 0.98% ✗
- Cap rate
- 7.11%
- Cash-on-cash
- 2.93%
- DSCR
- 1.13
- GRM
- 8.5
CMA / ARV
- ARV (on-the-fly)
- $268,800
- Comps found
- 12
Show comp detail 12 sales within ~0.75 mi
| Address | Dist | Beds/Ba | Sqft | Sold | Price | $/sf | Match |
|---|---|---|---|---|---|---|---|
| 14521 Bonellis Pass | 0.13mi | 3/2.0 | 1,200 (0%) | 6mo | $232,291 | $194 | 89 |
| 14625 Bonellis Pass | 0.13mi | 3/2.0 | 1,200 (0%) | 8mo | $243,945 | $203 | 87 |
| 14624 Wahlbergs Way | 0.15mi | 3/2.0 | 1,305 (+9%) | 2mo | $269,900 | $207 | 77 |
| 14600 Wahlbergs Way | 0.15mi | 3/2.0 | 1,305 (+9%) | 4mo | $292,900 | $224 | 75 |
| 14604 Wahlbergs Way | 0.15mi | 3/2.0 | 1,076 (-10%) | 3mo | $249,900 | $232 | 73 |
| 18308 Stellers Sea St | 0.16mi | 3/2.0 | 1,076 (-10%) | 3mo | $229,900 | $214 | 72 |
| 18420 Stellers Sea St | 0.23mi | 3/2.0 | 1,076 (-10%) | 2mo | $252,900 | $235 | 71 |
| 18404 Stellers Sea St | 0.20mi | 3/2.0 | 1,076 (-10%) | 4mo | $277,900 | $258 | 70 |
| 14705 Eagles Claw Way | 0.24mi | 3/2.0 | 1,076 (-10%) | 2mo | $255,900 | $238 | 70 |
| 18232 Stellers Sea St | 0.13mi | 3/2.0 | 1,076 (-10%) | 8mo | $257,900 | $240 | 70 |
| 18708 Golden Eagle Way | 0.44mi | 4/2.0 (+1) | 1,251 (+4%) | 11mo | $250,000 | $200 | 58 |
| 248 Heritage Mill Trl | 0.63mi | 3/2.0 | 1,074 (-10%) | 5mo | $232,040 | $216 | 49 |
Match score weights: distance 35% · size 25% · config 20% · recency 20%. Top-matched comps best support the ARV.
Projected returns pro-forma
10.0% appreciation · 3.12% rent growth · sell at horizon
- IRR
- 26.4%
- Equity multiple
- 3.11×
- Total profit
- $125,582
- Equity at exit
- $191,878
- IRR
- 23.2%
- Equity multiple
- 7.09×
- Total profit
- $363,145
- Equity at exit
- $413,793
Cash invested: $59,637 (down + closing). Projections, not guarantees.
Landlord ↔ Tenant lean methodology
- Overall (STATE)
- 87 Strongly Landlord-Friendly
- State Texas
- 87 Strongly Landlord-Friendly · R+5
- County
- — inherits STATE
- City
- — inherits STATE
ZIP-level market 78621
- Home prices YoY
- 7.6%
- Rents YoY
- 3.1%
- Active inventory
- 807
- Price-to-rent
- 8.5×
Monthly cashflow live
- Estimated rent
- $2,092 high interval (Pro) →
- Mortgage (P&I)
- −$1,117
- Tax est. 1.5%
- −$266 /mo · $3,195/yr
- Insurance
- −$89
- HOA
- −$35
- Vacancy / Maint / Mgmt
- −$439
- Net cashflow
- $146
Break-even live
UW: 25.0% down · 7.5% · 30yr · 1.5% tax · 5.0% vac · 8.0% maint · 8.0% mgmt
Financing live
Cash to close
- Down payment
- $53,248
- Closing costs
- $6,390
- Reserves months
- —
- Total cash needed
- —
Loan-product check · same deal, 3 products live
Conventional
25% down · 7.5% · 30yr
- Down + closing
- —
- Monthly P&I
- —
- Monthly cashflow
- —
- DSCR
- —
- Eligible?
- —
Personal DTI + credit; lowest rate.
DSCR
20% down · 8.5% · 30yr
- Down + closing
- —
- Monthly P&I
- —
- Monthly cashflow
- —
- DSCR
- —
- Eligible?
- —
No personal income docs; deal must DSCR.
Hard money
10% down · 12.0% · 12mo
- Down + closing
- —
- Monthly P&I
- —
- Monthly cashflow
- —
- DSCR
- —
- Eligible?
- —
Short-term bridge; refi at stabilization.
Rent comps 7 comps
| Address | Beds | Baths | Sqft | Rent | $/sqft | DOM | Units | Dist |
|---|---|---|---|---|---|---|---|---|
| 18200 Papuan Cv Elgin, TX | 3.0 | 2.0 | 1402 | $1,900 | $1.36 | 3d | 1 | 0.07mi |
| 14508 Wahlbergs Way Elgin, TX | 3.0 | 2.0 | 1076 | $2,045 | $1.90 | 11d | 1 | 0.16mi |
| 18316 Stellers Sea St Elgin, TX | 3.0 | 2.0 | 1076 | $2,045 | $1.90 | 19d | 1 | 0.16mi |
| 18721 Quiet Range Dr Elgin, TX | 3.0–5.0 | 2.0–3.5 | 1773 | $2,085 | $1.18 | 1d | 1 | 0.63mi |
| 19405 Bear Grass Dr Elgin, TX | 3.0 | 2.0 | 1495 | $1,760 | $1.18 | 43d | 1 | 0.98mi |
| 13817 County Line Rd Elgin, TX | 1.0–3.0 | 1.0–2.0 | 937 | $1,890 | $2.02 | 1d | 6 | 1.10mi |
| 101 Bandara Woods Blvd Elgin, TX | 3.0 | 2.0 | 1499 | $1,769 | $1.18 | 14d | 1 | 1.13mi |
HOA detail
- Monthly dues
- $35 · $420/yr
Listing history 14 events
-
2026-06-18days on market $212,990 Active 26 DOM
-
2026-06-17days on market $212,990 Active 25 DOM
-
2026-06-16days on market $212,990 Active 24 DOM
Show marketing remark (535 chars)
Step through the front porch into a foyer that leads to two bedrooms and a full bath near the front of the home. A coat closet and linen storage are located just off the hallway for added convenience. At the center of the home, the kitchen opens to the family room, creating a connected main living area. The primary bedroom is located at the back and features a walk-in closet and a primary bath. A patio is accessible through the family room, and the two-car garage connects to the home through a hallway near the secondary bedrooms.
-
2026-06-15days on market $212,990 Active 23 DOM
-
2026-06-13days on market $212,990 Active 21 DOM
-
2026-06-09days on market $212,990 Active 17 DOM
-
2026-06-08days on market $212,990 Active 16 DOM
-
2026-06-07days on market $212,990 Active 15 DOM
-
2026-06-04days on market $212,990 Active 12 DOM
-
2026-06-03days on market $212,990 Active 11 DOM
-
2026-06-02days on market $212,990 Active 10 DOM
-
2026-06-01days on market $212,990 Active 9 DOM
-
2026-05-31days on market $212,990 Active 8 DOM
-
2026-05-16$250,615 Active 535-char remark
Show marketing remark (535 chars)
Step through the front porch into a foyer that leads to two bedrooms and a full bath near the front of the home. A coat closet and linen storage are located just off the hallway for added convenience. At the center of the home, the kitchen opens to the family room, creating a connected main living area. The primary bedroom is located at the back and features a walk-in closet and a primary bath. A patio is accessible through the family room, and the two-car garage connects to the home through a hallway near the secondary bedrooms.
ⓘ Source: listings_history table (triggers on properties + properties_extension) + one-shot
backfill from property_details.listing_events for pre-trigger history.
Nearby sold comps map
Loading sold comps map…
Walkable amenities ~0.75 mi
Loading nearby amenities…
Taxation est. · year 1
- Rental income
- $25,102
- − Mortgage interest
- −$11,931
- − Property taxes
- −$3,195
- − Insurance
- −$1,065
- − Repairs & maintenance
- −$2,008
- − Management
- −$2,008
- − HOA
- −$420
- − Depreciation
- −$6,196
- Taxable loss
- −$1,721
- Est. tax savings @ 24.0%
- +$413
- After-tax cash flow
- $2,161/yr
For passive investors: Depreciation is non-cash, so a rental often shows a tax loss while cash-flowing — sheltering income. Rental losses are passive: they offset passive income freely, and up to $25,000/yr can offset ordinary (W-2) income if you actively participate and your MAGI is under $100k (phasing out to $0 by $150k); unused losses carry forward. On sale, claimed depreciation is recaptured at up to 25%, and gains may owe capital-gains tax (a 1031 exchange can defer both). Figures are a year-1 estimate at your 24.0% rate — not tax advice; consult a CPA.
Condition & rehab AI · 12 photos
This home is in excellent condition with modern finishes and a well-maintained exterior. It is move-in ready and would benefit from minor exterior updates to enhance its curb appeal and value.
Value-add opportunities
- Resale Paint exterior trim — Enhances curb appeal and can increase home value.
- Resale Replace window blinds — Improves home aesthetics and can increase home value.
- Both Install smart home technology — Enhances home functionality and can increase both resale and rental value.
- Both Add outdoor lighting — Enhances curb appeal and can increase both resale and rental value.
Renovation cost estimate screening
Value-add ROI direction
- Resale Paint exterior trim — Enhances curb appeal and can increase home value. ↑
- Resale Replace window blinds — Improves home aesthetics and can increase home value. ↑
- Both Install smart home technology — Enhances home functionality and can increase both resale and rental value. ↑
- Both Add outdoor lighting — Enhances curb appeal and can increase both resale and rental value. ↑
ⓘ Cost ranges are severity-bucket heuristics (US national rule-of-thumb). Get contractor quotes + a written scope before underwriting a rehab budget.
Schools (NCES district)
- District
- Elgin ISD
- NCES district ID
- 4818360
- Math proficiency
- 17% ▼ -9.00%
- Reading proficiency
- 26% ▼ -5.00%
- Median HH income
- $55,176
- Composite
- 19.62/100
- National rank
- #8749
- State rank
- #741 of 826 in TX
Livability — Elgin
- Score
- 74/100
- State rank
- #167
- US rank
- #4404
Category grades
Schools grade is shown separately in the Schools card above.
Census & demographics
- Census place
- Elgin, TX
- County
- Bastrop County · 68,601 people
- City population
- 27,860
- Metro
- Austin-Round Rock-Georgetown, TX
- Population (ZIP)
- 30,411
- Household income
- $98,534
- Rent vs Own
- Severe rent burden
- 235.0
Population outlook (Travis County) Hauer SSP2
- Today (2025)
- 1,545,133 people
- By 2030
- 1,729,269 · +11.9%
- By 2040
- 2,097,596 · +35.8%
- By 2050
- 2,463,890 · +59.5%
- By 2075
- 3,249,374 · +110.3%
- By 2100
- 3,801,868 · +146.1%
Race, ethnicity, and origin ACS 2023
- Neighborhood character
- Diverse neighborhood (Simpson 0.64)
- Race & ethnicity
- Hispanic / Latino 46% White 38% Two or more races 19% Black 11% Native American 1%
- Hispanic origin (detail)
- Mexican 38%
- Common ancestry
- Slovak 2% Italian 2% Romanian 1%
- Foreign-born
- 17% · Canada, Vietnam
- Languages at home
- 63% English-only · Spanish 36%
Political lean MEDSL · Travis
- 2024 margin
- Solid D (+39.3) · D 68.8% · R 29.4% · Other 1.8%
- 2008→2024 swing
- +9.9pp toward D · 2008: 29.4pp · 2024: 39.3pp
- All cycles
- 2024: D+39.3 2020: D+45.0 2016: D+38.9 2012: D+23.9 2008: D+29.4
Not yet ingested
- Civics
- —
Market trends
- HPI YoY
- ▲ 29.47%
- Current HPI
- 416.87
- Rent YoY
- ▲ 3.12%
- Metro
- Austin-Round Rock-Georgetown, TX
- State GDP YoY
- ▲ 3.95%
- F500 in state
- 110
Industry mix (Fortune 500 HQ in TX)
| Industry | F500 HQs | Revenue |
|---|---|---|
| Energy | 16 | $1,198B |
|
||
| Technology | 5 | $198B |
|
||
| Engineering / Construction | 4 | $72B |
|
||
| Energy Services | 3 | $60B |
|
||
| Utilities | 3 | $41B |
|
||
| Healthcare | 2 | $330B |
|
||
Price history
-11.9% since first listed5 events — show timeline
- 2026-06-16 Relisted — Zillow
- 2026-06-16 Delisted — Zillow
- 2026-06-12 Price Changed $220,917 Zillow
- 2026-05-23 Listed $212,990 Unlock MLS
- 2026-05-16 Listed $250,615 Zillow
Cash-flow waterfall
monthlySold comps — $/sqft
last 12 mo · ≤1 miLoading sold comps…