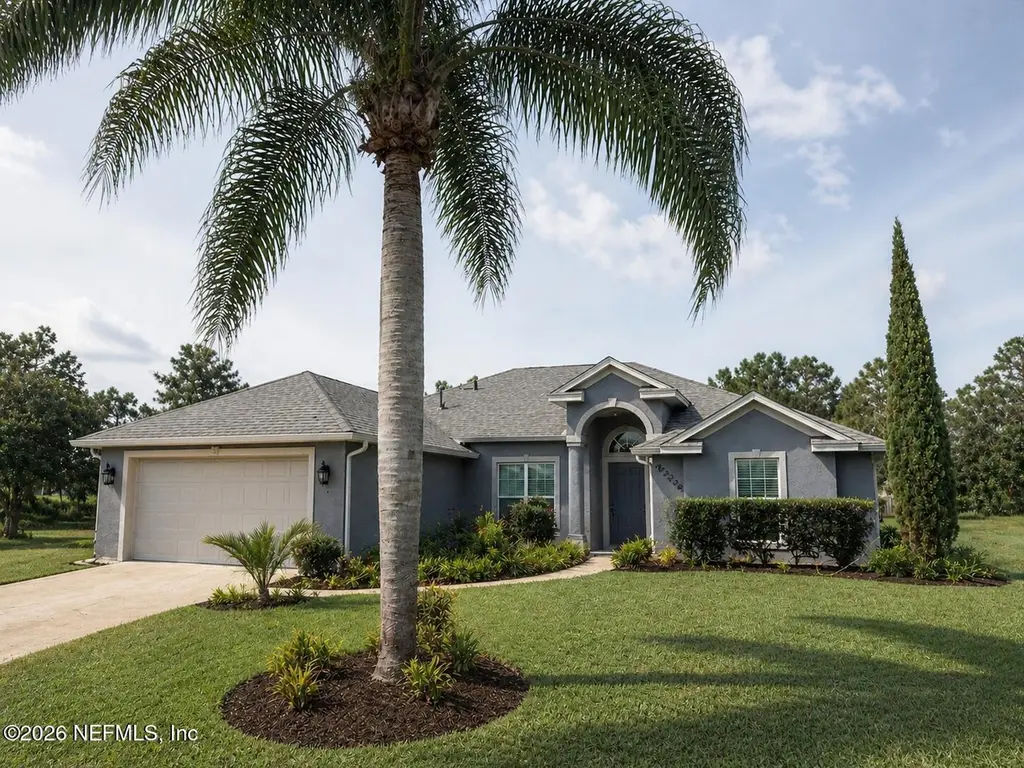
4728 Innisbrook Ct N · St. Augustine Shores, FL
Flood risk 1/10 · Minimal
- FEMA flood zone
- X (unshaded)
- Chance of flooding over 30 yrs
- 0.0%
- Est. flood insurance / yr
- $507 – $1,088
Fire risk 4/10 · Minor
- Est. fire insurance / yr
- $947 – $1,759
Heat risk 9/10 · Severe
- Hot days now (above 107°F)
- 7 days/yr
- Hot days in 30 yrs
- 21 days/yr
Wind risk 9/10 · Severe
- Chance of severe wind over 30 yrs
- 99.0%
Air-quality risk 2/10 · Minimal
- Unhealthy air days now
- 2 days/yr
- Unhealthy air days in 30 yrs
- 2 days/yr
Risk factors via First Street. Map © Google.
Why this score? — see what drove the D grade
The composite is a weighted blend of 9 inputs, each scored 0–100. Each bar is that input's sub-score; the figure is the points it added to the 100-point composite (weight × sub-score).
- ARV discount +11.2/15.0
- Cash flow +7.7/30.0
- Appreciation +6.4/10.0
- Schools +6.4/10.0
- Rent growth +2.5/5.0
- Livability +2.5/5.0
- Condition / age +2.5/5.0
- DSCR +1.8/10.0
- 1% rule +1.6/10.0
$370,000
🖨 Deal sheet (PDF) 📄 Offer letter ✓ Due diligence
Listing remarks
Welcome to this beautifully maintained home offering the perfect blend of comfort, space, and serene outdoor living. Nestled on a picturesque lot with a peaceful lake view, this property delivers both privacy and a true Florida lifestyle. Step inside to find a bright and open floor plan with soaring ceilings and an abundance of natural light. The living areas flow seamlessly, creating an inviting space ideal for both everyday living and entertaining. The kitchen features ample cabinetry, generous counter space, and a functional layout that opens to a cozy dining area overlooking the backyard and water. The spacious primary suite offers a relaxing retreat with tray ceilings and a large en-su
Key facts
- Shaded seating area
- Lake view
- Outdoor living
Tags
Property features AI
Finance
- Financial info: Property currently used as residential and investment
- HOA & community: Homeowners association with $65 annual fee; Sidewalks in the community; Not a senior community
Exterior
- Parking: Attached garage with garage door opener; Additional parking; 2-car garage
- Utilities: Public sewer; Electricity connected; Sewer connected; Water connected
- Home design: Single-family home; One story
- Construction: Shingle roof
- Exterior features: Rear screened porch; Porch; Pond on the property; Located on a cul-de-sac; On golf course; Asphalt road
Interior
- Kitchen: Dishwasher; Disposal; Electric range; Ice maker; Refrigerator
- Bedrooms: 3 bedrooms
- Flooring: Carpet; Tile; Vinyl
- Bathrooms: 2 full bathrooms
- Heating & cooling: Central heating (electric); Central air conditioning (electric)
- Interior features: Breakfast bar; Ceiling fans; Eat-in kitchen; Entrance foyer; His and hers closets; Jack and Jill bathroom; Open floorplan; Primary bathroom with tub and separate shower; Primary bedroom on main floor; Split bedroom layout; Vaulted ceilings; Walk-in closets
- Laundry & utility: In-unit laundry on lower level; Laundry sink; Washer hookup; Electric water heater
Neighborhood map
What this means for you Summary
Snapshot
- This is a 3-bed/2.0-bath single-family listed at $370k.
Deal economics
- At list price, monthly cash flow is $-422 ($-5k/yr) — negative.
- To cash-flow at today's rent, offer at most $296k (20.1% below list).
- To meet the 1% rule (rent ≥ 1% of price), the offer needs to be $243k (34.2% below list).
- Recommended offer: $243k (34.2% below list) — sets the bar for 1% rule.
- Cap rate 4.9% vs local median 3.4% in St. Augustine Shores — top-decile yield for the area; either an underpriced asset or a hidden risk that comps aren't pricing in. Stress-test before assuming the spread holds.
Location & tenants
- Location reads: area grade D — affects rentability + tenant quality, not the cash-flow math above.
- St. Johns (rural): math 75% / reading 73% proficiency, ranked #2 of 73 in FL (top 3%) — strong family-tenant draw, lease renewals of 3-5y typical; only 20% free/reduced lunch — higher-income household profile.
- Zoned schools: Otis A. Mason Elementary School (math 76% / reading 60%, grade B+, #425 of 2,144 statewide, top 20%, 719 students, 45% FRL); Gamble Rogers Middle School (math 61% / reading 55%, grade B, #151 of 571 statewide, top 27%, 925 students, 47% FRL); Pedro Menendez High School (math 31% / reading 54%, grade F, #264 of 667 statewide, top 41%, 1,519 students, 39% FRL) — zoned schools average 44% FRL vs 20% district-wide (24 pts higher); higher-poverty schools than district average — tighter screening recommended.
- Zoned-school proficiency averages 56% at this address vs 74% district-wide (-18 pts) — the specific schools serving this property underperform the St. Johns average; the district grade overstates school quality for this exact location.
- Market conditions: 42 active listings in the ZIP; 2 comparable units currently listed for rent nearby; 5,575 units permitted in St. Johns County in 2024 (584 in 5+ unit buildings).
Forward outlook
- In year one you build about $13k of equity ($3k loan paydown + $11k appreciation (2.9% local appreciation)).
- St. Johns County population projected at +60% by 2050 — long-run rental-demand tailwind backs the buy-and-hold thesis.
- By year 3, paydown + projected appreciation supports a ~$33k cash-out refi (75% LTV) — recoverable capital for the next deal without selling this one.
Negotiation context
- Only 10 days on market — expect competitive offers; lowballing is unlikely to land.
- 2 sale attempts with the ask held roughly flat each time — persistent listings suggest the price (not the market) is what's stuck; bring a comps-based counter.
- Current owner paid $26k; list at $370k implies a 1296% gain — meaningful room to come down on a strong offer.
Risks & watch-outs
- Climate carrying-cost: severe wind risk, 99% chance of damaging wind over 30y; extreme-heat days projected 7→21/yr by 2055 (HVAC capex compounding) — expect insurance premiums to compound above CPI over the hold.
Questions for the listing agent
- What do current leases actually rent for vs. the listed asking? Can we see a recent rent roll and the last 12 months of T-12 income?
- What does the HOA fee cover, when was the last increase, and are there any pending special assessments or reserve-fund shortfalls?
- Is there a deadline driving the sale (1031 exchange, divorce, estate, relocation)? That informs how much negotiation room exists.
- The area grade is low — what's the realistic commute time and amenity access for the typical tenant pool here? Any planned neighborhood developments (good or bad) we should know about?
- What's the average days-on-market for RENTAL listings here right now (not sales)? A rising rental-DOM trend means longer vacancies and softer asking-rent achievability than the comps imply.
- What's the recent tenant-quality profile in this submarket — average credit score on applications, eviction rate, late-payment / NSF rate, and stable-employment percentage? A property-management company in the area should have these aggregated.
- How much new for-sale + rental construction is in the pipeline within 1–3 miles? Heavy new supply typically softens prices + rents 12–24 months out; constrained supply supports both.
Investment metrics
- 1% rule
- 0.66% ✗
- Cap rate
- 4.93%
- Cash-on-cash
- -4.88%
- DSCR
- 0.78
- GRM
- 12.7
CMA / ARV
- ARV (on-the-fly)
- $402,816
- Comps found
- 12
Show comp detail 12 sales within ~0.75 mi
| Address | Dist | Beds/Ba | Sqft | Sold | Price | $/sf | Match |
|---|---|---|---|---|---|---|---|
| 4728 Innisbrook Ct N | 0.00mi | 3/2.0 | 2,098 (0%) | 0mo | $375,000 | $179 | 100 |
| 4956 Cypress Links Blvd | 0.53mi | 3/2.0 | 2,159 (+3%) | 6mo | $385,000 | $178 | 65 |
| 4535 Golf Ridge Dr | 0.35mi | 3/2.0 | 1,885 (-10%) | 3mo | $390,000 | $207 | 64 |
| 5013 Cypress Links Blvd | 0.69mi | 3/2.0 | 1,967 (-6%) | 4mo | $370,000 | $188 | 54 |
| 4120 Palmetto Bay Dr | 0.70mi | 3/2.0 | 2,122 (+1%) | 14mo | $445,000 | $210 | 54 |
| 4917 Cypress Links Blvd | 0.41mi | 3/2.0 | 1,846 (-12%) | 10mo | $355,000 | $192 | 53 |
| 4405 Golf Ridge Dr | 0.47mi | 3/2.0 | 1,873 (-11%) | 9mo | $307,000 | $164 | 52 |
| 5324 Cypress Links Blvd | 0.71mi | 3/2.0 | 2,202 (+5%) | 13mo | $375,000 | $170 | 48 |
| 5319 Cypress Links Blvd | 0.74mi | 3/2.0 | 2,199 (+5%) | 14mo | $330,000 | $150 | 46 |
| 5021 Cypress Links Blvd | 0.71mi | 3/2.0 | 1,849 (-12%) | 2mo | $400,000 | $216 | 45 |
| 5349 Cypress Links Blvd | 0.67mi | 4/2.0 (+1) | 1,848 (-12%) | 2mo | $450,000 | $244 | 42 |
| 138 Patriot Ln | 0.65mi | 4/2.0 (+1) | 1,844 (-12%) | 11mo | $384,900 | $209 | 36 |
Match score weights: distance 35% · size 25% · config 20% · recency 20%. Top-matched comps best support the ARV.
Projected returns pro-forma
2.87% appreciation · 3.0% rent growth · sell at horizon
- IRR
- 2.5%
- Equity multiple
- 1.15×
- Total profit
- $15,047
- Equity at exit
- $163,624
- IRR
- 6.1%
- Equity multiple
- 1.91×
- Total profit
- $94,347
- Equity at exit
- $250,052
Cash invested: $103,600 (down + closing). Projections, not guarantees.
Landlord ↔ Tenant lean methodology
- Overall (STATE)
- 87 Strongly Landlord-Friendly
- State Florida
- 87 Strongly Landlord-Friendly · R+3
- County
- — inherits STATE
- City
- — inherits STATE
ZIP-level market 32033
- Home prices YoY
- 1.0%
- Active inventory
- 42
- Price-to-rent
- 12.7×
Monthly cashflow live
- Estimated rent
- $2,434 medium interval (Pro) →
- Mortgage (P&I)
- −$1,940
- Tax from tax record
- −$245 /mo · $2,938/yr
- Insurance
- −$154
- HOA
- −$5
- Vacancy / Maint / Mgmt
- −$511
- Net cashflow
- $-422
Break-even live
Sensitivity live
| Price | -10% $-212 | -5% $-317 | +0% $-422 | +5% $-526 | +10% $-631 |
|---|---|---|---|---|---|
| Rent | -10% $-614 | -5% $-518 | +0% $-422 | +5% $-325 | +10% $-229 |
| Rate | -1.0pp $-235 | -0.5pp $-327 | base $-422 | +0.5pp $-517 | +1.0pp $-615 |
UW: 25.0% down · 7.5% · 30yr · 1.5% tax · 5.0% vac · 8.0% maint · 8.0% mgmt
Financing live
Cash to close
- Down payment
- $92,500
- Closing costs
- $11,100
- Reserves months
- —
- Total cash needed
- —
Loan-product check · same deal, 3 products live
Conventional
25% down · 7.5% · 30yr
- Down + closing
- —
- Monthly P&I
- —
- Monthly cashflow
- —
- DSCR
- —
- Eligible?
- —
Personal DTI + credit; lowest rate.
DSCR
20% down · 8.5% · 30yr
- Down + closing
- —
- Monthly P&I
- —
- Monthly cashflow
- —
- DSCR
- —
- Eligible?
- —
No personal income docs; deal must DSCR.
Hard money
10% down · 12.0% · 12mo
- Down + closing
- —
- Monthly P&I
- —
- Monthly cashflow
- —
- DSCR
- —
- Eligible?
- —
Short-term bridge; refi at stabilization.
Rent comps 2 comps
| Address | Beds | Baths | Sqft | Rent | $/sqft | DOM | Units | Dist |
|---|---|---|---|---|---|---|---|---|
| 4989 Cypress Links Blvd Elkton, FL | 3.0 | 2.0 | 2332 | $2,620 | $1.12 | 21d | 1 | 0.60mi |
| 5033 Coquina Crossing Dr Elkton, FL | 3.0 | 2.0 | 1600 | $2,199 | $1.37 | 4d | 1 | 0.64mi |
HOA detail
- Monthly dues
- $5 · $60/yr
- Likely covers
- water
Listing history 7 events
-
2026-05-11status Pending
-
2026-05-01$370,000 Active
-
2025-06-22historical $2,300
-
2025-05-29$2,300
-
1996-05-08soldstatus $26,500
-
1988-05-01soldstatus $1,000,000
-
1986-12-01soldstatus $650,700
ⓘ Source: listings_history table (triggers on properties + properties_extension) + one-shot
backfill from property_details.listing_events for pre-trigger history.
Tax reassessment forecast FL · Resets to sale price
- Current annual tax
- $2,938 · $245/mo
- Projected year-2 tax
- $3,071 · $256/mo
- Expected delta
- +$133/yr (+$11/mo · 4.5%)
ⓘ Screening estimate from a state-policy table — verify with the county assessor before closing.
Climate risk First Street
- Flood 1/10 Low FEMA zone X (unshaded) · 0% chance over 30 yrs
- Wildfire 4/10 Moderate
- Heat 9/10 Extreme 7 d/yr ≥107°F today · 21 d/yr by 30 yrs out
- Wind 9/10 Extreme 99% chance of damaging wind over 30 yrs
- Air quality 2/10 Low 2 unhealthy d/yr today · 2 by 30 yrs out
Nearby sold comps map
Loading sold comps map…
Walkable amenities ~0.75 mi
Loading nearby amenities…
Taxation est. · year 1
- Rental income
- $29,205
- − Mortgage interest
- −$20,726
- − Property taxes
- −$2,938
- − Insurance
- −$1,850
- − Repairs & maintenance
- −$2,336
- − Management
- −$2,336
- − HOA
- −$60
- − Depreciation
- −$10,764
- Taxable loss
- −$11,805
- Est. tax savings @ 24.0%
- +$2,833
- After-tax cash flow
- $-2,226/yr
For passive investors: Depreciation is non-cash, so a rental often shows a tax loss while cash-flowing — sheltering income. Rental losses are passive: they offset passive income freely, and up to $25,000/yr can offset ordinary (W-2) income if you actively participate and your MAGI is under $100k (phasing out to $0 by $150k); unused losses carry forward. On sale, claimed depreciation is recaptured at up to 25%, and gains may owe capital-gains tax (a 1031 exchange can defer both). Figures are a year-1 estimate at your 24.0% rate — not tax advice; consult a CPA.
Schools (NCES district)
- District
- St. Johns
- NCES district ID
- 1201740
- Math proficiency
- 75% ▼ -5.00%
- Reading proficiency
- 73% ▼ -2.00%
- Median HH income
- $66,842
- Composite
- 64.31/100
- National rank
- #556
- State rank
- #2 of 73 in FL
Livability — St. Augustine Shores
No livability data for this city. (Only ~50 U.S. cities are tracked.)
Census & demographics
- Population (ZIP)
- 4,555
Population outlook (St. Johns County) Hauer SSP2
- Today (2025)
- 303,941 people
- By 2030
- 342,590 · +12.7%
- By 2040
- 417,328 · +37.3%
- By 2050
- 487,011 · +60.2%
- By 2075
- 635,395 · +109.1%
- By 2100
- 717,469 · +136.1%
Race, ethnicity, and origin ACS 2023
- Neighborhood character
- Predominantly White (80%)
- Race & ethnicity
- White 80% Hispanic / Latino 10% Two or more races 9% Black 4% Asian 2%
- Hispanic origin (detail)
- Mexican 4%
- Common ancestry
- Lithuanian 4% Romanian 3% Italian 2%
- Foreign-born
- 6% · Canada, Jamaica
- Languages at home
- 95% English-only · Spanish 4% German/W. Germanic 1%
Political lean MEDSL · St. Johns
- 2024 margin
- Solid R (+31.4) · D 33.9% · R 65.2%
- 2008→2024 swing
- +0.2pp no change · 2008: -31.6pp · 2024: -31.4pp
- All cycles
- 2024: R+31.4 2020: R+26.7 2016: R+33.4 2012: R+37.8 2008: R+31.6
Not yet ingested
- Civics
- —
Market trends
- HPI YoY
- ▲ 2.87%
- Current HPI
- 297.5438
- Rent YoY
- —
- Metro
- —
- State GDP YoY
- ▲ 3.28%
- F500 in state
- 36
Industry mix (Fortune 500 HQ in FL)
| Industry | F500 HQs | Revenue |
|---|---|---|
| Industrial Technology | 2 | $29B |
|
||
| Insurance | 2 | $17B |
|
||
| Retail | 1 | $60B |
|
||
| Technology Distribution | 1 | $58B |
|
||
| Homebuilding | 1 | $35B |
|
||
| Technology Manufacturing | 1 | $35B |
|
||
Price history
-43.1% since first listed7 events — show timeline
- 2026-05-11 Pending — realMLS
- 2026-05-01 Listed $370,000 realMLS
- 2025-06-22 Rental Removed $2,300 BUILDIUM
- 2025-05-29 Listed for Rent $2,300 BUILDIUM
- 1996-05-08 Sold (Public Records) $26,500 Public Records
- 1988-05-01 Sold (Public Records) $1,000,000 Public Records
- 1986-12-01 Sold (Public Records) $650,700 Public Records
Property tax history
+3.8%/yrLatest (2025): $2,938 · +13.5% YoY. Source: county tax records.
Cash-flow waterfall
monthlySold comps — $/sqft
last 12 mo · ≤1 miLoading sold comps…