 Duplex
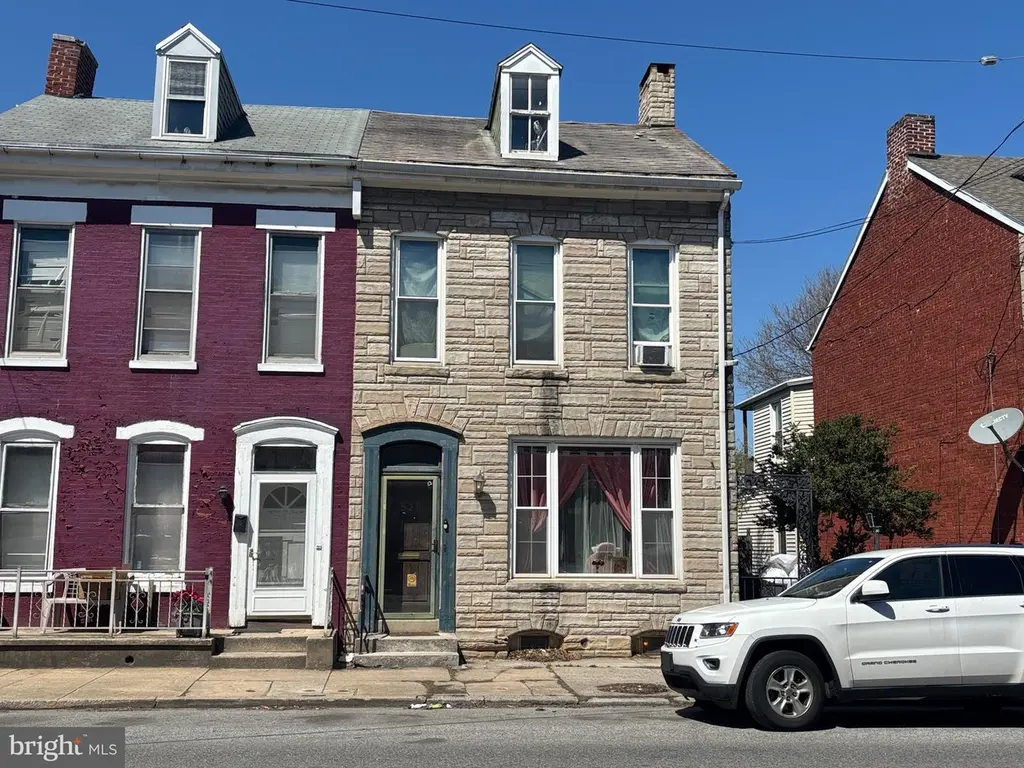
521 W Philadelphia St · York, PA
Flood risk 1/10 · Minimal
- FEMA flood zone
- X (unshaded)
- Chance of flooding over 30 yrs
- 0.0%
- Est. flood insurance / yr
- $473 – $860
Fire risk 1/10 · Minimal
- Est. fire insurance / yr
- $511 – $949
Heat risk 6/10 · Moderate
- Hot days now (above 103°F)
- 7 days/yr
- Hot days in 30 yrs
- 16 days/yr
Wind risk 4/10 · Minor
- Chance of severe wind over 30 yrs
- 10.0%
Air-quality risk 3/10 · Minor
- Unhealthy air days now
- 3 days/yr
- Unhealthy air days in 30 yrs
- 5 days/yr
Risk factors via First Street. Map © Google.
Why this score? — see what drove the B grade
The composite is a weighted blend of 9 inputs, each scored 0–100. Each bar is that input's sub-score; the figure is the points it added to the 100-point composite (weight × sub-score).
- Cash flow +29.9/30.0
- ARV discount +13.1/15.0
- DSCR +10.0/10.0
- 1% rule +8.9/10.0
- Rent growth +4.1/5.0
- Livability +3.8/5.0
- Condition / age +2.5/5.0
- Schools +0.8/10.0
- Appreciation +0.0/10.0
$164,900
🖨 Deal sheet 📄 Offer letter ✓ Due diligence
Multi-family units
County records classify this as Multi-Family (2-4 Unit). Listing-text estimate: 2 units. confirmed
Listing remarks
Good quality 2 unit with garage that has own electric service and is rented separately. Private fenced rear yard, Tenants pay own heat and hot water, all leases are month to month allowing flexibility for changes. Unit 1 tenant @$950/mo has been in place 1 year and unit is recently updated with paint and new flooring as well as newer furnace and also features central a/c and basement laundry access. Unit 2 tenant @ $765/mo has been in place 4 years and has a hookup for stack unit (they are using the space for a fridge currently) and the garage tenant has been in place since 2017 @ $175/mo - All together $1,890/mo income with flexibility available for changes. (pics of 1'st floor unit showin
Key facts
- 6,821 sq ft lot
- 2 garage spots
- Built 1900
Property features AI
Finance
- Other: Assessed and tax information available (assessor sources noted)
- Financial info: Total actual rent: $22,680; Units are leased month-to-month; Rent control not in effect
Exterior
- Parking: Detached garage (front entry) with 2 spaces; On-street parking available
- Utilities: Public water; Public sewer; Natural gas available; Electric service available
- Home design: Semi-detached property; Two total units
- Construction: Brick exterior; Permanent foundation; Assessor-provided year built information
- Exterior features: Brick construction; Above-grade and below-grade structures noted; No tidal water on the lot; Fee simple ownership
Interior
- Bedrooms: Two 2-bedroom units
- Heating & cooling: Forced air heating; Electric baseboard heating; Central air conditioning; Hot water available by electric and natural gas
- Interior features: Two-unit semi-detached building; All units currently leased month-to-month
Neighborhood map
What this means for you Summary
Snapshot
- This is a 2 × 2-bed/?-bath units multifamily listed at $165k.
Deal economics
- At list price, monthly cash flow is $609 ($7k/yr) — positive. Per door: $304/mo.
- The deal already cash-flows at list — no discount required.
- Meets the 1% rule at list price ($2k rent vs $165k).
- Cap rate 10.7% vs local median 5.0% in York — top-decile yield for the area; either an underpriced asset or a hidden risk that comps aren't pricing in. Stress-test before assuming the spread holds.
Location & tenants
- Location reads 75/100 on livability (#427 in PA, #3,987 nationally) — a middle-class / working-renter tenant base. Strengths: cost of living A+, health & safety A+, housing A; Watch: amenities D+, crime F, employment F.
- York City SD (urban): math 4% / reading 16% proficiency, ranked #534 of 539 in PA (top 99%) — low school quality limits family demand, transient renter base, plan for 1-2y turnover; 72% free/reduced lunch — lower-income household profile, screen leases tightly.
- Market conditions: Rents rising fast (+6.4%/yr); 63 active listings in the ZIP; 18 comparable units currently listed for rent nearby; rentals lingering (median 44d on market — plan ~5-8 weeks vacancy on turnover, expect pricing pressure); 50% of comp listings sitting > 30 days — soft ceiling on asking rent; lower-income renter base — watch delinquency; 1,328 units permitted in York County in 2024 (338 in 5+ unit buildings).
- At $2,297/mo this rent would consume 64% of the median local household income ($43k/yr) (locally 1360% of renters already pay >50% of income on rent) — very limited rent-growth headroom before tenants either downsize or default.
Forward outlook
- Local home prices are declining (-3.0%/yr); year-one equity from $1k of loan paydown is wiped out by about $5k of value loss. Plan a longer hold.
- At projected returns (-3.0% appreciation + 6.4% rent growth), your $46k cash investment doubles in ~7 years — after that, you're playing with house money.
Negotiation context
- Only 1 days on market — expect competitive offers; lowballing is unlikely to land.
- 5 sale attempts since 19y ago with the ask held roughly flat each time — persistent listings suggest the price (not the market) is what's stuck; bring a comps-based counter.
- Current owner paid $100k; list at $165k implies a 65% gain — meaningful room to come down on a strong offer.
Risks & watch-outs
- Watch-outs: built in 1900 — expect roof / HVAC / electrical / plumbing capex.
- Climate carrying-cost: extreme-heat days projected 7→16/yr by 2055 (HVAC capex compounding) — expect insurance premiums to compound above CPI over the hold.
Questions for the listing agent
- Can we see the unit-by-unit rent roll, current vacancy, and any below-market leases? What's the average tenancy length?
- What capital expenditures (roof, boiler, parking lot, exteriors) have been made in the last 5 years, and what's planned in the next 2?
- Built in 1900 — when were the roof, HVAC, electrical panel, plumbing, and water heater last replaced?
- Is there a deadline driving the sale (1031 exchange, divorce, estate, relocation)? That informs how much negotiation room exists.
- Crime grade is F in this area — have there been break-ins, vandalism, or insurance claims at this property in the last 3 years? What carrier currently insures it and at what premium?
- What's the average days-on-market for RENTAL listings here right now (not sales)? A rising rental-DOM trend means longer vacancies and softer asking-rent achievability than the comps imply.
- What's the recent tenant-quality profile in this submarket — average credit score on applications, eviction rate, late-payment / NSF rate, and stable-employment percentage? A property-management company in the area should have these aggregated.
- How much new apartment / multifamily construction is in the pipeline within 1–3 miles? Heavy new supply (>2% of stock underway) typically softens rents 12–24 months out; light construction supports rent growth.
Investment metrics
- 1% rule
- 1.39% ✓
- Cap rate
- 10.72%
- Cash-on-cash
- 15.82%
- DSCR
- 1.70
- GRM
- 6.0
CMA / ARV
- ARV (on-the-fly)
- $188,264
- Comps found
- 12
Show comp detail 12 sales within ~0.75 mi
| Address | Dist | Beds/Ba | Sqft | Sold | Price | $/sf | Match |
|---|---|---|---|---|---|---|---|
| 521 W Philadelphia St | 0.00mi | 4/— | 2,046 (+10%) | 0mo | $170,000 | $83 | 83 |
| 766 W Philadelphia St | 0.36mi | 4/2.0 | 1,908 (+2%) | 5mo | $246,000 | $129 | 75 |
| 831 Linden Ave | 0.42mi | 4/— | 1,908 (+2%) | 4mo | $170,000 | $89 | 73 |
| 137 N West St | 0.14mi | 5/— (+1) | 2,076 (+11%) | 1mo | $155,000 | $75 | 69 |
| 1010 W Princess St | 0.64mi | 4/2.0 | 1,840 (-1%) | 3mo | $185,000 | $101 | 65 |
| 627 N Hartley St | 0.52mi | 4/2.0 | 1,776 (-5%) | 4mo | $180,000 | $101 | 64 |
| 829 W Princess St | 0.51mi | 3/— (-1) | 1,776 (-5%) | 1mo | $165,000 | $93 | 63 |
| 729 W Philadelphia St | 0.30mi | 3/3.0 (-1) | 1,992 (+7%) | 9mo | $220,000 | $110 | 58 |
| 632 Roosevelt Ave | 0.43mi | 3/— (-1) | 2,058 (+10%) | 0mo | $215,000 | $104 | 57 |
| 948 W Princess St | 0.60mi | 4/— | 2,004 (+8%) | 4mo | $160,000 | $80 | 56 |
| 828 W Princess St | 0.52mi | 3/2.0 (-1) | 2,013 (+8%) | 4mo | $175,000 | $87 | 54 |
| 737 Linden Ave | 0.37mi | 3/— (-1) | 2,086 (+12%) | 8mo | $218,000 | $105 | 51 |
Match score weights: distance 35% · size 25% · config 20% · recency 20%. Top-matched comps best support the ARV.
Projected returns pro-forma
-3.0% appreciation · 6.37% rent growth · sell at horizon
- IRR
- 10.6%
- Equity multiple
- 1.44×
- Total profit
- $20,168
- Equity at exit
- $24,587
- IRR
- 22.4%
- Equity multiple
- 3.23×
- Total profit
- $103,193
- Equity at exit
- $14,258
Cash invested: $46,172 (down + closing). Projections, not guarantees.
Landlord ↔ Tenant lean methodology
- Overall (STATE)
- 62 Landlord-Friendly
- State Pennsylvania
- 62 Landlord-Friendly · EVEN
- County
- — inherits STATE
- City
- — inherits STATE
ZIP-level market 17401
- Home prices YoY
- -16.5%
- Rents YoY
- 6.4%
- Active inventory
- 63
- Price-to-rent
- 12.0×
Monthly cashflow live
- Estimated rent
- $2,297 high interval (Pro) →
- Mortgage (P&I)
- −$865
- Tax from tax record
- −$273 /mo · $3,271/yr
- Insurance
- −$69
- HOA
- −$0
- Vacancy / Maint / Mgmt
- −$482
- Net cashflow
- $609
Break-even live
2-unit breakdown (identical units grouped — click to expand)
| Units | Beds | Baths | Est. rent |
|---|---|---|---|
| 2× units | 2 | — | $2,298 |
| #1 | 2 | — | $1,149 |
| #2 | 2 | — | $1,149 |
| Total (2 units) | $2,297 | ||
UW: 25.0% down · 7.5% · 30yr · 1.5% tax · 5.0% vac · 8.0% maint · 8.0% mgmt
Financing live
Cash to close
- Down payment
- $41,225
- Closing costs
- $4,947
- Reserves months
- —
- Total cash needed
- —
Loan-product check · same deal, 3 products live
Conventional
25% down · 7.5% · 30yr
- Down + closing
- —
- Monthly P&I
- —
- Monthly cashflow
- —
- DSCR
- —
- Eligible?
- —
Personal DTI + credit; lowest rate.
DSCR
20% down · 8.5% · 30yr
- Down + closing
- —
- Monthly P&I
- —
- Monthly cashflow
- —
- DSCR
- —
- Eligible?
- —
No personal income docs; deal must DSCR.
Hard money
10% down · 12.0% · 12mo
- Down + closing
- —
- Monthly P&I
- —
- Monthly cashflow
- —
- DSCR
- —
- Eligible?
- —
Short-term bridge; refi at stabilization.
Rent comps 18 comps
| Address | Beds | Baths | Sqft | Rent | $/sqft | DOM | Units | Dist |
|---|---|---|---|---|---|---|---|---|
| 588 Company St York, PA | 3.0 | 1.5 | 1416 | $1,475 | $1.04 | 43d | 1 | 0.09mi |
| 132 N West St York, PA | 4.0 | 1.0 | 1560 | $1,600 | $1.03 | 13d | 1 | 0.13mi |
| 231 Roosevelt Ave York, PA | 3.0 | 1.5 | 1584 | $1,750 | $1.10 | 13d | 1 | 0.18mi |
| 645 W Philadelphia St Unit 2ND FLOOR York, PA | 3.0 | 1.0 | 2124 | $1,100 | $0.52 | 43d | 1 | 0.19mi |
| 702 W Philadelphia St Unit 2 York, PA | 3.0 | 1.0 | 2154 | $1,375 | $0.64 | 43d | 1 | 0.25mi |
| 330 Smyser St York, PA | 5.0 | 1.0 | 1634 | $1,425 | $0.87 | 43d | 1 | 0.34mi |
| 121 S Belvidere Ave Unit 121 York, PA | 5.0 | 1.5 | 1846 | $1,450 | $0.79 | 43d | 1 | 0.35mi |
| 709 W Princess St York, PA | 5.0 | 1.0 | 1829 | $1,425 | $0.78 | 43d | 1 | 0.41mi |
| 289 Union St York, PA | 4.0 | 1.0 | 1450 | $1,600 | $1.10 | 43d | 1 | 0.45mi |
| 428 Smith St York, PA | 3.0 | 1.0 | 1522 | $1,350 | $0.89 | 13d | 1 | 0.56mi |
| 925 W College Ave York, PA | 4.0 | 1.0 | 1660 | $1,425 | $0.86 | 13d | 1 | 0.61mi |
| 537 W Jackson St York, PA | 3.0 | 2.0 | 1795 | $1,795 | $1.00 | 13d | 1 | 0.86mi |
| 213 Kurtz Ave York, PA | 5.0 | 1.0 | 1921 | $1,850 | $0.96 | 13d | 1 | 0.87mi |
| 119 W Jackson St York, PA | 4.0 | 1.0 | 1800 | $1,395 | $0.78 | 43d | 1 | 1.05mi |
| 514 S Duke St York, PA | 3.0 | 1.0 | 1289 | $1,625 | $1.26 | 21d | 1 | 1.09mi |
| 339 E Market St Unit 1 York, PA | 4.0 | 1.5 | 1600 | $1,650 | $1.03 | 21d | 1 | 1.18mi |
| 626 S Queen St York, PA | 3.0 | 1.0 | 1526 | $1,225 | $0.80 | 21d | 1 | 1.26mi |
| 511 E Philadelphia St Unit 2 York, PA | 3.0 | 1.0 | 2194 | $895 | $0.41 | 44d | 1 | 1.41mi |
Listing history 14 events
-
2026-05-04status Pending
-
2026-05-04status Active
-
2026-04-16status Pending
-
2026-04-15$164,900 Active
-
2026-04-11historical $164,900
-
2014-07-30historical
-
2013-02-03$94,900
-
2007-12-08historical
-
2007-08-01historical
-
2007-07-31soldstatus $100,000
-
2007-06-08$110,000
-
2007-06-08$110,000
-
1991-07-12soldstatus $51,900
-
1987-12-30soldstatus $39,900
ⓘ Source: listings_history table (triggers on properties + properties_extension) + one-shot
backfill from property_details.listing_events for pre-trigger history.
Tax reassessment forecast PA · Partial reset (capped growth)
- Current annual tax
- $3,271 · $273/mo
- Projected year-2 tax
- $3,271 · $273/mo
- Expected delta
- $0/yr ($0/mo · 0.0%)
ⓘ Screening estimate from a state-policy table — verify with the county assessor before closing.
Climate risk First Street
- Flood 1/10 Low FEMA zone X (unshaded) · 0% chance over 30 yrs
- Wildfire 1/10 Low
- Heat 6/10 Major 7 d/yr ≥103°F today · 16 d/yr by 30 yrs out
- Wind 4/10 Moderate 10% chance of damaging wind over 30 yrs
- Air quality 3/10 Moderate 3 unhealthy d/yr today · 5 by 30 yrs out
Nearby sold comps map
Loading sold comps map…
Walkable amenities ~0.75 mi
Loading nearby amenities…
Taxation est. · year 1
- Rental income
- $27,564
- − Mortgage interest
- −$9,237
- − Property taxes
- −$3,271
- − Insurance
- −$824
- − Repairs & maintenance
- −$2,205
- − Management
- −$2,205
- − Depreciation
- −$4,797
- Taxable income
- $5,024
- Est. tax owed @ 24.0%
- −$1,206
- After-tax cash flow
- $6,097/yr
For passive investors: Depreciation is non-cash, so a rental often shows a tax loss while cash-flowing — sheltering income. Rental losses are passive: they offset passive income freely, and up to $25,000/yr can offset ordinary (W-2) income if you actively participate and your MAGI is under $100k (phasing out to $0 by $150k); unused losses carry forward. On sale, claimed depreciation is recaptured at up to 25%, and gains may owe capital-gains tax (a 1031 exchange can defer both). Figures are a year-1 estimate at your 24.0% rate — not tax advice; consult a CPA.
Schools (NCES district)
- District
- York City SD
- NCES district ID
- 4226820
- Math proficiency
- 4% ▼ -7.00%
- Reading proficiency
- 16% ▼ -9.00%
- Median HH income
- $29,470
- Composite
- 7.61/100
- National rank
- #9943
- State rank
- #534 of 539 in PA
Livability — York
- Score
- 75/100
- State rank
- #427
- US rank
- #3987
Category grades
Schools grade is shown separately in the Schools card above.
Census & demographics
- Census place
- York, PA
- County
- York County · 278,806 people
- City population
- 184,764
- Metro
- York-Hanover, PA
- Population (ZIP)
- 18,570
- Household income
- $42,826
- Rent vs Own
- Severe rent burden
- 1360.0
Population outlook (York County) Hauer SSP2
- Today (2025)
- 454,205 people
- By 2030
- 457,407 · +0.7%
- By 2040
- 457,529 · +0.7%
- By 2050
- 448,261 · -1.3%
- By 2075
- 427,388 · -5.9%
- By 2100
- 384,218 · -15.4%
Race, ethnicity, and origin ACS 2023
- Neighborhood character
- Diverse neighborhood (Simpson 0.69)
- Race & ethnicity
- Hispanic / Latino 39% White 31% Black 24% Two or more races 15%
- Hispanic origin (detail)
- Mexican 5% Puerto Rican 22% Dominican 10%
- Common ancestry
- Romanian 2% Hispanic 1% Italian 1%
- Foreign-born
- 14% · Canada
- Languages at home
- 72% English-only · Spanish 25% French/Haitian/Cajun 2%
Political lean MEDSL · York
- 2024 margin
- Strong R (+25.3) · D 36.9% · R 62.1%
- 2008→2024 swing
- -11.7pp toward R · 2008: -13.6pp · 2024: -25.3pp
- All cycles
- 2024: R+25.3 2020: R+24.6 2016: R+29.3 2012: R+21.2 2008: R+13.6
Not yet ingested
- Civics
- —
Market trends
- HPI YoY
- ▼ -63.82%
- Current HPI
- 323.5537
- Rent YoY
- ▲ 6.37%
- Metro
- York-Hanover, PA
- State GDP YoY
- ▲ 1.68%
- F500 in state
- 34
Industry mix (Fortune 500 HQ in PA)
| Industry | F500 HQs | Revenue |
|---|---|---|
| Healthcare | 2 | $309B |
|
||
| Insurance | 2 | $27B |
|
||
| Telecommunications / Media | 1 | $124B |
|
||
| Industrial Distribution | 1 | $22B |
|
||
| Financial Services | 1 | $20B |
|
||
| Chemicals / Materials | 1 | $18B |
|
||
Price history
+313.3% since first listed14 events — show timeline
- 2026-05-04 Pending — BRIGHT MLS
- 2026-05-04 Relisted — BRIGHT MLS
- 2026-04-16 Pending — BRIGHT MLS
- 2026-04-15 Listed $164,900 BRIGHT MLS
- 2026-04-11 Coming Soon $164,900 BRIGHT MLS
- 2014-07-30 Listing Removed — BRIGHT MLS
- 2013-02-03 Listed $94,900 BRIGHT MLS
- 2007-12-08 Listing Removed — BRIGHT MLS
- 2007-08-01 Listing Removed — BRIGHT MLS
- 2007-07-31 Sold (MLS) $100,000 BRIGHT MLS
- 2007-06-08 Listed $110,000 BRIGHT MLS
- 2007-06-08 Listed $110,000 BRIGHT MLS
- 1991-07-12 Sold (Public Records) $51,900 Public Records
- 1987-12-30 Sold (Public Records) $39,900 Public Records
Property tax history
+0.7%/yrLatest (2025): $3,271 · +0.9% YoY. Source: county tax records.
Cash-flow waterfall
monthlySold comps — $/sqft
last 12 mo · ≤1 miLoading sold comps…