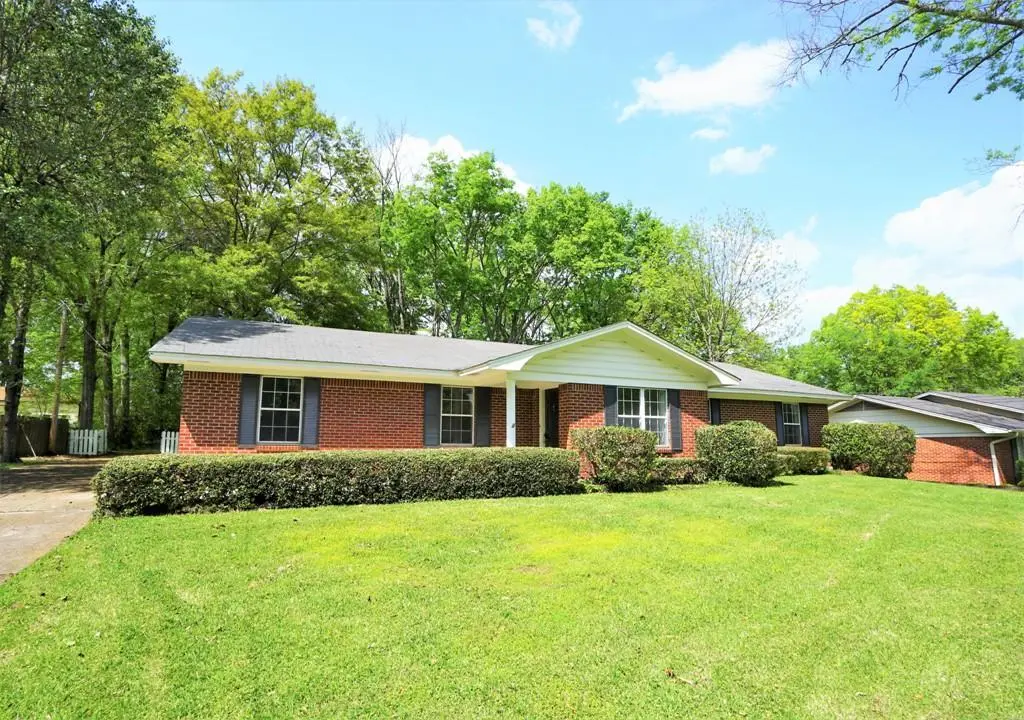
1014 Polk St · Tupelo, MS
Flood risk 1/10 · Minimal
- FEMA flood zone
- X (unshaded)
- Chance of flooding over 30 yrs
- 0.0%
- Est. flood insurance / yr
- $507 – $1,088
Fire risk 1/10 · Minimal
- Est. fire insurance / yr
- $1,241 – $2,305
Heat risk 6/10 · Moderate
- Hot days now (above 108°F)
- 7 days/yr
- Hot days in 30 yrs
- 21 days/yr
Wind risk 6/10 · Moderate
- Chance of severe wind over 30 yrs
- 27.0%
Air-quality risk 2/10 · Minimal
- Unhealthy air days now
- 1 days/yr
- Unhealthy air days in 30 yrs
- 1 days/yr
Risk factors via First Street. Map © Google.
Why this score? — see what drove the D- grade
The composite is a weighted blend of 9 inputs, each scored 0–100. Each bar is that input's sub-score; the figure is the points it added to the 100-point composite (weight × sub-score).
- Cash flow +14.6/30.0
- DSCR +4.5/10.0
- Rent growth +4.3/5.0
- Schools +3.7/10.0
- Livability +3.6/5.0
- 1% rule +2.9/10.0
- Condition / age +2.5/5.0
- ARV discount +0.0/15.0
- Appreciation +0.0/10.0
$225,000
🖨 Deal sheet (PDF) 📄 Offer letter ✓ Due diligence
Listing remarks MLS
Well-maintained, move-in ready, brick ranch - 4 BR / 3 BA with beautiful park-like backyard. Great split bedroom plan with two bedrooms with ensuite bathrooms. The spacious kitchen is great for entertaining! Cozy up to the fireplace in the den with fabulous built-ins! New paint throughout and new flooring! All info subject to verification. Agents see private remarks.
Key facts
- Park-like backyard
- Breakfast room
- Ensuite bathrooms
Tags
Property features AI
Finance
- Financial info: Annual property tax: $974.34
Exterior
- Home design: Single-family residence; Traditional style; Single-story
- Exterior features: Lot dimensions approximately 100 x 215; Located in the Lee Acres subdivision
Interior
- Kitchen: Includes dishwasher, range, refrigerator
- Bedrooms: Total rooms: 7
- Bathrooms: 3 full bathrooms
- Interior features: Dishwasher; Range; Refrigerator
Neighborhood map
What this means for you Summary
Snapshot
- This is a 4-bed/1.0-bath single-family listed at $225k.
Deal economics
- At list price, monthly cash flow is $55 ($664/yr) — positive.
- The deal already cash-flows at list — no discount required.
- To meet the 1% rule (rent ≥ 1% of price), the offer needs to be $179k (20.7% below list).
- Recommended offer: $179k (20.7% below list) — sets the bar for 1% rule.
Location & tenants
- Location reads 72/100 on livability (#26 in MS) — a middle-class / working-renter tenant base. Strengths: cost of living A+, housing A+, health & safety A-; Watch: amenities D+, employment D+, crime F.
- Tupelo Public School District (town): math 46% / reading 42% proficiency, ranked #28 of 130 in MS (top 22%) — families likely to look elsewhere, expect single-tenant / working-renter base with shorter leases.
- Zoned schools: Parkway Elementary School (452 students, 99% FRL); Tupelo Middle School (math 51% / reading 40%, grade D+, #41 of 179 statewide, top 23%, 1,080 students, 100% FRL); Tupelo High School (math 32% / reading 41%, grade F, #63 of 197 statewide, top 32%, 2,001 students, 100% FRL) — zoned schools average 100% FRL vs 55% district-wide (45 pts higher); higher-poverty schools than district average — tighter screening recommended.
- Market conditions: Rents rising fast (+7.3%/yr); 236 active listings in the ZIP; 1 comparable units currently listed for rent nearby; 154 units permitted in Lee County in 2024 (24 in 5+ unit buildings).
- This rent runs 34% of the median local income ($63k/yr) — at the standard rent-burdened threshold; future hikes will face affordability resistance.
Forward outlook
- Local home prices are declining (-3.0%/yr); year-one equity from $2k of loan paydown is wiped out by about $7k of value loss. Plan a longer hold.
- Lee County population projected at +6% by 2050 — modest demand growth; plan on rents tracking national, not racing it.
Negotiation context
- It's been on market 19 days — a 2% lower offer ($222k) is reasonable based on typical stale-listing flexibility.
- 2 sale attempts since 8y ago with the ask held roughly flat each time — persistent listings suggest the price (not the market) is what's stuck; bring a comps-based counter.
- Current owner paid $135k; list at $225k implies a 67% gain — meaningful room to come down on a strong offer.
Risks & watch-outs
- Climate carrying-cost: major wind risk, 27% chance of damaging wind over 30y; extreme-heat days projected 7→21/yr by 2055 (HVAC capex compounding) — expect insurance premiums to compound above CPI over the hold.
Questions for the listing agent
- Built in 1969 — when were the roof, HVAC, electrical panel, plumbing, and water heater last replaced?
- Is there a deadline driving the sale (1031 exchange, divorce, estate, relocation)? That informs how much negotiation room exists.
- Crime grade is F in this area — have there been break-ins, vandalism, or insurance claims at this property in the last 3 years? What carrier currently insures it and at what premium?
- The area grade is low — what's the realistic commute time and amenity access for the typical tenant pool here? Any planned neighborhood developments (good or bad) we should know about?
- What's the average days-on-market for RENTAL listings here right now (not sales)? A rising rental-DOM trend means longer vacancies and softer asking-rent achievability than the comps imply.
- What's the recent tenant-quality profile in this submarket — average credit score on applications, eviction rate, late-payment / NSF rate, and stable-employment percentage? A property-management company in the area should have these aggregated.
- How much new for-sale + rental construction is in the pipeline within 1–3 miles? Heavy new supply typically softens prices + rents 12–24 months out; constrained supply supports both.
Investment metrics
- 1% rule
- 0.79% ✗
- Cap rate
- 6.59%
- Cash-on-cash
- 1.05%
- DSCR
- 1.05
- GRM
- 10.5
CMA / ARV
- ARV (on-the-fly)
- $175,960
- Comps found
- 7
Show comp detail 7 sales within ~0.75 mi
| Address | Dist | Beds/Ba | Sqft | Sold | Price | $/sf | Match |
|---|---|---|---|---|---|---|---|
| 1009 Polk St | 0.05mi | 3/2.0 (-1) | 1,941 (-8%) | 21mo | $189,504 | $98 | 57 |
| 1009 Monroe St | 0.42mi | 4/2.0 | 2,249 (+6%) | 16mo | $137,000 | $61 | 53 |
| 1104 President St | 0.24mi | 4/2.0 | 1,878 (-11%) | 23mo | $150,000 | $80 | 46 |
| 1013 Eisenhower Dr | 0.23mi | 3/2.0 (-1) | 1,815 (-14%) | 18mo | $205,000 | $113 | 41 |
| 900 Ashley Ln | 0.65mi | 4/3.0 | 2,224 (+5%) | 18mo | $185,000 | $83 | 38 |
| 1304 Van Buren Ave | 0.40mi | 3/2.0 (-1) | 1,854 (-12%) | 21mo | $70,000 | $38 | 34 |
| 1004 Nixon Dr | 0.75mi | 4/2.0 | 2,386 (+12%) | 20mo | $247,500 | $104 | 23 |
Match score weights: distance 35% · size 25% · config 20% · recency 20%. Top-matched comps best support the ARV.
Projected returns pro-forma
-3.0% appreciation · 7.3% rent growth · sell at horizon
- IRR
- -10.5%
- Equity multiple
- 0.60×
- Total profit
- $-24,977
- Equity at exit
- $33,548
- IRR
- 3.5%
- Equity multiple
- 1.29×
- Total profit
- $18,529
- Equity at exit
- $19,454
Cash invested: $63,000 (down + closing). Projections, not guarantees.
Landlord ↔ Tenant lean methodology
- Overall (STATE)
- 90 Strongly Landlord-Friendly
- State Mississippi
- 90 Strongly Landlord-Friendly · R+11
- County
- — inherits STATE
- City
- — inherits STATE
ZIP-level market 38801
- Home prices YoY
- -20.7%
- Rents YoY
- 7.3%
- Active inventory
- 236
- Price-to-rent
- 10.5×
Monthly cashflow live
- Estimated rent
- $1,785 medium interval (Pro) →
- Mortgage (P&I)
- −$1,180
- Tax from tax record
- −$81 /mo · $974/yr
- Insurance
- −$94
- HOA
- −$0
- Vacancy / Maint / Mgmt
- −$375
- Net cashflow
- $55
Break-even live
Sensitivity live
| Price | -10% $183 | -5% $119 | +0% $55 | +5% $-8 | +10% $-72 |
|---|---|---|---|---|---|
| Rent | -10% $-86 | -5% $-15 | +0% $55 | +5% $126 | +10% $196 |
| Rate | -1.0pp $169 | -0.5pp $113 | base $55 | +0.5pp $-3 | +1.0pp $-62 |
UW: 25.0% down · 7.5% · 30yr · 1.5% tax · 5.0% vac · 8.0% maint · 8.0% mgmt
Financing live
Cash to close
- Down payment
- $56,250
- Closing costs
- $6,750
- Reserves months
- —
- Total cash needed
- —
Loan-product check · same deal, 3 products live
Conventional
25% down · 7.5% · 30yr
- Down + closing
- —
- Monthly P&I
- —
- Monthly cashflow
- —
- DSCR
- —
- Eligible?
- —
Personal DTI + credit; lowest rate.
DSCR
20% down · 8.5% · 30yr
- Down + closing
- —
- Monthly P&I
- —
- Monthly cashflow
- —
- DSCR
- —
- Eligible?
- —
No personal income docs; deal must DSCR.
Hard money
10% down · 12.0% · 12mo
- Down + closing
- —
- Monthly P&I
- —
- Monthly cashflow
- —
- DSCR
- —
- Eligible?
- —
Short-term bridge; refi at stabilization.
Rent comps 1 comps
| Address | Beds | Baths | Sqft | Rent | $/sqft | DOM | Units | Dist |
|---|---|---|---|---|---|---|---|---|
| 2311 Shady Wood Dr Tupelo, MS | 4.0 | 3.0 | 3000 | $2,495 | $0.83 | 45d | 1 | 1.09mi |
Listing history 15 events
-
2026-06-12statusdays on market $225,000 Pending 19 DOM
-
2026-06-09days on market $225,000 Active 18 DOM
-
2026-06-08days on market $225,000 Active 17 DOM
-
2026-06-07days on market $225,000 Active 16 DOM
-
2026-06-05days on market $225,000 Active 13 DOM
-
2026-06-03days on market $225,000 Active 12 DOM
-
2026-06-02days on market $225,000 Active 11 DOM
-
2026-06-01days on market $225,000 Active 10 DOM
-
2026-05-31days on market $225,000 Active 9 DOM
-
2026-05-30days on market $225,000 Active 8 DOM
-
2026-05-22$225,000 Active
-
2018-06-04soldstatus 369-char remark
Show marketing remark (369 chars)
Well-maintained, move-in ready, brick ranch - 4 BR / 3 BA with beautiful park-like backyard. Great split bedroom plan with two bedrooms with ensuite bathrooms. The spacious kitchen is great for entertaining! Cozy up to the fireplace in the den with fabulous built-ins! New paint throughout and new flooring! All info subject to verification. Agents see private remarks.
-
2018-06-04soldstatus $135,000
Show marketing remark (369 chars)
Well-maintained, move-in ready, brick ranch - 4 BR / 3 BA with beautiful park-like backyard. Great split bedroom plan with two bedrooms with ensuite bathrooms. The spacious kitchen is great for entertaining! Cozy up to the fireplace in the den with fabulous built-ins! New paint throughout and new flooring! All info subject to verification. Agents see private remarks.
-
2018-06-04soldstatus $139,000
Show marketing remark (369 chars)
Well-maintained, move-in ready, brick ranch - 4 BR / 3 BA with beautiful park-like backyard. Great split bedroom plan with two bedrooms with ensuite bathrooms. The spacious kitchen is great for entertaining! Cozy up to the fireplace in the den with fabulous built-ins! New paint throughout and new flooring! All info subject to verification. Agents see private remarks.
-
2018-04-27$139,900 369-char remark
Show marketing remark (369 chars)
Well-maintained, move-in ready, brick ranch - 4 BR / 3 BA with beautiful park-like backyard. Great split bedroom plan with two bedrooms with ensuite bathrooms. The spacious kitchen is great for entertaining! Cozy up to the fireplace in the den with fabulous built-ins! New paint throughout and new flooring! All info subject to verification. Agents see private remarks.
ⓘ Source: listings_history table (triggers on properties + properties_extension) + one-shot
backfill from property_details.listing_events for pre-trigger history.
Tax reassessment forecast MS · Resets to sale price
- Current annual tax
- $974 · $81/mo
- Projected year-2 tax
- $1,778 · $148/mo
- Expected delta
- +$803/yr (+$67/mo · 82.4%)
ⓘ Screening estimate from a state-policy table — verify with the county assessor before closing.
Climate risk First Street
- Flood 1/10 Low FEMA zone X (unshaded) · 0% chance over 30 yrs
- Wildfire 1/10 Low
- Heat 6/10 Major 7 d/yr ≥108°F today · 21 d/yr by 30 yrs out
- Wind 6/10 Major 27% chance of damaging wind over 30 yrs
- Air quality 2/10 Low 1 unhealthy d/yr today · 1 by 30 yrs out
Nearby sold comps map
Loading sold comps map…
Walkable amenities ~0.75 mi
Loading nearby amenities…
Taxation est. · year 1
- Rental income
- $21,420
- − Mortgage interest
- −$12,603
- − Property taxes
- −$974
- − Insurance
- −$1,125
- − Repairs & maintenance
- −$1,714
- − Management
- −$1,714
- − Depreciation
- −$6,545
- Taxable loss
- −$3,255
- Est. tax savings @ 24.0%
- +$781
- After-tax cash flow
- $1,445/yr
For passive investors: Depreciation is non-cash, so a rental often shows a tax loss while cash-flowing — sheltering income. Rental losses are passive: they offset passive income freely, and up to $25,000/yr can offset ordinary (W-2) income if you actively participate and your MAGI is under $100k (phasing out to $0 by $150k); unused losses carry forward. On sale, claimed depreciation is recaptured at up to 25%, and gains may owe capital-gains tax (a 1031 exchange can defer both). Figures are a year-1 estimate at your 24.0% rate — not tax advice; consult a CPA.
Schools (NCES district)
- District
- Tupelo Public School District
- NCES district ID
- 2804320
- Math proficiency
- 46% ▼ -13.00%
- Reading proficiency
- 42% ▼ -7.00%
- Median HH income
- $44,002
- Composite
- 37.26/100
- National rank
- #4456
- State rank
- #28 of 130 in MS
Livability — Tupelo
- Score
- 72/100
- State rank
- #26
- US rank
- #6369
Category grades
Schools grade is shown separately in the Schools card above.
Census & demographics
- Census place
- Tupelo, MS
- County
- Lee County · 52,445 people
- City population
- 46,551
- Metro
- Tupelo, MS
- Population (ZIP)
- 29,858
- Household income
- $62,946
- Rent vs Own
- Severe rent burden
- 890.0
Population outlook (Lee County) Hauer SSP2
- Today (2025)
- 90,253 people
- By 2030
- 92,125 · +2.1%
- By 2040
- 94,914 · +5.2%
- By 2050
- 95,841 · +6.2%
- By 2075
- 94,189 · +4.4%
- By 2100
- 83,736 · -7.2%
Race, ethnicity, and origin ACS 2023
- Neighborhood character
- Diverse neighborhood (Simpson 0.59)
- Race & ethnicity
- Black 45% White 44% Hispanic / Latino 6% Two or more races 4% Asian 1%
- Hispanic origin (detail)
- Mexican 5%
- Common ancestry
- Slovak 1% Italian 1% Serbian 1%
- Foreign-born
- 4% · Canada
- Languages at home
- 93% English-only · Spanish 5%
Political lean MEDSL · Lee
- 2024 margin
- Solid R (+38.8) · D 30.0% · R 68.9% · Other 1.1%
- 2008→2024 swing
- -8.3pp toward R · 2008: -30.5pp · 2024: -38.8pp
- All cycles
- 2024: R+38.8 2020: R+32.5 2016: R+37.7 2012: R+29.0 2008: R+30.5
Not yet ingested
- Civics
- —
Market trends
- HPI YoY
- ▼ -45.12%
- Current HPI
- 173.1355
- Rent YoY
- ▲ 7.30%
- Metro
- Tupelo, MS
- State GDP YoY
- —
- F500 in state
- 0
Price history
+60.8% since first listed5 events — show timeline
- 2026-05-22 Listed $225,000 NEMSBD
- 2018-06-04 Sold (Public Records) $139,000 Public Records
- 2018-06-04 Sold (Public Records) $135,000 Public Records
- 2018-06-04 Sold (MLS) — NEMSBD
- 2018-04-27 Listed $139,900 NEMSBD
Property tax history
+8.7%/yrLatest (2025): $974 · -42.0% YoY. Source: county tax records.
Cash-flow waterfall
monthlySold comps — $/sqft
last 12 mo · ≤1 miLoading sold comps…