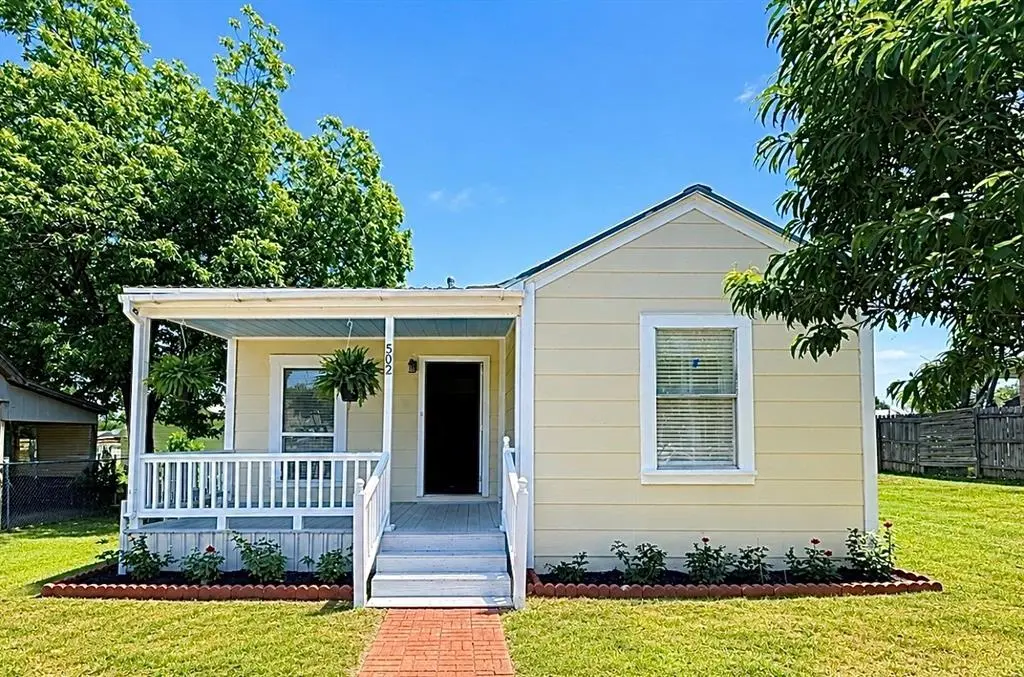
502 W Paine Ave · Comanche, TX
Flood risk 1/10 · Minimal
- FEMA flood zone
- X
- Chance of flooding over 30 yrs
- 0.0%
- Est. flood insurance / yr
- $507 – $1,088
Fire risk 5/10 · Moderate
- Est. fire insurance / yr
- $1,222 – $2,270
Heat risk 7/10 · Major
- Hot days now (above 106°F)
- 7 days/yr
- Hot days in 30 yrs
- 22 days/yr
Wind risk 6/10 · Moderate
- Chance of severe wind over 30 yrs
- 27.0%
Air-quality risk 1/10 · Minimal
- Unhealthy air days now
- 0 days/yr
- Unhealthy air days in 30 yrs
- 0 days/yr
Risk factors via First Street. Map © Google.
Why this score? — see what drove the C grade
The composite is a weighted blend of 9 inputs, each scored 0–100. Each bar is that input's sub-score; the figure is the points it added to the 100-point composite (weight × sub-score).
- Cash flow +26.6/30.0
- DSCR +9.1/10.0
- 1% rule +6.5/10.0
- Livability +3.2/5.0
- Schools +3.1/10.0
- Rent growth +2.5/5.0
- Condition / age +2.5/5.0
- ARV discount +1.7/15.0
- Appreciation +0.0/10.0
$119,900
🖨 Deal sheet 📄 Offer letter ✓ Due diligence
Listing remarks
Updated 3 bed 1 bath. New hvac, new paint, stainless stove, new water heater, and close to town! Come sit on this cute front porch and relax! Call for a showing!
Key facts
- 5,619 sq ft lot
- Built 1949
- Listed 35 days
Property features AI
Finance
- HOA & community: No homeowners association
Exterior
- Parking: Driveway
- Utilities: City water; City sewer; No municipal utility district
- Home design: Single family residence; Residential property; Attached property
- Construction: Built in 1949
- Exterior features: Lot under 0.5 acre (approximately 0.129 acres); Subdivision: Wrights
Interior
- Kitchen: Dishwasher
- Bedrooms: 3 bedrooms (primary bedroom on level 1)
- Bathrooms: 1 full bathroom
- Interior features: Chandelier; One level
Neighborhood map
What this means for you Summary
Snapshot
- This is a 3-bed/1.0-bath single-family listed at $120k.
Deal economics
- At list price, monthly cash flow is $321 ($4k/yr) — positive.
- The deal already cash-flows at list — no discount required.
- Meets the 1% rule at list price ($1k rent vs $120k).
- Recommended offer: $116k (3.0% below list) — sets the bar for market timing.
- Cap rate 9.5% vs local median 2.1% in Comanche — top-decile yield for the area; either an underpriced asset or a hidden risk that comps aren't pricing in. Stress-test before assuming the spread holds.
Location & tenants
- Location reads 64/100 on livability (#763 in TX) — a middle-class / working-renter tenant base. Strengths: cost of living A+, housing A+; Watch: crime D+, health & safety D+, amenities F.
- Comanche ISD (town): math 39% / reading 36% proficiency, ranked #484 of 826 in TX (top 59%) — families likely to look elsewhere, expect single-tenant / working-renter base with shorter leases; 60% free/reduced lunch — lower-income household profile, screen leases tightly.
- Zoned schools: Comanche El (math 44% / reading 37%, grade F, #1,490 of 4,322 statewide, top 35%, 639 students, 65% FRL) — zoned schools at 65% FRL track the district average.
- Market conditions: 168 active listings in the ZIP; 4 units permitted in Comanche County in 2024 (0 in 5+ unit buildings).
Forward outlook
- Local home prices are declining (-3.0%/yr); year-one equity from $829 of loan paydown is wiped out by about $4k of value loss. Plan a longer hold.
- Comanche County population projected at -29% by 2050 — secular population decline; favor cash flow + early exit over multi-decade hold.
- At projected returns (-3.0% appreciation + 3.0% rent growth), your $34k cash investment doubles in ~10 years — after that, you're playing with house money.
Negotiation context
- It's been on market 35 days — a 3% lower offer ($116k) is reasonable based on typical stale-listing flexibility.
Risks & watch-outs
- Watch-outs: built in 1949 — expect roof / HVAC / electrical / plumbing capex.
- Climate carrying-cost: major wind risk, 27% chance of damaging wind over 30y; moderate wildfire risk; extreme-heat days projected 7→22/yr by 2055 (HVAC capex compounding) — expect insurance premiums to compound above CPI over the hold.
Questions for the listing agent
- It's been on market 35 days. Have you received any prior offers? Is the seller open to a 3% concession, seller financing, or rate buy-down credit?
- Built in 1949 — when were the roof, HVAC, electrical panel, plumbing, and water heater last replaced?
- Is there a deadline driving the sale (1031 exchange, divorce, estate, relocation)? That informs how much negotiation room exists.
- Schools are F-rated, which usually means shorter tenancies and higher turnover. Who's the typical renter profile here, and what's been the actual vacancy rate?
- Crime grade is D in this area — have there been break-ins, vandalism, or insurance claims at this property in the last 3 years? What carrier currently insures it and at what premium?
- What's the average days-on-market for RENTAL listings here right now (not sales)? A rising rental-DOM trend means longer vacancies and softer asking-rent achievability than the comps imply.
- What's the recent tenant-quality profile in this submarket — average credit score on applications, eviction rate, late-payment / NSF rate, and stable-employment percentage? A property-management company in the area should have these aggregated.
- How much new for-sale + rental construction is in the pipeline within 1–3 miles? Heavy new supply typically softens prices + rents 12–24 months out; constrained supply supports both.
Investment metrics
- 1% rule
- 1.15% ✓
- Cap rate
- 9.50%
- Cash-on-cash
- 11.47%
- DSCR
- 1.51
- GRM
- 7.2
CMA / ARV
- ARV (median comp)
- $106,119
- List price
- $119,900
- Delta
- 12.99%
- Verdict
- OVERPRICED
- Comps
- 20 within 1.0 mi
Show comp detail 5 sales within ~0.75 mi
| Address | Dist | Beds/Ba | Sqft | Sold | Price | $/sf | Match |
|---|---|---|---|---|---|---|---|
| 503 N Pearl St | 0.37mi | 2/1.0 (-1) | 844 (-3%) | 15mo | $35,000 | $41 | 61 |
| 204 S Williams Dr | 0.46mi | 2/1.0 (-1) | 840 (-3%) | 14mo | $74,000 | $88 | 56 |
| 307 E Grand Ave | 0.51mi | 2/1.0 (-1) | 784 (-10%) | 3mo | $134,900 | $172 | 52 |
| 600 N Pearl | 0.41mi | 2/1.0 (-1) | 984 (+13%) | 14mo | $149,900 | $152 | 42 |
| 601 E Walcott Ave | 0.74mi | 3/1.5 | 980 (+13%) | 4mo | $36,000 | $37 | 38 |
Match score weights: distance 35% · size 25% · config 20% · recency 20%. Top-matched comps best support the ARV.
Projected returns pro-forma
-3.0% appreciation · 3.0% rent growth · sell at horizon
- IRR
- 0.8%
- Equity multiple
- 1.03×
- Total profit
- $991
- Equity at exit
- $17,877
- IRR
- 10.4%
- Equity multiple
- 1.81×
- Total profit
- $27,115
- Equity at exit
- $10,367
Cash invested: $33,572 (down + closing). Projections, not guarantees.
Landlord ↔ Tenant lean methodology
- Overall (STATE)
- 87 Strongly Landlord-Friendly
- State Texas
- 87 Strongly Landlord-Friendly · R+5
- County
- — inherits STATE
- City
- — inherits STATE
ZIP-level market 76442
- Home prices YoY
- -15.9%
- Active inventory
- 168
- Price-to-rent
- 7.2×
Monthly cashflow live
- Estimated rent
- $1,381 medium interval (Pro) →
- Mortgage (P&I)
- −$629
- Tax from tax record
- −$91 /mo · $1,094/yr
- Insurance
- −$50
- HOA
- −$0
- Vacancy / Maint / Mgmt
- −$290
- Net cashflow
- $321
Break-even live
UW: 25.0% down · 7.5% · 30yr · 1.5% tax · 5.0% vac · 8.0% maint · 8.0% mgmt
Financing live
Cash to close
- Down payment
- $29,975
- Closing costs
- $3,597
- Reserves months
- —
- Total cash needed
- —
Loan-product check · same deal, 3 products live
Conventional
25% down · 7.5% · 30yr
- Down + closing
- —
- Monthly P&I
- —
- Monthly cashflow
- —
- DSCR
- —
- Eligible?
- —
Personal DTI + credit; lowest rate.
DSCR
20% down · 8.5% · 30yr
- Down + closing
- —
- Monthly P&I
- —
- Monthly cashflow
- —
- DSCR
- —
- Eligible?
- —
No personal income docs; deal must DSCR.
Hard money
10% down · 12.0% · 12mo
- Down + closing
- —
- Monthly P&I
- —
- Monthly cashflow
- —
- DSCR
- —
- Eligible?
- —
Short-term bridge; refi at stabilization.
Listing history 17 events
-
2026-06-18days on market $119,900 Active 35 DOM
-
2026-06-17days on market $119,900 Active 34 DOM
-
2026-06-16days on market $119,900 Active 33 DOM
-
2026-06-15days on market $119,900 Active 32 DOM
-
2026-06-13days on market $119,900 Active 30 DOM
-
2026-06-12days on market $119,900 Active 29 DOM
-
2026-06-09days on market $119,900 Active 26 DOM
-
2026-06-08days on market $119,900 Active 25 DOM
-
2026-06-08days on market $119,900 Active 24 DOM
-
2026-06-07days on market $119,900 Active 23 DOM
-
2026-06-03days on market $119,900 Active 20 DOM
-
2026-06-02days on market $119,900 Active 19 DOM
-
2026-06-01days on market $119,900 Active 18 DOM
-
2026-05-31days on market $119,900 Active 17 DOM
-
2026-04-30$129,000 Active 161-char remark
-
2021-02-03soldstatus
-
2003-06-02soldstatus
ⓘ Source: listings_history table (triggers on properties + properties_extension) + one-shot
backfill from property_details.listing_events for pre-trigger history.
Tax reassessment forecast TX · Resets to sale price
- Current annual tax
- $1,094 · $91/mo
- Projected year-2 tax
- $2,194 · $183/mo
- Expected delta
- +$1,100/yr (+$92/mo · 100.5%)
ⓘ Screening estimate from a state-policy table — verify with the county assessor before closing.
Climate risk First Street
- Flood 1/10 Low FEMA zone X · 0% chance over 30 yrs
- Wildfire 5/10 Major
- Heat 7/10 Severe 7 d/yr ≥106°F today · 22 d/yr by 30 yrs out
- Wind 6/10 Major 27% chance of damaging wind over 30 yrs
- Air quality 1/10 Low 0 unhealthy d/yr today · 0 by 30 yrs out
Nearby sold comps map
Loading sold comps map…
Walkable amenities ~0.75 mi
Loading nearby amenities…
Taxation est. · year 1
- Rental income
- $16,569
- − Mortgage interest
- −$6,716
- − Property taxes
- −$1,094
- − Insurance
- −$600
- − Repairs & maintenance
- −$1,326
- − Management
- −$1,326
- − Depreciation
- −$3,488
- Taxable income
- $2,020
- Est. tax owed @ 24.0%
- −$485
- After-tax cash flow
- $3,366/yr
For passive investors: Depreciation is non-cash, so a rental often shows a tax loss while cash-flowing — sheltering income. Rental losses are passive: they offset passive income freely, and up to $25,000/yr can offset ordinary (W-2) income if you actively participate and your MAGI is under $100k (phasing out to $0 by $150k); unused losses carry forward. On sale, claimed depreciation is recaptured at up to 25%, and gains may owe capital-gains tax (a 1031 exchange can defer both). Figures are a year-1 estimate at your 24.0% rate — not tax advice; consult a CPA.
Schools (NCES district)
- District
- Comanche ISD
- NCES district ID
- 4814760
- Math proficiency
- 39% ▲ 1.00%
- Reading proficiency
- 36% ▼ -4.00%
- Median HH income
- $37,766
- Composite
- 31.27/100
- National rank
- #6024
- State rank
- #484 of 826 in TX
Livability — Comanche
- Score
- 64/100
- State rank
- #763
- US rank
- #13962
Category grades
Schools grade is shown separately in the Schools card above.
Census & demographics
- Census place
- Comanche, TX
- City population
- 7,082
- Population (ZIP)
- 7,082
Population outlook (Comanche County) Hauer SSP2
- Today (2025)
- 12,214 people
- By 2030
- 11,531 · -5.6%
- By 2040
- 10,132 · -17.0%
- By 2050
- 8,724 · -28.6%
- By 2075
- 5,684 · -53.5%
- By 2100
- 3,649 · -70.1%
Race, ethnicity, and origin ACS 2023
- Neighborhood character
- Majority White (60%)
- Race & ethnicity
- White 60% Hispanic / Latino 35% Two or more races 25% Native American 1%
- Hispanic origin (detail)
- Mexican 33%
- Common ancestry
- Italian 5% Slovak 1% Serbian 1%
- Foreign-born
- 10% · Canada
- Languages at home
- 76% English-only · Spanish 23% German/W. Germanic 1%
Political lean MEDSL · Comanche
- 2024 margin
- Solid R (+74.0) · D 12.7% · R 86.8%
- 2008→2024 swing
- -26.5pp toward R · 2008: -47.5pp · 2024: -74.0pp
- All cycles
- 2024: R+74.0 2020: R+71.0 2016: R+67.4 2012: R+62.3 2008: R+47.5
Not yet ingested
- Civics
- —
Market trends
- HPI YoY
- ▼ -41.00%
- Current HPI
- 216.9759
- Rent YoY
- —
- Metro
- —
- State GDP YoY
- ▲ 3.95%
- F500 in state
- 110
Industry mix (Fortune 500 HQ in TX)
| Industry | F500 HQs | Revenue |
|---|---|---|
| Energy | 16 | $1,198B |
|
||
| Technology | 5 | $198B |
|
||
| Engineering / Construction | 4 | $72B |
|
||
| Energy Services | 3 | $60B |
|
||
| Utilities | 3 | $41B |
|
||
| Healthcare | 2 | $330B |
|
||
Price history
-7.1% since first listed7 events — show timeline
- 2026-05-28 Price Changed $119,900 NTREIS
- 2026-05-23 Price Changed $124,900 NTREIS
- 2026-05-13 Sold (Public Records) — Public Records
- 2026-04-30 Listed $129,000 NTREIS
- 2022-08-15 Sold (Public Records) — Public Records
- 2021-02-03 Sold (Public Records) — Public Records
- 2003-06-02 Sold (Public Records) — Public Records
Property tax history
+5.1%/yrLatest (2025): $1,094 · +3.5% YoY. Source: county tax records.
Cash-flow waterfall
monthlySold comps — $/sqft
last 12 mo · ≤1 miLoading sold comps…