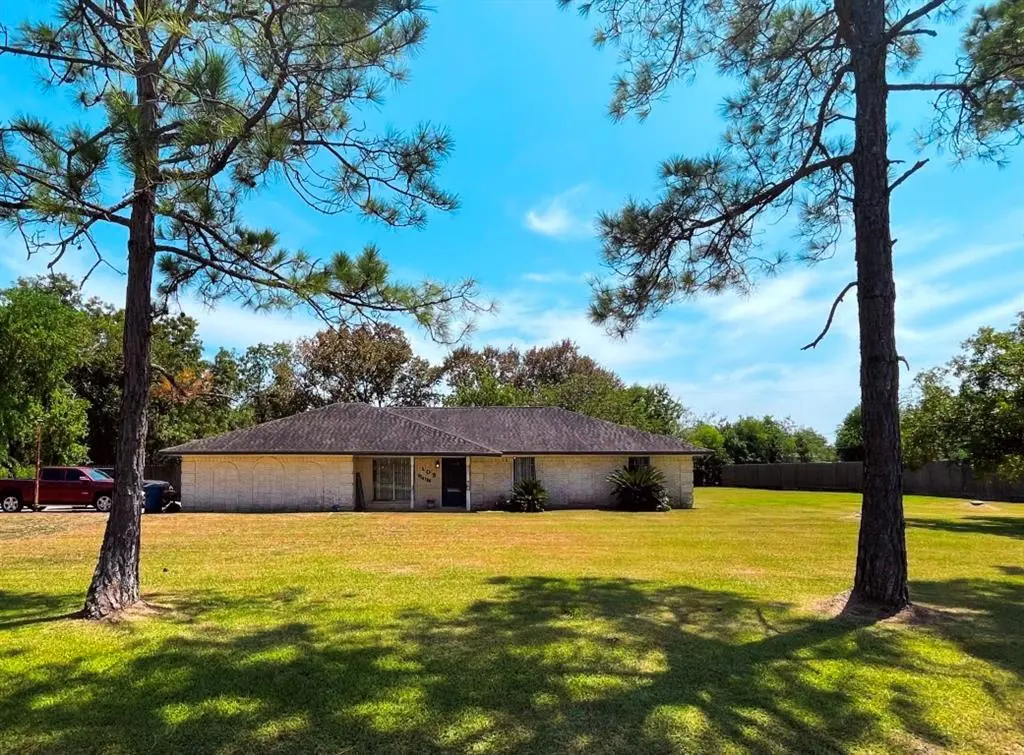
103 Deaton St · Jones Creek, TX
Flood risk 5/10 · Moderate
- FEMA flood zone
- X (shaded)
- Chance of flooding over 30 yrs
- 0.24%
- Est. flood insurance / yr
- $507 – $1,088
Fire risk 3/10 · Minor
- Est. fire insurance / yr
- $1,222 – $2,270
Heat risk 10/10 · Severe
- Hot days now (above 116°F)
- 7 days/yr
- Hot days in 30 yrs
- 25 days/yr
Wind risk 9/10 · Severe
- Chance of severe wind over 30 yrs
- 99.0%
Air-quality risk 2/10 · Minimal
- Unhealthy air days now
- 1 days/yr
- Unhealthy air days in 30 yrs
- 2 days/yr
Risk factors via First Street. Map © Google.
Why this score? — see what drove the C- grade
The composite is a weighted blend of 9 inputs, each scored 0–100. Each bar is that input's sub-score; the figure is the points it added to the 100-point composite (weight × sub-score).
- Cash flow +19.2/30.0
- ARV discount +7.5/15.0
- 1% rule +7.1/10.0
- DSCR +6.1/10.0
- Schools +3.7/10.0
- Livability +3.3/5.0
- Rent growth +2.5/5.0
- Condition / age +2.5/5.0
- Appreciation +0.0/10.0
$145,000
🖨 Deal sheet 📄 Offer letter ✓ Due diligence
Listing remarks
Tucked away on an expansive nearly one-acre lot, this charming 4-bedroom, 2-bath property offers the perfect blend of country living and coastal convenience just minutes from the beaches of Surfside Beach. Inside, you’ll find spacious living and dining areas, abundant natural light, and a stunning oversized sunroom wrapped in windows—creating the ideal space to relax or entertain year-round. Outside, the possibilities are endless with plenty of room for a pool, workshop, RV parking, boats, additional buildings, or future expansion. A private driveway, covered front and back porches, and a 2-car garage add to the home’s functionality and appeal. With no HOA restrictions, th
Key facts
- Private driveway
- No hoa restrictions
- 0.86 acre lot
Tags
Property features AI
Exterior
- Parking: Attached garage with 2 spaces
- Utilities: Public water; Public sewer
- Home design: Residential property; Built in 1966; Slab foundation; Composition roof
- Construction: Brick and wood siding construction
- Exterior features: Corner lot in a subdivision; Lot approximately 0.8649 acres
Interior
- Bedrooms: Four bedrooms on the first floor (approximate dimensions: 13x10, 13x10, 11x13, 12x13)
- Bathrooms: Two full bathrooms
- Heating & cooling: Central heating (gas); Central air conditioning (gas)
- Interior features: 4 total rooms
Neighborhood map
What this means for you Summary
Snapshot
- This is a 4-bed/2.0-bath single-family listed at $145k.
Deal economics
- At list price, monthly cash flow is $156 ($2k/yr) — positive.
- The deal already cash-flows at list — no discount required.
- Meets the 1% rule at list price ($2k rent vs $145k).
- Cap rate 7.6% vs local median 1.8% in Jones Creek — top-decile yield for the area; either an underpriced asset or a hidden risk that comps aren't pricing in. Stress-test before assuming the spread holds.
Location & tenants
- Location reads 66/100 on livability (#633 in TX) — a middle-class / working-renter tenant base. Strengths: crime A+, cost of living A+, housing A+; Watch: amenities F, commute F, health & safety F.
- Brazosport ISD (suburban): math 43% / reading 41% proficiency, ranked #305 of 826 in TX (top 37%) — families likely to look elsewhere, expect single-tenant / working-renter base with shorter leases.
- Zoned schools: Brazosport H S (math 40% / reading 27%, grade F, #1,011 of 1,632 statewide, top 63%, 948 students, 78% FRL) — zoned schools average 78% FRL vs 53% district-wide (25 pts higher); higher-poverty schools than district average — tighter screening recommended.
- Market conditions: 590 active listings in the ZIP; 3,960 units permitted in Brazoria County in 2024 (593 in 5+ unit buildings).
- This rent runs 32% of the median local income ($67k/yr) — at the standard rent-burdened threshold; future hikes will face affordability resistance.
Forward outlook
- Local home prices are declining (-3.0%/yr); year-one equity from $1k of loan paydown is wiped out by about $4k of value loss. Plan a longer hold.
- Brazoria County population projected at +44% by 2050 — long-run rental-demand tailwind backs the buy-and-hold thesis.
Negotiation context
- Only 13 days on market — expect competitive offers; lowballing is unlikely to land.
- 8 sale attempts since 17y ago with the ask held roughly flat each time — persistent listings suggest the price (not the market) is what's stuck; bring a comps-based counter.
Risks & watch-outs
- Watch-outs: property tax is 3.4% of price.
- Climate carrying-cost: moderate flood risk; severe wind risk, 99% chance of damaging wind over 30y; extreme-heat days projected 7→25/yr by 2055 (HVAC capex compounding) — expect insurance premiums to compound above CPI over the hold.
Questions for the listing agent
- Built in 1966 — when were the roof, HVAC, electrical panel, plumbing, and water heater last replaced?
- Property tax is high relative to price — has the assessment been appealed recently, and will the sale trigger a re-assessment?
- Is there a deadline driving the sale (1031 exchange, divorce, estate, relocation)? That informs how much negotiation room exists.
- Schools are F-rated, which usually means shorter tenancies and higher turnover. Who's the typical renter profile here, and what's been the actual vacancy rate?
- What's the average days-on-market for RENTAL listings here right now (not sales)? A rising rental-DOM trend means longer vacancies and softer asking-rent achievability than the comps imply.
- What's the recent tenant-quality profile in this submarket — average credit score on applications, eviction rate, late-payment / NSF rate, and stable-employment percentage? A property-management company in the area should have these aggregated.
- How much new for-sale + rental construction is in the pipeline within 1–3 miles? Heavy new supply typically softens prices + rents 12–24 months out; constrained supply supports both.
Investment metrics
- 1% rule
- 1.21% ✓
- Cap rate
- 7.59%
- Cash-on-cash
- 4.62%
- DSCR
- 1.21
- GRM
- 6.9
CMA / ARV
- ARV (on-the-fly)
- $320,178
- Comps found
- 1
Show comp detail 1 sale within ~0.75 mi
| Address | Dist | Beds/Ba | Sqft | Sold | Price | $/sf | Match |
|---|---|---|---|---|---|---|---|
| 9122 Stephen F Austin | 0.22mi | 3/2.0 (-1) | 2,512 (+1%) | 7mo | $324,900 | $129 | 77 |
Match score weights: distance 35% · size 25% · config 20% · recency 20%. Top-matched comps best support the ARV.
Projected returns pro-forma
-3.0% appreciation · 3.0% rent growth · sell at horizon
- IRR
- -9.0%
- Equity multiple
- 0.67×
- Total profit
- $-13,374
- Equity at exit
- $21,620
- IRR
- 0.6%
- Equity multiple
- 1.05×
- Total profit
- $1,852
- Equity at exit
- $12,537
Cash invested: $40,600 (down + closing). Projections, not guarantees.
Landlord ↔ Tenant lean methodology
- Overall (STATE)
- 87 Strongly Landlord-Friendly
- State Texas
- 87 Strongly Landlord-Friendly · R+5
- County
- — inherits STATE
- City
- — inherits STATE
ZIP-level market 77541
- Home prices YoY
- -29.3%
- Active inventory
- 590
- Price-to-rent
- 6.9×
Monthly cashflow live
- Estimated rent
- $1,756 medium interval (Pro) →
- Mortgage (P&I)
- −$760
- Tax from tax record
- −$410 /mo · $4,923/yr
- Insurance
- −$60
- HOA
- −$0
- Vacancy / Maint / Mgmt
- −$369
- Net cashflow
- $156
Break-even live
UW: 25.0% down · 7.5% · 30yr · 1.5% tax · 5.0% vac · 8.0% maint · 8.0% mgmt
Financing live
Cash to close
- Down payment
- $36,250
- Closing costs
- $4,350
- Reserves months
- —
- Total cash needed
- —
Loan-product check · same deal, 3 products live
Conventional
25% down · 7.5% · 30yr
- Down + closing
- —
- Monthly P&I
- —
- Monthly cashflow
- —
- DSCR
- —
- Eligible?
- —
Personal DTI + credit; lowest rate.
DSCR
20% down · 8.5% · 30yr
- Down + closing
- —
- Monthly P&I
- —
- Monthly cashflow
- —
- DSCR
- —
- Eligible?
- —
No personal income docs; deal must DSCR.
Hard money
10% down · 12.0% · 12mo
- Down + closing
- —
- Monthly P&I
- —
- Monthly cashflow
- —
- DSCR
- —
- Eligible?
- —
Short-term bridge; refi at stabilization.
Listing history 26 events
-
2026-06-01days on market $145,000 Active 13 DOM
-
2026-05-31days on market $145,000 Active 12 DOM
-
2026-05-19$145,000 Active
-
2026-04-30historical
-
2025-11-17$199,900 Active
-
2025-11-17historical
-
2025-09-29$219,000 Active
-
2024-11-30historical
-
2024-09-21price $210,000
-
2024-07-15price $211,000
-
2024-06-29price $199,900
-
2024-05-15$239,900 Active
-
2023-10-11soldstatus
-
2023-10-09soldstatus Sold
-
2023-09-09status Pending
-
2023-08-29status Option Pending
-
2023-08-20$199,999 Active
-
2023-08-20historical $199,999
-
2014-05-13soldstatus
-
2014-05-12soldstatus
-
2014-01-10$119,900
-
2013-12-27historical
-
2013-12-04$129,900 Active
-
2010-06-22soldstatus
-
2010-04-18historical
-
2009-12-07$151,000
ⓘ Source: listings_history table (triggers on properties + properties_extension) + one-shot
backfill from property_details.listing_events for pre-trigger history.
Tax reassessment forecast TX · Resets to sale price
- Current annual tax
- $4,923 · $410/mo
- Projected year-2 tax
- $4,923 · $410/mo
- Expected delta
- $0/yr ($0/mo · 0.0%)
ⓘ Screening estimate from a state-policy table — verify with the county assessor before closing.
Climate risk First Street
- Flood 5/10 Major FEMA zone X (shaded) · 24% chance over 30 yrs
- Wildfire 3/10 Moderate
- Heat 10/10 Extreme 7 d/yr ≥116°F today · 25 d/yr by 30 yrs out
- Wind 9/10 Extreme 99% chance of damaging wind over 30 yrs
- Air quality 2/10 Low 1 unhealthy d/yr today · 2 by 30 yrs out
Nearby sold comps map
Loading sold comps map…
Walkable amenities ~0.75 mi
Loading nearby amenities…
Taxation est. · year 1
- Rental income
- $21,074
- − Mortgage interest
- −$8,122
- − Property taxes
- −$4,923
- − Insurance
- −$725
- − Repairs & maintenance
- −$1,686
- − Management
- −$1,686
- − Depreciation
- −$4,218
- Taxable loss
- −$286
- Est. tax savings @ 24.0%
- +$69
- After-tax cash flow
- $1,944/yr
For passive investors: Depreciation is non-cash, so a rental often shows a tax loss while cash-flowing — sheltering income. Rental losses are passive: they offset passive income freely, and up to $25,000/yr can offset ordinary (W-2) income if you actively participate and your MAGI is under $100k (phasing out to $0 by $150k); unused losses carry forward. On sale, claimed depreciation is recaptured at up to 25%, and gains may owe capital-gains tax (a 1031 exchange can defer both). Figures are a year-1 estimate at your 24.0% rate — not tax advice; consult a CPA.
Schools (NCES district)
- District
- Brazosport ISD
- NCES district ID
- 4811190
- Math proficiency
- 43% ▼ -6.00%
- Reading proficiency
- 41% ▼ -2.00%
- Median HH income
- $57,024
- Composite
- 36.84/100
- National rank
- #4557
- State rank
- #305 of 826 in TX
Livability — Jones Creek
- Score
- 66/100
- State rank
- #633
- US rank
- #12077
Category grades
Schools grade is shown separately in the Schools card above.
Census & demographics
- Census place
- Jones Creek, TX
- County
- Brazoria County · 374,982 people
- Metro
- Houston-The Woodlands-Sugar Land, TX
- Population (ZIP)
- 16,996
- Household income
- $66,507
- Rent vs Own
- Severe rent burden
- 354.0
Population outlook (Brazoria County) Hauer SSP2
- Today (2025)
- 420,414 people
- By 2030
- 457,585 · +8.8%
- By 2040
- 532,232 · +26.6%
- By 2050
- 605,399 · +44.0%
- By 2075
- 779,358 · +85.4%
- By 2100
- 883,759 · +110.2%
Race, ethnicity, and origin ACS 2023
- Neighborhood character
- Diverse neighborhood (Simpson 0.62)
- Race & ethnicity
- Hispanic / Latino 47% White 38% Two or more races 23% Black 12%
- Hispanic origin (detail)
- Mexican 42%
- Common ancestry
- Romanian 1% Italian 1% Lithuanian 1%
- Foreign-born
- 12% · Canada
- Languages at home
- 71% English-only · Spanish 29%
Political lean MEDSL · Brazoria
- 2024 margin
- R (+19.7) · D 39.5% · R 59.2% · Other 1.3%
- 2008→2024 swing
- +9.9pp toward D · 2008: -29.6pp · 2024: -19.7pp
- All cycles
- 2024: R+19.7 2020: R+18.2 2016: R+24.6 2012: R+34.2 2008: R+29.6
Not yet ingested
- Civics
- —
Market trends
- HPI YoY
- ▼ -110.12%
- Current HPI
- 265.9301
- Rent YoY
- —
- Metro
- Houston-The Woodlands-Sugar Land, TX
- State GDP YoY
- ▲ 3.95%
- F500 in state
- 110
Industry mix (Fortune 500 HQ in TX)
| Industry | F500 HQs | Revenue |
|---|---|---|
| Energy | 16 | $1,198B |
|
||
| Technology | 5 | $198B |
|
||
| Engineering / Construction | 4 | $72B |
|
||
| Energy Services | 3 | $60B |
|
||
| Utilities | 3 | $41B |
|
||
| Healthcare | 2 | $330B |
|
||
Price history
-4.0% since first listed24 events — show timeline
- 2026-05-19 Listed $145,000 HARMLS
- 2026-04-30 Listing Removed — HARMLS
- 2025-11-17 Listing Removed — HARMLS
- 2025-11-17 Listed $199,900 HARMLS
- 2025-09-29 Listed $219,000 HARMLS
- 2024-11-30 Listing Removed — HARMLS
- 2024-09-21 Price Changed $210,000 HARMLS
- 2024-07-15 Price Changed $211,000 HARMLS
- 2024-06-29 Price Changed $199,900 HARMLS
- 2024-05-15 Listed $239,900 HARMLS
- 2023-10-11 Sold (Public Records) — Public Records
- 2023-10-09 Sold (MLS) — HARMLS
- 2023-09-09 Pending — HARMLS
- 2023-08-29 Pending — HARMLS
- 2023-08-20 Listed $199,999 HARMLS
- 2023-08-20 Coming Soon $199,999 HARMLS
- 2014-05-13 Sold (Public Records) — Public Records
- 2014-05-12 Sold (MLS) — BCBR
- 2014-01-10 Listed $119,900 BCBR
- 2013-12-27 Listing Removed — HARMLS
- 2013-12-04 Listed $129,900 HARMLS
- 2010-06-22 Sold (Public Records) — Public Records
- 2010-04-18 Listing Removed — HARMLS
- 2009-12-07 Listed $151,000 HARMLS
Property tax history
+3.8%/yrLatest (2025): $4,923 · +18.9% YoY. Source: county tax records.
Cash-flow waterfall
monthlySold comps — $/sqft
last 12 mo · ≤1 miLoading sold comps…