5663 Smoky Hl · Prien, LA
Flood risk 3/10 · Minor
- FEMA flood zone
- X (unshaded)
- Chance of flooding over 30 yrs
- 0.1%
- Est. flood insurance / yr
- $507 – $1,088
Fire risk 2/10 · Minimal
- Est. fire insurance / yr
- $1,269 – $2,357
Heat risk 9/10 · Severe
- Hot days now (above 109°F)
- 7 days/yr
- Hot days in 30 yrs
- 23 days/yr
Wind risk 9/10 · Severe
- Chance of severe wind over 30 yrs
- 99.0%
Air-quality risk 2/10 · Minimal
- Unhealthy air days now
- 1 days/yr
- Unhealthy air days in 30 yrs
- 1 days/yr
Risk factors via First Street. Map © Google.
Why this score? — see what drove the B- grade
The composite is a weighted blend of 9 inputs, each scored 0–100. Each bar is that input's sub-score; the figure is the points it added to the 100-point composite (weight × sub-score).
- Cash flow +29.6/30.0
- DSCR +10.0/10.0
- 1% rule +7.5/10.0
- ARV discount +6.0/15.0
- Rent growth +5.0/5.0
- Livability +3.2/5.0
- Schools +3.1/10.0
- Condition / age +2.5/5.0
- Appreciation +0.0/10.0
$219,000
🖨 Deal sheet 📄 Offer letter ✓ Due diligence
Listing remarks MLS
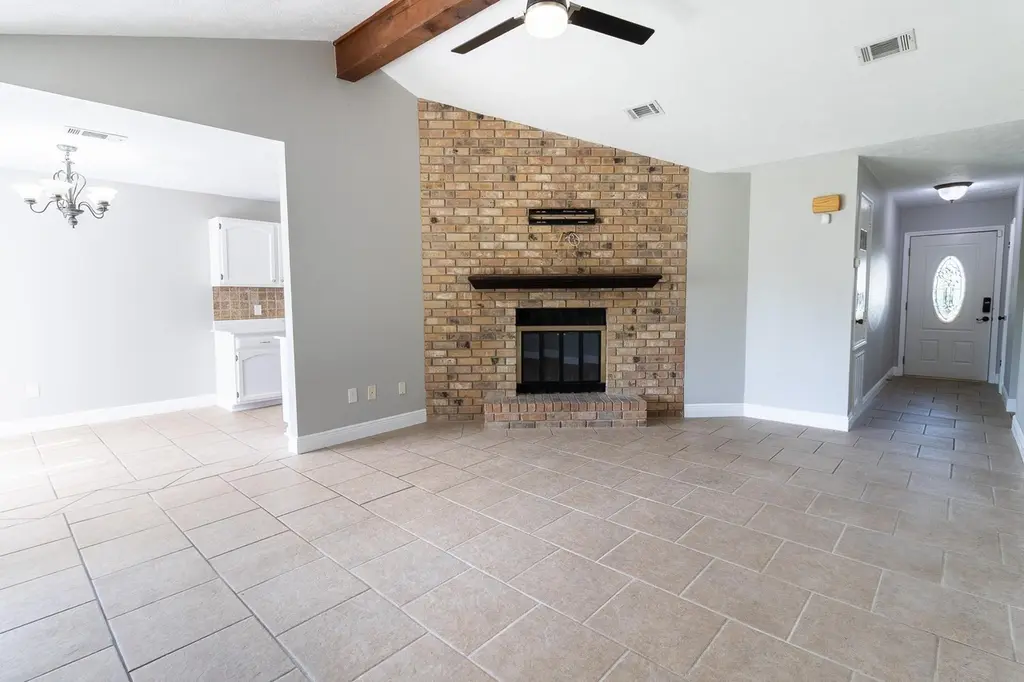
Recently updated 4-bedroom, 2-bath home located in desirable South Lake Charles. This home features a spacious layout with a cozy fireplace, two-car garage, and a covered back patio overlooking the backyard. Two bedrooms offer large walk-in closets. The home is located in flood zone X which means no flood insurance is required.
Key facts
- Covered back patio
- Cozy fireplace
- 7,405 sq ft lot
Tags
Property features AI
Finance
- Other: Lot dimensions approximately 124 x 72 x 58 x 111 (0.17 acre)
Exterior
- Utilities: Property zoned residential
- Home design: Single-family residence; Single-story
- Exterior features: Front porch
Interior
- Kitchen: Dishwasher; Disposal
- Bedrooms: Total of 7 rooms (bedroom count not specified)
- Bathrooms: 2 full bathrooms
- Heating & cooling: Central air
- Interior features: Dishwasher; Disposal; Central air conditioning
Neighborhood map
What this means for you Summary
Snapshot
- This is a 4-bed/2.0-bath single-family listed at $219k.
Deal economics
- At list price, monthly cash flow is $793 ($10k/yr) — positive.
- The deal already cash-flows at list — no discount required.
- Meets the 1% rule at list price ($3k rent vs $219k).
- Recommended offer: $216k (1.5% below list) — sets the bar for market timing.
- Cap rate 10.6% vs local median 4.7% in Prien — top-decile yield for the area; either an underpriced asset or a hidden risk that comps aren't pricing in. Stress-test before assuming the spread holds.
Location & tenants
- Location reads 64/100 on livability (#174 in LA) — a middle-class / working-renter tenant base. Strengths: employment A+, housing A+, crime A; Watch: schools F, amenities F, commute F.
- Calcasieu Parish (other): math 30% / reading 44% proficiency, ranked #29 of 98 in LA (top 30%) — families likely to look elsewhere, expect single-tenant / working-renter base with shorter leases.
- Market conditions: Rents rising fast (+15.1%/yr); 456 active listings in the ZIP; 3 comparable units currently listed for rent nearby; rentals lingering (median 44d on market — plan ~5-8 weeks vacancy on turnover, expect pricing pressure); 67% of comp listings sitting > 30 days — soft ceiling on asking rent; solid renter incomes; 1,298 units permitted in Calcasieu Parish in 2024 (526 in 5+ unit buildings).
- This rent runs 38% of the median local income ($86k/yr) — at the standard rent-burdened threshold; future hikes will face affordability resistance.
Forward outlook
- Local home prices are declining (-3.0%/yr); year-one equity from $2k of loan paydown is wiped out by about $7k of value loss. Plan a longer hold.
- Calcasieu County population projected at +11% by 2050 — modest demand growth; plan on rents tracking national, not racing it.
- At projected returns (-3.0% appreciation + 8.0% rent growth), your $61k cash investment doubles in ~6 years — after that, you're playing with house money.
Negotiation context
- It's been on market 29 days — a 2% lower offer ($216k) is reasonable based on typical stale-listing flexibility.
- 4 sale attempts with the ask held roughly flat each time — persistent listings suggest the price (not the market) is what's stuck; bring a comps-based counter.
- Current owner paid $190k; 15% above their basis — modest negotiation headroom, anchor on the comps not their cost.
Risks & watch-outs
- Climate carrying-cost: severe wind risk, 99% chance of damaging wind over 30y; extreme-heat days projected 7→23/yr by 2055 (HVAC capex compounding) — expect insurance premiums to compound above CPI over the hold.
Questions for the listing agent
- Is there a deadline driving the sale (1031 exchange, divorce, estate, relocation)? That informs how much negotiation room exists.
- Schools are F-rated, which usually means shorter tenancies and higher turnover. Who's the typical renter profile here, and what's been the actual vacancy rate?
- What's the average days-on-market for RENTAL listings here right now (not sales)? A rising rental-DOM trend means longer vacancies and softer asking-rent achievability than the comps imply.
- What's the recent tenant-quality profile in this submarket — average credit score on applications, eviction rate, late-payment / NSF rate, and stable-employment percentage? A property-management company in the area should have these aggregated.
- How much new for-sale + rental construction is in the pipeline within 1–3 miles? Heavy new supply typically softens prices + rents 12–24 months out; constrained supply supports both.
Investment metrics
- 1% rule
- 1.25% ✓
- Cap rate
- 10.64%
- Cash-on-cash
- 15.52%
- DSCR
- 1.69
- GRM
- 6.6
CMA / ARV
- ARV (median comp)
- $211,935
- List price
- $219,000
- Delta
- 3.33%
- Verdict
- FAIR
- Comps
- 20 within 1.0 mi
Show comp detail 12 sales within ~0.75 mi
| Address | Dist | Beds/Ba | Sqft | Sold | Price | $/sf | Match |
|---|---|---|---|---|---|---|---|
| 906 Aberdeen Dr | 0.19mi | 3/2.0 (-1) | 1,600 (-3%) | 9mo | $214,000 | $134 | 74 |
| 5710 Stonehaven Ln | 0.10mi | 3/2.0 (-1) | 1,624 (-1%) | 20mo | $220,000 | $135 | 72 |
| 1094 Spanish Mission Trl | 0.16mi | 3/2.0 (-1) | 1,524 (-7%) | 9mo | $200,000 | $131 | 68 |
| 1077 Spanish Mission Trl | 0.14mi | 3/2.0 (-1) | 1,750 (+6%) | 13mo | $210,000 | $120 | 68 |
| 5702 Stonehaven Ln | 0.10mi | 3/2.0 (-1) | 1,777 (+8%) | 13mo | $225,000 | $127 | 66 |
| 5704 Stonehaven Ln | 0.10mi | 3/2.0 (-1) | 1,504 (-9%) | 15mo | $205,000 | $136 | 64 |
| 401 Montclair St | 0.74mi | 4/2.0 | 1,760 (+7%) | 4mo | $263,000 | $149 | 50 |
| 5737 E Dietrich Loop | 0.47mi | 3/2.0 (-1) | 1,824 (+11%) | 14mo | $273,500 | $150 | 43 |
| 425 Avalon St | 0.71mi | 3/2.0 (-1) | 1,465 (-11%) | 2mo | $239,000 | $163 | 42 |
| 820 Lakeridge Ln | 0.60mi | 3/2.0 (-1) | 1,890 (+15%) | 6mo | $245,000 | $130 | 38 |
| 5727 W Dietrich Loop W | 0.52mi | 3/2.0 (-1) | 1,824 (+11%) | 19mo | $266,000 | $146 | 37 |
| 614 Lionel Ln | 0.49mi | 3/2.0 (-1) | 1,856 (+13%) | 23mo | $295,000 | $159 | 31 |
Match score weights: distance 35% · size 25% · config 20% · recency 20%. Top-matched comps best support the ARV.
Projected returns pro-forma
-3.0% appreciation · 8.0% rent growth · sell at horizon
- IRR
- 11.5%
- Equity multiple
- 1.48×
- Total profit
- $29,485
- Equity at exit
- $32,654
- IRR
- 24.0%
- Equity multiple
- 3.55×
- Total profit
- $156,591
- Equity at exit
- $18,935
Cash invested: $61,320 (down + closing). Projections, not guarantees.
Landlord ↔ Tenant lean methodology
- Overall (STATE)
- 90 Strongly Landlord-Friendly
- State Louisiana
- 90 Strongly Landlord-Friendly · R+12
- County
- — inherits STATE
- City
- — inherits STATE
ZIP-level market 70605
- Rents YoY
- 15.1%
- Active inventory
- 456
- Price-to-rent
- 6.6×
Monthly cashflow live
- Estimated rent
- $2,746 medium interval (Pro) →
- Mortgage (P&I)
- −$1,148
- Tax from tax record
- −$137 /mo · $1,646/yr
- Insurance
- −$91
- HOA
- −$0
- Vacancy / Maint / Mgmt
- −$577
- Net cashflow
- $793
Break-even live
UW: 25.0% down · 7.5% · 30yr · 1.5% tax · 5.0% vac · 8.0% maint · 8.0% mgmt
Financing live
Cash to close
- Down payment
- $54,750
- Closing costs
- $6,570
- Reserves months
- —
- Total cash needed
- —
Loan-product check · same deal, 3 products live
Conventional
25% down · 7.5% · 30yr
- Down + closing
- —
- Monthly P&I
- —
- Monthly cashflow
- —
- DSCR
- —
- Eligible?
- —
Personal DTI + credit; lowest rate.
DSCR
20% down · 8.5% · 30yr
- Down + closing
- —
- Monthly P&I
- —
- Monthly cashflow
- —
- DSCR
- —
- Eligible?
- —
No personal income docs; deal must DSCR.
Hard money
10% down · 12.0% · 12mo
- Down + closing
- —
- Monthly P&I
- —
- Monthly cashflow
- —
- DSCR
- —
- Eligible?
- —
Short-term bridge; refi at stabilization.
Rent comps 3 comps
| Address | Beds | Baths | Sqft | Rent | $/sqft | DOM | Units | Dist |
|---|---|---|---|---|---|---|---|---|
| 716 Dianne Ln Lake Charles, LA | 3.0 | 2.0 | 2200 | $5,000 | $2.27 | 43d | 1 | 0.57mi |
| 155 Heather St Lake Charles, LA | 3.0 | 2.0 | 1316 | $1,650 | $1.25 | 13d | 1 | 0.83mi |
| 801 Sundale Dr Lake Charles, LA | 3.0 | 1.0 | 1144 | $1,195 | $1.04 | 43d | 1 | 1.20mi |
Listing history 16 events
-
2026-06-19days on market $219,000 Active 29 DOM
-
2026-06-18days on market $219,000 Active 28 DOM
-
2026-06-17days on market $219,000 Active 27 DOM
-
2026-06-16days on market $219,000 Active 26 DOM
-
2026-06-15days on market $219,000 Active 25 DOM
-
2026-06-14days on market $219,000 Active 23 DOM
-
2026-06-13days on market $219,000 Active 22 DOM
-
2026-06-10days on market $219,000 Active 20 DOM
-
2026-06-09days on market $219,000 Active 19 DOM
-
2026-06-08days on market $219,000 Active 18 DOM
-
2026-06-07days on market $219,000 Active 17 DOM
-
2026-06-05days on market $219,000 Active 14 DOM
-
2026-06-03status $219,000 Active 7 DOM
-
2026-05-15$219,000 Active 329-char remark
-
2026-05-14$219,000 Active 329-char remark
Show marketing remark (329 chars)
Recently updated 4-bedroom, 2-bath home located in desirable South Lake Charles. This home features a spacious layout with a cozy fireplace, two-car garage, and a covered back patio overlooking the backyard. Two bedrooms offer large walk-in closets. The home is located in flood zone X which means no flood insurance is required.
-
2015-02-25soldstatus $190,000
ⓘ Source: listings_history table (triggers on properties + properties_extension) + one-shot
backfill from property_details.listing_events for pre-trigger history.
Tax reassessment forecast LA · Resets to sale price
- Current annual tax
- $1,646 · $137/mo
- Projected year-2 tax
- $1,646 · $137/mo
- Expected delta
- $0/yr ($0/mo · 0.0%)
ⓘ Screening estimate from a state-policy table — verify with the county assessor before closing.
Climate risk First Street
- Flood 3/10 Moderate FEMA zone X (unshaded) · 10% chance over 30 yrs
- Wildfire 2/10 Low
- Heat 9/10 Extreme 7 d/yr ≥109°F today · 23 d/yr by 30 yrs out
- Wind 9/10 Extreme 99% chance of damaging wind over 30 yrs
- Air quality 2/10 Low 1 unhealthy d/yr today · 1 by 30 yrs out
Nearby sold comps map
Loading sold comps map…
Walkable amenities ~0.75 mi
Loading nearby amenities…
Taxation est. · year 1
- Rental income
- $32,958
- − Mortgage interest
- −$12,267
- − Property taxes
- −$1,646
- − Insurance
- −$1,095
- − Repairs & maintenance
- −$2,637
- − Management
- −$2,637
- − Depreciation
- −$6,371
- Taxable income
- $6,306
- Est. tax owed @ 24.0%
- −$1,513
- After-tax cash flow
- $8,001/yr
For passive investors: Depreciation is non-cash, so a rental often shows a tax loss while cash-flowing — sheltering income. Rental losses are passive: they offset passive income freely, and up to $25,000/yr can offset ordinary (W-2) income if you actively participate and your MAGI is under $100k (phasing out to $0 by $150k); unused losses carry forward. On sale, claimed depreciation is recaptured at up to 25%, and gains may owe capital-gains tax (a 1031 exchange can defer both). Figures are a year-1 estimate at your 24.0% rate — not tax advice; consult a CPA.
Schools (NCES district)
- District
- Calcasieu Parish
- NCES district ID
- 2200330
- Math proficiency
- 30% ▼ -39.00%
- Reading proficiency
- 44% ▼ -33.00%
- Median HH income
- $44,700
- Composite
- 31.45/100
- National rank
- #5979
- State rank
- #29 of 98 in LA
Livability — Prien
- Score
- 64/100
- State rank
- #174
- US rank
- #14370
Category grades
Schools grade is shown separately in the Schools card above.
Census & demographics
- County
- Calcasieu Parish · 170,889 people
- City population
- 133,538
- Metro
- Lake Charles, LA
- Population (ZIP)
- 40,482
- Household income
- $86,015
- Rent vs Own
- Severe rent burden
- 1328.0
Population outlook (Calcasieu County) Hauer SSP2
- Today (2025)
- 212,179 people
- By 2030
- 218,199 · +2.8%
- By 2040
- 228,486 · +7.7%
- By 2050
- 236,208 · +11.3%
- By 2075
- 251,696 · +18.6%
- By 2100
- 247,848 · +16.8%
Race, ethnicity, and origin ACS 2023
- Neighborhood character
- Predominantly White (79%)
- Race & ethnicity
- White 79% Black 10% Hispanic / Latino 6% Two or more races 6% Asian 3%
- Hispanic origin (detail)
- Mexican 2%
- Common ancestry
- Lithuanian 12% Italian 3% Slovak 2%
- Foreign-born
- 6% · Canada, Jamaica
- Languages at home
- 92% English-only · Spanish 4% Other Indo-European 2% Other Asian/Pacific 1%
Political lean MEDSL · Calcasieu
- 2024 margin
- Solid R (+39.6) · D 29.5% · R 69.0% · Other 1.5%
- 2008→2024 swing
- -15.0pp toward R · 2008: -24.6pp · 2024: -39.6pp
- All cycles
- 2024: R+39.6 2020: R+35.2 2016: R+33.3 2012: R+28.7 2008: R+24.6
Not yet ingested
- Civics
- —
Market trends
- HPI YoY
- ▼ -102.68%
- Current HPI
- 105.1903
- Rent YoY
- ▲ 15.10%
- Metro
- Lake Charles, LA
- State GDP YoY
- ▲ 3.29%
- F500 in state
- 10
Industry mix (Fortune 500 HQ in LA)
| Industry | F500 HQs | Revenue |
|---|---|---|
| Telecommunications | 2 | $23B |
|
||
| Utilities | 1 | $12B |
|
||
| Wholesale / Distribution | 1 | $5B |
|
||
| Advertising | 1 | $2B |
|
||
Price history
+15.3% since first listed7 events — show timeline
- 2026-06-03 Relisted — GFPAR
- 2026-06-02 Relisted — SWLAR
- 2026-05-28 Delisted — GFPAR
- 2026-05-21 Pending — SWLAR
- 2026-05-15 Listed $219,000 GFPAR
- 2026-05-14 Listed $219,000 SWLAR
- 2015-02-25 Sold (Public Records) $190,000 Public Records
Property tax history
+3.9%/yrLatest (2025): $1,646 · +2.2% YoY. Source: county tax records.
Cash-flow waterfall
monthlySold comps — $/sqft
last 12 mo · ≤1 miLoading sold comps…