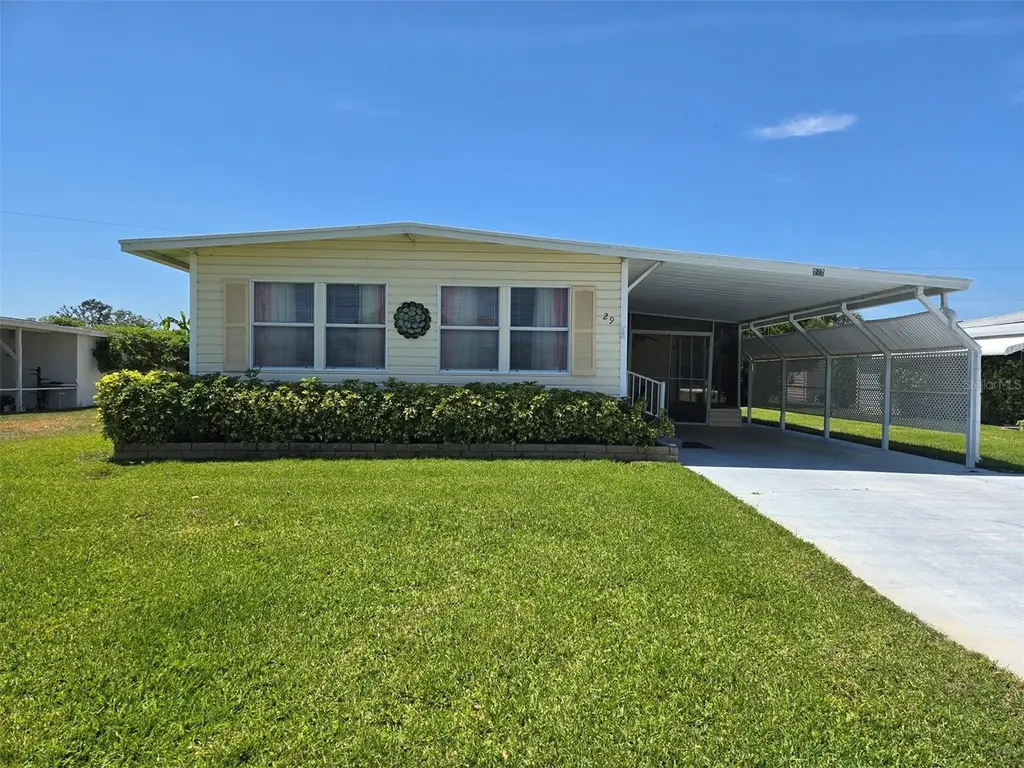
29 Concord Ln #11 · Palm Harbor, FL
Flood risk 4/10 · Minor
- FEMA flood zone
- X (unshaded)
- Chance of flooding over 30 yrs
- 0.13%
- Est. flood insurance / yr
- $507 – $1,088
Fire risk 3/10 · Minor
- Est. fire insurance / yr
- $947 – $1,759
Heat risk 10/10 · Severe
- Hot days now (above 108°F)
- 7 days/yr
- Hot days in 30 yrs
- 26 days/yr
Wind risk 10/10 · Severe
- Chance of severe wind over 30 yrs
- 99.0%
Air-quality risk 3/10 · Minor
- Unhealthy air days now
- 2 days/yr
- Unhealthy air days in 30 yrs
- 2 days/yr
Risk factors via First Street. Map © Google.
Why this score? — see what drove the B- grade
The composite is a weighted blend of 9 inputs, each scored 0–100. Each bar is that input's sub-score; the figure is the points it added to the 100-point composite (weight × sub-score).
- Cash flow +26.8/30.0
- ARV discount +15.0/15.0
- DSCR +9.2/10.0
- 1% rule +6.7/10.0
- Schools +4.3/10.0
- Livability +4.0/5.0
- Condition / age +2.5/5.0
- Rent growth +1.2/5.0
- Appreciation +0.0/10.0
$171,000
🖨 Deal sheet 📄 Offer letter ✓ Due diligence
Listing remarks
Exceptional Value! Affordable and move-in ready! Located in the very popular Lake Tarpon Mobile Home Village 55+ Community. This charming 2BR/2BA manufactured home, built in 1970, sits on a spacious 0.14-acre lot and offers comfortable living with plenty of room to spread out, both inside and out. Step inside to find a light and bright interior with updated double-pane windows in key areas, enhancing energy efficiency and natural light. The home features laminate flooring throughout with tile in both bathrooms, and multiple ceiling fans with light fixtures for added comfort. The eat-in kitchen offers ample storage with two pantry closets, built-in microwave, built-In Oven, a cooktop, range
Key facts
- Laminate flooring
- Two pantry closets
- Eat-in kitchen
Tags
Property features AI
Finance
- Other: Furnished; Lease restrictions apply
- Financial info: Monthly HOA $110 (total annual $1,320)
- HOA & community: Village of Lake Tarpon association (monthly fee $110); Association amenities: clubhouse, pool, spa/hot tub, pickleball courts, shuffleboard, storage; Association covers common area taxes, pool, management, private road, recreational facilities, trash, escrow reserves fund; Association approval required; Deed-restricted, senior community; Pets not allowed
Exterior
- Parking: Driveway parking; Guest parking; Off-street parking; 1-car carport
- Security: Smoke detectors
- Utilities: Public water and well; Public sewer; Electricity connected; Water connected; Sewer connected; Cable available; Broadband/high-speed internet available; Sprinkler meter and sprinkler well
- Home design: Residential mobile home (double wide); Single-story (one level); Completed condition; Faces east; Pillar/post/pier foundation
- Construction: Vinyl siding; Membrane and metal roof
- Exterior features: Covered, screened side porch; Awnings; Exterior lighting; Private mailbox; Rain gutters; Shade shutters; Sidewalk; Sprinkler (metered); Storage shed(s)
Interior
- Kitchen: Cooktop; Range; Range hood; Microwave; Refrigerator; Disposal; Ice maker; Exhaust fan; Electric water heater
- Bedrooms: 2 bedrooms
- Flooring: Ceramic tile; Laminate
- Bathrooms: 2 full bathrooms
- Heating & cooling: Central heating; Central air conditioning
- Interior features: Built-in features; Ceiling fans; Eat-in kitchen; Dining area; Thermostat; Walk-in closets; Window treatments; Blinds; Double-pane windows; Drapes and rods
- Laundry & utility: Washer; Dryer; Laundry room (other)
Neighborhood map
What this means for you Summary
Snapshot
- This is a 2-bed/2.0-bath manufactured listed at $171k.
Deal economics
- At list price, monthly cash flow is $468 ($6k/yr) — positive.
- The deal already cash-flows at list — no discount required.
- Meets the 1% rule at list price ($2k rent vs $171k).
- Recommended offer: $161k (6.0% below list) — sets the bar for market timing.
- Cap rate 9.6% vs local median 3.1% in Palm Harbor — top-decile yield for the area; either an underpriced asset or a hidden risk that comps aren't pricing in. Stress-test before assuming the spread holds.
Location & tenants
- Location reads 81/100 on livability (#95 in FL, #1,470 nationally) — a professional / high-income tenant draw. Strengths: schools A+, housing A+, commute A; Watch: amenities F.
- Pinellas (suburban): math 51% / reading 51% proficiency, ranked #31 of 73 in FL (top 42%) — acceptable for families but not a draw, mixed tenant base, ~2y average lease.
- Market conditions: Rents falling (-5.2%/yr); 371 active listings in the ZIP; 40 comparable units currently listed for rent nearby; rentals at typical pace (median 18d on market — plan ~3-4 weeks tenant-placement turnaround); 2,676 units permitted in Pinellas County in 2024 (1,422 in 5+ unit buildings).
- This rent runs 33% of the median local income ($72k/yr) — at the standard rent-burdened threshold; future hikes will face affordability resistance.
Forward outlook
- Local home prices are declining (-3.0%/yr); year-one equity from $1k of loan paydown is wiped out by about $5k of value loss. Plan a longer hold.
- Pinellas County population projected at +14% by 2050 — modest demand growth; plan on rents tracking national, not racing it.
Negotiation context
- It's been on market 72 days — a 6% lower offer ($161k) is reasonable based on typical stale-listing flexibility.
- 2 sale attempts since 2y ago; this cycle's ask has dropped $14k (8%) from the opening price — seller is motivated, your offer sets the floor, not the list.
- Current owner paid $47k; list at $171k implies a 264% gain — meaningful room to come down on a strong offer.
Risks & watch-outs
- Climate carrying-cost: severe wind risk, 99% chance of damaging wind over 30y; extreme-heat days projected 7→26/yr by 2055 (HVAC capex compounding) — expect insurance premiums to compound above CPI over the hold.
Questions for the listing agent
- It's been on market 72 days. Have you received any prior offers? Is the seller open to a 6% concession, seller financing, or rate buy-down credit?
- Built in 1970 — when were the roof, HVAC, electrical panel, plumbing, and water heater last replaced?
- What does the HOA fee cover, when was the last increase, and are there any pending special assessments or reserve-fund shortfalls?
- Why hasn't it sold? Are there any deal-killer items the seller is aware of (foundation, flood, title, zoning, code violations)?
- Is there a deadline driving the sale (1031 exchange, divorce, estate, relocation)? That informs how much negotiation room exists.
- Schools are A-rated — typically a magnet for longer-tenancy family renters. What's the average tenant stay here, and is there a school-zone premium baked into asking?
- What's the average days-on-market for RENTAL listings here right now (not sales)? A rising rental-DOM trend means longer vacancies and softer asking-rent achievability than the comps imply.
- What's the recent tenant-quality profile in this submarket — average credit score on applications, eviction rate, late-payment / NSF rate, and stable-employment percentage? A property-management company in the area should have these aggregated.
- How much new for-sale + rental construction is in the pipeline within 1–3 miles? Heavy new supply typically softens prices + rents 12–24 months out; constrained supply supports both.
Investment metrics
- 1% rule
- 1.17% ✓
- Cap rate
- 9.58%
- Cash-on-cash
- 11.73%
- DSCR
- 1.52
- GRM
- 7.1
CMA / ARV
- ARV (on-the-fly)
- $223,944
- Comps found
- 1
Show comp detail 1 sale within ~0.75 mi
| Address | Dist | Beds/Ba | Sqft | Sold | Price | $/sf | Match |
|---|---|---|---|---|---|---|---|
| 251 Independence Ave #20 | 0.19mi | 3/2.0 (+1) | 1,084 (+5%) | 15mo | $235,000 | $217 | 66 |
Match score weights: distance 35% · size 25% · config 20% · recency 20%. Top-matched comps best support the ARV.
Projected returns pro-forma
-3.0% appreciation · 0.0% rent growth · sell at horizon
- IRR
- -2.2%
- Equity multiple
- 0.92×
- Total profit
- $-3,779
- Equity at exit
- $25,497
- IRR
- 4.1%
- Equity multiple
- 1.26×
- Total profit
- $12,372
- Equity at exit
- $14,785
Cash invested: $47,880 (down + closing). Projections, not guarantees.
Landlord ↔ Tenant lean methodology
- Overall (STATE)
- 87 Strongly Landlord-Friendly
- State Florida
- 87 Strongly Landlord-Friendly · R+3
- County
- — inherits STATE
- City
- — inherits STATE
ZIP-level market 34684
- Rents YoY
- -5.2%
- Active inventory
- 371
- Price-to-rent
- 7.1×
Monthly cashflow live
- Estimated rent
- $2,002 high interval (Pro) →
- Mortgage (P&I)
- −$897
- Tax from tax record
- −$36 /mo · $427/yr
- Insurance
- −$71
- HOA
- −$110
- Vacancy / Maint / Mgmt
- −$420
- Net cashflow
- $468
Break-even live
UW: 25.0% down · 7.5% · 30yr · 1.5% tax · 5.0% vac · 8.0% maint · 8.0% mgmt
Financing live
Cash to close
- Down payment
- $42,750
- Closing costs
- $5,130
- Reserves months
- —
- Total cash needed
- —
Loan-product check · same deal, 3 products live
Conventional
25% down · 7.5% · 30yr
- Down + closing
- —
- Monthly P&I
- —
- Monthly cashflow
- —
- DSCR
- —
- Eligible?
- —
Personal DTI + credit; lowest rate.
DSCR
20% down · 8.5% · 30yr
- Down + closing
- —
- Monthly P&I
- —
- Monthly cashflow
- —
- DSCR
- —
- Eligible?
- —
No personal income docs; deal must DSCR.
Hard money
10% down · 12.0% · 12mo
- Down + closing
- —
- Monthly P&I
- —
- Monthly cashflow
- —
- DSCR
- —
- Eligible?
- —
Short-term bridge; refi at stabilization.
Rent comps 40 comps
| Address | Beds | Baths | Sqft | Rent | $/sqft | DOM | Units | Dist |
|---|---|---|---|---|---|---|---|---|
| 47 Delaware Ct #10 Palm Harbor, FL | 2.0 | 2.0 | 1008 | $1,800 | $1.79 | 20d | 1 | 0.07mi |
| 21 Lake Shore Dr Palm Harbor, FL | 3.0 | 2.0 | 1434 | $2,895 | $2.02 | 4d | 1 | 0.17mi |
| 245 Lake Tarpon Dr Palm Harbor, FL | 2.0 | 2.0 | 1000 | $1,995 | $2.00 | 2d | 1 | 0.20mi |
| 218 Maple Ave Palm Harbor, FL | 3.0 | 2.0 | 1374 | $2,600 | $1.89 | 17d | 1 | 0.26mi |
| 65 Lake Shore Dr Palm Harbor, FL | 2.0 | 1.0 | 868 | $1,700 | $1.96 | 17d | 1 | 0.27mi |
| 274 Beach Ct #42 Palm Harbor, FL | 2.0 | 2.0 | 1056 | $1,600 | $1.52 | 24d | 1 | 0.29mi |
| 72 Lake Shore Dr Palm Harbor, FL | 3.0 | 2.0 | 1100 | $1,800 | $1.64 | 17d | 1 | 0.34mi |
| 36090 US Highway 19 N Palm Harbor, FL | 1.0–3.0 | 1.0–2.0 | 1046 | $2,557 | $2.44 | 3d | 66 | 0.35mi |
| 35820 U.S. 19 Unit A2 Palm Harbor, FL | 1.0 | 1.0 | 740 | $1,884 | $2.55 | 4d | 1 | 0.46mi |
| 35820 U.S. 19 Unit C1 Palm Harbor, FL | 3.0 | 2.0 | 1404 | $2,781 | $1.98 | 4d | 1 | 0.46mi |
| 35820 U.S. 19 Unit B1 Palm Harbor, FL | 2.0 | 2.0 | 1116 | $2,245 | $2.01 | 4d | 1 | 0.46mi |
| 3277 Fox Chase Cir N #211 Palm Harbor, FL | 2.0 | 2.0 | 825 | $1,495 | $1.81 | 24d | 1 | 0.52mi |
| 36750 US Highway 19 N Unit 19-115 Palm Harbor, FL | 1.0 | 1.0 | 825 | $2,150 | $2.61 | 3d | 1 | 0.55mi |
| 2400 Clubside Ct Palm Harbor, FL | 1.0–3.0 | 1.0–2.0 | 1129 | $1,940 | $1.72 | 1d | 39 | 0.55mi |
| 3300 Fox Chase Cir N Palm Harbor, FL | 2.0 | 2.0 | 906 | $2,125 | $2.35 | 1d | 2 | 0.60mi |
| 3121 Beecher Dr E Unit A Palm Harbor, FL | 2.0 | 2.0 | 976 | $2,100 | $2.15 | 7d | 1 | 0.73mi |
| 2141 Portofino Pl Palm Harbor, FL | 1.0 | 1.0 | 700 | $1,510 | $2.16 | 24d | 2 | 0.75mi |
| 3023 Beecher Dr E Unit D Palm Harbor, FL | 3.0 | 2.5 | 1425 | $2,400 | $1.68 | 17d | 1 | 0.75mi |
| 2199 Chianti Pl Unit 9-0923 Palm Harbor, FL | 2.0 | 2.0 | 1030 | $2,300 | $2.23 | 24d | 1 | 0.78mi |
| 2200 Tuscany Trce #15 Palm Harbor, FL | 3.0 | 2.0 | 1300 | $2,300 | $1.77 | 24d | 1 | 0.78mi |
| 2151 Chianti Pl Unit 127 Palm Harbor, FL | 2.0 | 2.0 | 1085 | $1,700 | $1.57 | 23d | 1 | 0.78mi |
| 2139 Chianti Pl Unit 154 Palm Harbor, FL | 1.0 | 1.0 | 830 | $1,700 | $2.05 | 24d | 1 | 0.78mi |
| 2249 Portofino Pl #2221 Palm Harbor, FL | 2.0 | 2.0 | 1200 | $1,795 | $1.50 | 13d | 1 | 0.79mi |
| 2481 Malcolm Dr Palm Harbor, FL | 2.0 | 2.0 | 1319 | $2,600 | $1.97 | 17d | 1 | 0.81mi |
| 2218 Portofino Pl #247 Palm Harbor, FL | 2.0 | 2.5 | 1050 | $1,895 | $1.80 | 17d | 1 | 0.81mi |
| 2176 Portofino Pl Unit 26-026 Palm Harbor, FL | 1.0 | 1.0 | 830 | $1,600 | $1.93 | 24d | 1 | 0.84mi |
| 2139 Chianti Pl Unit 15-0153 Palm Harbor, FL | 2.0 | 2.0 | 1226 | $1,823 | $1.49 | 4d | 1 | 0.85mi |
| 2571 Cyprus Dr Unit 1-202 Palm Harbor, FL | 2.0 | 2.0 | 975 | $2,800 | $2.87 | 24d | 1 | 0.85mi |
| 2571 Cyprus Dr Unit 1-101 Palm Harbor, FL | 1.0 | 1.0 | 755 | $1,900 | $2.52 | 21d | 1 | 0.85mi |
| 2587 Cyprus Dr Unit 3-214 Palm Harbor, FL | 2.0 | 2.0 | 825 | $2,000 | $2.42 | 24d | 1 | 0.85mi |
| 2171 Portofino Pl #2727 Palm Harbor, FL | 1.0 | 1.0 | 700 | $1,550 | $2.21 | 24d | 1 | 0.86mi |
| 2945 Grovewood Blvd Unit A Palm Harbor, FL | 2.0 | 2.0 | 1030 | $1,775 | $1.72 | 17d | 1 | 0.86mi |
| 2130 Bancroft Pl Unit E Palm Harbor, FL | 2.0 | 2.0 | 1030 | $1,860 | $1.81 | 7d | 1 | 0.90mi |
| 2130 Bancroft Pl Unit E Palm Harbor, FL | 2.0 | 2.0 | 1030 | $1,850 | $1.80 | 3d | 1 | 0.90mi |
| 2107 Portofino Pl Unit 30-3014 Palm Harbor, FL | 3.0 | 2.0 | 1350 | $2,150 | $1.59 | 3d | 1 | 0.93mi |
| 2107 Portofino Pl Unit 30-302 Palm Harbor, FL | 2.0 | 2.0 | 1034 | $2,500 | $2.42 | 7d | 1 | 0.93mi |
| 2107 Portofino Pl Palm Harbor, FL | 2.0 | 2.0 | 1055 | $2,250 | $2.13 | 4d | 2 | 0.93mi |
| 2350 Cypress Pond Rd Palm Harbor, FL | 1.0–2.0 | 1.0–2.0 | 790 | $1,670 | $2.11 | 1d | 54 | 0.99mi |
| 36750 US Highway 19 N Unit 6109 Palm Harbor, FL | 1.0 | 1.0 | 825 | $1,975 | $2.39 | 24d | 1 | 1.03mi |
| 2334 Citrus Hill Rd Palm Harbor, FL | 2.0 | 2.0 | 1189 | $2,350 | $1.98 | 4d | 1 | 1.10mi |
HOA detail
- Monthly dues
- $110 · $1,320/yr
Listing history 20 events
-
2026-06-18days on market $171,000 Active 72 DOM
-
2026-06-17days on market $171,000 Active 71 DOM
-
2026-06-16days on market $171,000 Active 70 DOM
-
2026-06-15days on market $171,000 Active 69 DOM
-
2026-06-13pricedays on market $171,000 Active 67 DOM
-
2026-06-09days on market $173,000 Active 63 DOM
-
2026-06-08days on market $173,000 Active 62 DOM
-
2026-06-07days on market $173,000 Active 61 DOM
-
2026-06-04days on market $173,000 Active 58 DOM
-
2026-06-03days on market $173,000 Active 57 DOM
-
2026-06-01days on market $173,000 Active 55 DOM
-
2026-05-31days on market $173,000 Active 54 DOM
-
2026-05-01price $175,000
-
2026-04-07$185,000 Active
-
2025-09-24historical
-
2025-04-30price $199,900
-
2025-02-12price $239,900
-
2024-06-07$249,900 Active
-
1996-02-27soldstatus $47,000
-
1986-04-01soldstatus $47,500
ⓘ Source: listings_history table (triggers on properties + properties_extension) + one-shot
backfill from property_details.listing_events for pre-trigger history.
Tax reassessment forecast FL · Resets to sale price
- Current annual tax
- $427 · $36/mo
- Projected year-2 tax
- $1,419 · $118/mo
- Expected delta
- +$993/yr (+$83/mo · 232.6%)
ⓘ Screening estimate from a state-policy table — verify with the county assessor before closing.
Climate risk First Street
- Flood 4/10 Moderate FEMA zone X (unshaded) · 13% chance over 30 yrs
- Wildfire 3/10 Moderate
- Heat 10/10 Extreme 7 d/yr ≥108°F today · 26 d/yr by 30 yrs out
- Wind 10/10 Extreme 99% chance of damaging wind over 30 yrs
- Air quality 3/10 Moderate 2 unhealthy d/yr today · 2 by 30 yrs out
Nearby sold comps map
Loading sold comps map…
Walkable amenities ~0.75 mi
Loading nearby amenities…
Taxation est. · year 1
- Rental income
- $24,024
- − Mortgage interest
- −$9,579
- − Property taxes
- −$427
- − Insurance
- −$855
- − Repairs & maintenance
- −$1,922
- − Management
- −$1,922
- − HOA
- −$1,320
- − Depreciation
- −$4,975
- Taxable income
- $3,025
- Est. tax owed @ 24.0%
- −$726
- After-tax cash flow
- $4,890/yr
For passive investors: Depreciation is non-cash, so a rental often shows a tax loss while cash-flowing — sheltering income. Rental losses are passive: they offset passive income freely, and up to $25,000/yr can offset ordinary (W-2) income if you actively participate and your MAGI is under $100k (phasing out to $0 by $150k); unused losses carry forward. On sale, claimed depreciation is recaptured at up to 25%, and gains may owe capital-gains tax (a 1031 exchange can defer both). Figures are a year-1 estimate at your 24.0% rate — not tax advice; consult a CPA.
Schools (NCES district)
- District
- Pinellas
- NCES district ID
- 1201560
- Math proficiency
- 51% ▼ -5.00%
- Reading proficiency
- 51% ▼ -3.00%
- Median HH income
- $46,270
- Composite
- 43.27/100
- National rank
- #3046
- State rank
- #31 of 73 in FL
Livability — Palm Harbor
- Score
- 81/100
- State rank
- #95
- US rank
- #1470
Category grades
Schools grade is shown separately in the Schools card above.
Census & demographics
- Census place
- Palm Harbor, FL
- County
- Pinellas County · 939,478 people
- City population
- 79,072
- Metro
- Tampa-St. Petersburg-Clearwater, FL
- Population (ZIP)
- 27,029
- Household income
- $72,145
- Rent vs Own
- Severe rent burden
- 1495.0
Population outlook (Pinellas County) Hauer SSP2
- Today (2025)
- 1,027,532 people
- By 2030
- 1,063,586 · +3.5%
- By 2040
- 1,125,020 · +9.5%
- By 2050
- 1,168,637 · +13.7%
- By 2075
- 1,265,188 · +23.1%
- By 2100
- 1,260,357 · +22.7%
Race, ethnicity, and origin ACS 2023
- Neighborhood character
- Predominantly White (81%)
- Race & ethnicity
- White 81% Hispanic / Latino 10% Two or more races 8% Asian 4% Black 3%
- Hispanic origin (detail)
- Puerto Rican 2% Cuban 2%
- Common ancestry
- Lithuanian 5% Romanian 5% Scotch-Irish 3%
- Foreign-born
- 13% · Canada, Jamaica, China
- Languages at home
- 84% English-only · Spanish 6% Russian/Polish/Slavic 3% Other Indo-European 2%
Political lean MEDSL · Pinellas
- 2024 margin
- Lean R (+5.2) · D 46.9% · R 52.1%
- 2008→2024 swing
- -13.5pp toward R · 2008: 8.3pp · 2024: -5.2pp
- All cycles
- 2024: R+5.2 2020: D+0.2 2016: R+1.1 2012: D+5.6 2008: D+8.3
Not yet ingested
- Civics
- —
Market trends
- HPI YoY
- ▼ -296.23%
- Current HPI
- 301.651
- Rent YoY
- ▼ -5.17%
- Metro
- Tampa-St. Petersburg-Clearwater, FL
- State GDP YoY
- ▲ 3.28%
- F500 in state
- 36
Industry mix (Fortune 500 HQ in FL)
| Industry | F500 HQs | Revenue |
|---|---|---|
| Industrial Technology | 2 | $29B |
|
||
| Insurance | 2 | $17B |
|
||
| Retail | 1 | $60B |
|
||
| Technology Distribution | 1 | $58B |
|
||
| Homebuilding | 1 | $35B |
|
||
| Technology Manufacturing | 1 | $35B |
|
||
Price history
+268.4% since first listed8 events — show timeline
- 2026-05-01 Price Changed $175,000 Stellar MLS as Distributed by MLS Grid
- 2026-04-07 Listed $185,000 Stellar MLS as Distributed by MLS Grid
- 2025-09-24 Listing Removed — Stellar MLS as Distributed by MLS Grid
- 2025-04-30 Price Changed $199,900 Stellar MLS as Distributed by MLS Grid
- 2025-02-12 Price Changed $239,900 Stellar MLS as Distributed by MLS Grid
- 2024-06-07 Listed $249,900 Stellar MLS as Distributed by MLS Grid
- 1996-02-27 Sold (Public Records) $47,000 Public Records
- 1986-04-01 Sold (Public Records) $47,500 Public Records
Property tax history
-4.9%/yrLatest (2025): $427 · +9.9% YoY. Source: county tax records.
Cash-flow waterfall
monthlySold comps — $/sqft
last 12 mo · ≤1 miLoading sold comps…