1013 S Mullins Ave · Hominy, OK
Flood risk 1/10 · Minimal
- FEMA flood zone
- X (unshaded)
- Chance of flooding over 30 yrs
- 0.0%
- Est. flood insurance / yr
- $507 – $1,088
Fire risk 10/10 · Severe
- Est. fire insurance / yr
- $2,463 – $4,575
Heat risk 5/10 · Moderate
- Hot days now (above 111°F)
- 7 days/yr
- Hot days in 30 yrs
- 19 days/yr
Wind risk 2/10 · Minimal
- Chance of severe wind over 30 yrs
- 2.0%
Air-quality risk 2/10 · Minimal
- Unhealthy air days now
- 1 days/yr
- Unhealthy air days in 30 yrs
- 3 days/yr
Risk factors via First Street. Map © Google.
Why this score? — see what drove the B grade
The composite is a weighted blend of 9 inputs, each scored 0–100. Each bar is that input's sub-score; the figure is the points it added to the 100-point composite (weight × sub-score).
- Cash flow +30.0/30.0
- 1% rule +10.0/10.0
- DSCR +10.0/10.0
- ARV discount +7.5/15.0
- Appreciation +5.1/10.0
- Livability +2.8/5.0
- Rent growth +2.5/5.0
- Condition / age +2.5/5.0
- Schools +0.7/10.0
$50,000
🖨 Deal sheet 📄 Offer letter ✓ Due diligence
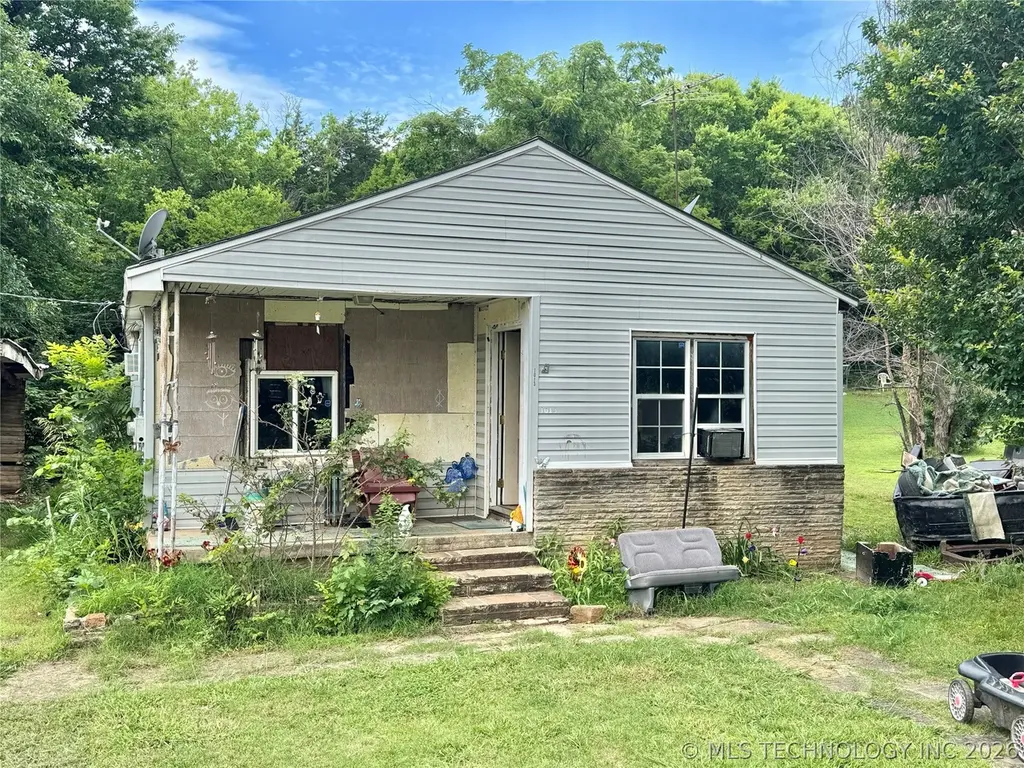
Listing remarks
Looking for a project with potential? This 3-bedroom, 1-bath home offers an opportunity to add value and create something special while still being livable in its current condition. Located in a quiet small-town setting just minutes from the lake, this property could make a great primary residence, weekend retreat, rental property, or investment opportunity. Property is being sold AS-IS.
Key facts
- 2 acre lot
- Built 1930
- Listed 14 days
Property features AI
Finance
- Other: Property sits on approximately 2 acres; Less than 5 miles to nearest water body
Exterior
- Parking: Asphalt parking
- Security: No safety shelter
- Utilities: Electricity available; Natural gas available; Public water; Public sewer
- Home design: Single-story; Faces east; Crawlspace foundation
- Construction: Concrete construction; Vinyl siding; Asphalt/fiberglass roof; Built year from public records
- Exterior features: Mature trees; No other exterior features listed
Interior
- Kitchen: Oven; Range
- Flooring: Laminate flooring
- Bathrooms: 1 full bathroom
- Heating & cooling: Electric heating; Gas heating; Window cooling units
- Interior features: Ceiling fan(s); Laminate counters; Aluminum window frames; No additional exterior interior features listed
- Laundry & utility: Electric dryer hookup; Gas water heater
Neighborhood map
What this means for you Summary
Snapshot
- This is a 3-bed/1.0-bath single-family listed at $50k.
Deal economics
- At list price, monthly cash flow is $481 ($6k/yr) — positive.
- The deal already cash-flows at list — no discount required.
- Meets the 1% rule at list price ($1k rent vs $50k).
Location & tenants
- Location reads 55/100 on livability (#542 in OK) — a working-class tenant base; expect higher turnover. Strengths: cost of living A+, housing A-; Watch: schools F, amenities F, commute F.
- Hominy (town): math 6% / reading 10% proficiency, ranked #259 of 270 in OK (top 96%) — low school quality limits family demand, transient renter base, plan for 1-2y turnover; 64% free/reduced lunch — lower-income household profile, screen leases tightly.
- Market conditions: 23 active listings in the ZIP; 89 units permitted in Osage County in 2024 (0 in 5+ unit buildings).
Forward outlook
- In year one you build about $417 of equity ($346 loan paydown + $71 appreciation (0.1% local appreciation)).
- Osage County population projected to shrink 6% by 2050 — rents likely to lag national; underwrite the cash flow, not the appreciation.
- At projected returns (0.1% appreciation + 3.0% rent growth), your $14k cash investment doubles in ~3 years — after that, you're playing with house money.
Negotiation context
- Only 14 days on market — expect competitive offers; lowballing is unlikely to land.
- 2 sale attempts since 4y ago with the ask held roughly flat each time — persistent listings suggest the price (not the market) is what's stuck; bring a comps-based counter.
Risks & watch-outs
- Watch-outs: built in 1930 — expect roof / HVAC / electrical / plumbing capex.
- Climate carrying-cost: severe wildfire risk; extreme-heat days projected 7→19/yr by 2055 (HVAC capex compounding) — expect insurance premiums to compound above CPI over the hold.
Questions for the listing agent
- Built in 1930 — when were the roof, HVAC, electrical panel, plumbing, and water heater last replaced?
- Is there a deadline driving the sale (1031 exchange, divorce, estate, relocation)? That informs how much negotiation room exists.
- Schools are F-rated, which usually means shorter tenancies and higher turnover. Who's the typical renter profile here, and what's been the actual vacancy rate?
- What's the average days-on-market for RENTAL listings here right now (not sales)? A rising rental-DOM trend means longer vacancies and softer asking-rent achievability than the comps imply.
- What's the recent tenant-quality profile in this submarket — average credit score on applications, eviction rate, late-payment / NSF rate, and stable-employment percentage? A property-management company in the area should have these aggregated.
- How much new for-sale + rental construction is in the pipeline within 1–3 miles? Heavy new supply typically softens prices + rents 12–24 months out; constrained supply supports both.
Investment metrics
- 1% rule
- 2.03% ✓
- Cap rate
- 17.84%
- Cash-on-cash
- 41.25%
- DSCR
- 2.84
- GRM
- 4.1
CMA / ARV
- ARV (on-the-fly)
- $118,800
- Comps found
- 7
Show comp detail 7 sales within ~0.75 mi
| Address | Dist | Beds/Ba | Sqft | Sold | Price | $/sf | Match |
|---|---|---|---|---|---|---|---|
| 703 S Wood Ave | 0.43mi | 3/2.0 | 1,064 (-2%) | 2mo | $128,500 | $121 | 72 |
| 221 E 13th St | 0.55mi | 3/2.5 | 1,104 (+2%) | 10mo | $139,000 | $126 | 56 |
| 1112 S Pettit Ave | 0.50mi | 2/1.0 (-1) | 1,030 (-5%) | 17mo | $113,000 | $110 | 50 |
| 1229 S Wood Ave | 0.44mi | 3/1.5 | 1,186 (+10%) | 20mo | $130,000 | $110 | 44 |
| 1222 S Wood Ave | 0.44mi | 3/1.0 | 1,240 (+15%) | 16mo | $140,000 | $113 | 42 |
| 701 Pettit Ave | 0.50mi | 2/1.0 (-1) | 924 (-14%) | 15mo | $35,000 | $38 | 35 |
| 113 S Division Ave | 0.66mi | 2/2.0 (-1) | 924 (-14%) | 10mo | $29,500 | $32 | 28 |
Match score weights: distance 35% · size 25% · config 20% · recency 20%. Top-matched comps best support the ARV.
Projected returns pro-forma
0.14% appreciation · 3.0% rent growth · sell at horizon
- IRR
- 42.5%
- Equity multiple
- 3.11×
- Total profit
- $29,523
- Equity at exit
- $14,873
- IRR
- 45.3%
- Equity multiple
- 6.15×
- Total profit
- $72,115
- Equity at exit
- $18,163
Cash invested: $14,000 (down + closing). Projections, not guarantees.
Landlord ↔ Tenant lean methodology
- Overall (STATE)
- 83 Strongly Landlord-Friendly
- State Oklahoma
- 83 Strongly Landlord-Friendly · R+20
- County
- — inherits STATE
- City
- — inherits STATE
ZIP-level market 74035
- Home prices YoY
- 0.1%
- Active inventory
- 23
- Price-to-rent
- 4.1×
Monthly cashflow live
- Estimated rent
- $1,015 medium interval (Pro) →
- Mortgage (P&I)
- −$262
- Tax from tax record
- −$37 /mo · $446/yr
- Insurance
- −$21
- HOA
- −$0
- Vacancy / Maint / Mgmt
- −$213
- Net cashflow
- $481
Break-even live
UW: 25.0% down · 7.5% · 30yr · 1.5% tax · 5.0% vac · 8.0% maint · 8.0% mgmt
Financing live
Cash to close
- Down payment
- $12,500
- Closing costs
- $1,500
- Reserves months
- —
- Total cash needed
- —
Loan-product check · same deal, 3 products live
Conventional
25% down · 7.5% · 30yr
- Down + closing
- —
- Monthly P&I
- —
- Monthly cashflow
- —
- DSCR
- —
- Eligible?
- —
Personal DTI + credit; lowest rate.
DSCR
20% down · 8.5% · 30yr
- Down + closing
- —
- Monthly P&I
- —
- Monthly cashflow
- —
- DSCR
- —
- Eligible?
- —
No personal income docs; deal must DSCR.
Hard money
10% down · 12.0% · 12mo
- Down + closing
- —
- Monthly P&I
- —
- Monthly cashflow
- —
- DSCR
- —
- Eligible?
- —
Short-term bridge; refi at stabilization.
Listing history 11 events
-
2026-06-18days on market $50,000 Active 14 DOM
-
2026-06-17days on market $50,000 Active 13 DOM
-
2026-06-16days on market $50,000 Active 12 DOM
-
2026-06-15days on market $50,000 Active 11 DOM
-
2026-06-13days on market $50,000 Active 9 DOM
-
2026-06-12days on market $50,000 Active 8 DOM
-
2026-06-09days on market $50,000 Active 5 DOM
-
2026-06-08days on market $50,000 Active 4 DOM
-
2026-06-08days on market $50,000 Active 3 DOM
-
2026-06-07remarks 390-char remark
-
2026-06-07$50,000 Active 2 DOM
ⓘ Source: listings_history table (triggers on properties + properties_extension) + one-shot
backfill from property_details.listing_events for pre-trigger history.
Tax reassessment forecast OK · Resets to sale price
- Current annual tax
- $446 · $37/mo
- Projected year-2 tax
- $450 · $37/mo
- Expected delta
- +$4/yr ($0/mo · 0.9%)
ⓘ Screening estimate from a state-policy table — verify with the county assessor before closing.
Climate risk First Street
- Flood 1/10 Low FEMA zone X (unshaded) · 0% chance over 30 yrs
- Wildfire 10/10 Extreme
- Heat 5/10 Major 7 d/yr ≥111°F today · 19 d/yr by 30 yrs out
- Wind 2/10 Low 2% chance of damaging wind over 30 yrs
- Air quality 2/10 Low 1 unhealthy d/yr today · 3 by 30 yrs out
Nearby sold comps map
Loading sold comps map…
Walkable amenities ~0.75 mi
Loading nearby amenities…
Taxation est. · year 1
- Rental income
- $12,174
- − Mortgage interest
- −$2,801
- − Property taxes
- −$446
- − Insurance
- −$250
- − Repairs & maintenance
- −$974
- − Management
- −$974
- − Depreciation
- −$1,455
- Taxable income
- $5,275
- Est. tax owed @ 24.0%
- −$1,266
- After-tax cash flow
- $4,509/yr
For passive investors: Depreciation is non-cash, so a rental often shows a tax loss while cash-flowing — sheltering income. Rental losses are passive: they offset passive income freely, and up to $25,000/yr can offset ordinary (W-2) income if you actively participate and your MAGI is under $100k (phasing out to $0 by $150k); unused losses carry forward. On sale, claimed depreciation is recaptured at up to 25%, and gains may owe capital-gains tax (a 1031 exchange can defer both). Figures are a year-1 estimate at your 24.0% rate — not tax advice; consult a CPA.
Schools (NCES district)
- District
- Hominy
- NCES district ID
- 4014970
- Math proficiency
- 6% ▼ -4.00%
- Reading proficiency
- 10% ▼ -7.00%
- Median HH income
- $36,045
- Composite
- 6.62/100
- National rank
- #9990
- State rank
- #259 of 270 in OK
Livability — Hominy
- Score
- 55/100
- State rank
- #542
- US rank
- #23145
Category grades
Schools grade is shown separately in the Schools card above.
Census & demographics
- Census place
- Hominy, OK
- Population (ZIP)
- 4,031
Population outlook (Osage County) Hauer SSP2
- Today (2025)
- 48,950 people
- By 2030
- 48,936 · +-0.0%
- By 2040
- 47,826 · -2.3%
- By 2050
- 45,781 · -6.5%
- By 2075
- 41,140 · -16.0%
- By 2100
- 32,796 · -33.0%
Race, ethnicity, and origin ACS 2023
- Neighborhood character
- Highly diverse neighborhood (Simpson 0.75)
- Race & ethnicity
- White 49% Native American 21% Two or more races 15% Black 9% Hispanic / Latino 6%
- Hispanic origin (detail)
- Mexican 4%
- Common ancestry
- Serbian 1% Lithuanian 1% Italian 1%
- Foreign-born
- 2% · Canada
- Languages at home
- 95% English-only · Spanish 3%
Political lean MEDSL · Osage
- 2024 margin
- Solid R (+41.4) · D 28.4% · R 69.8% · Other 1.7%
- 2008→2024 swing
- -17.7pp toward R · 2008: -23.7pp · 2024: -41.4pp
- All cycles
- 2024: R+41.4 2020: R+39.5 2016: R+36.8 2012: R+25.2 2008: R+23.7
Not yet ingested
- Civics
- —
Market trends
- HPI YoY
- ▲ 0.14%
- Current HPI
- 235.0104
- Rent YoY
- —
- Metro
- —
- State GDP YoY
- ▲ 1.55%
- F500 in state
- 6
Industry mix (Fortune 500 HQ in OK)
| Industry | F500 HQs | Revenue |
|---|---|---|
| Energy | 3 | $48B |
|
||
Price history
+11.1% since first listed5 events — show timeline
- 2026-06-04 Listed $50,000 MLS Technology, Inc.
- 2022-07-27 Pending — MLS Technology, Inc.
- 2022-07-27 Listing Removed — MLS Technology, Inc.
- 2022-07-20 Price Changed $40,000 MLS Technology, Inc.
- 2022-07-14 Listed $45,000 MLS Technology, Inc.
Property tax history
+3.9%/yrLatest (2025): $446 · -1.5% YoY. Source: county tax records.
Cash-flow waterfall
monthlySold comps — $/sqft
last 12 mo · ≤1 miLoading sold comps…