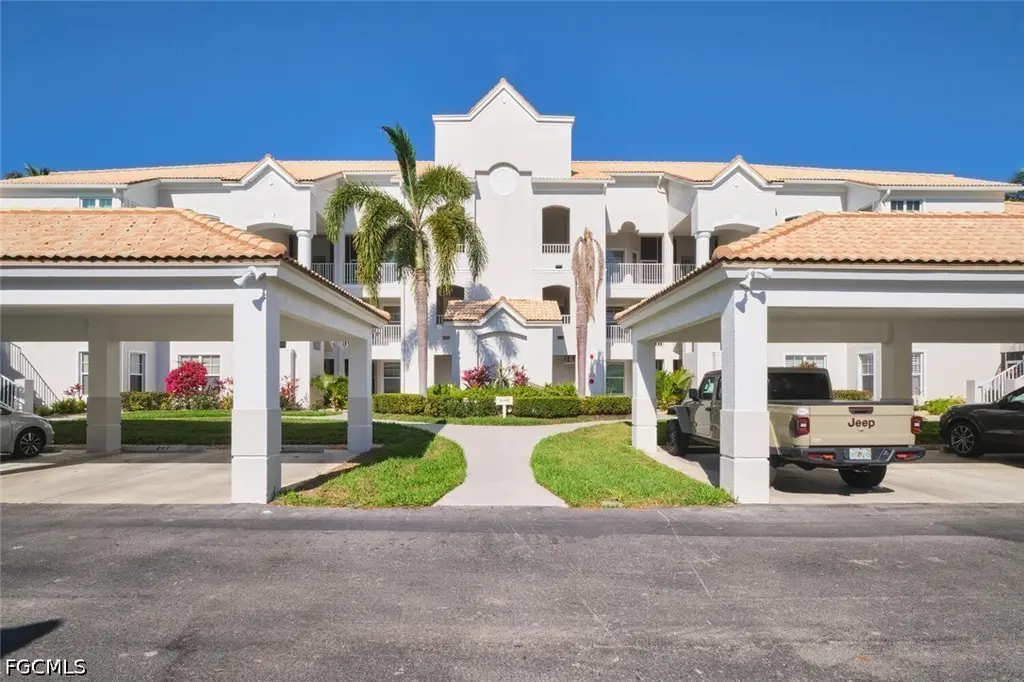
16400 Millstone Cir #206 · Harlem Heights, FL
Flood risk 9/10 · Severe
- FEMA flood zone
- AE
- Chance of flooding over 30 yrs
- 0.99%
- Est. flood insurance / yr
- $1,737 – $8,500
Fire risk 3/10 · Minor
- Est. fire insurance / yr
- $947 – $1,759
Heat risk 10/10 · Severe
- Hot days now (above 107°F)
- 7 days/yr
- Hot days in 30 yrs
- 28 days/yr
Wind risk 10/10 · Severe
- Chance of severe wind over 30 yrs
- 99.0%
Air-quality risk 2/10 · Minimal
- Unhealthy air days now
- 1 days/yr
- Unhealthy air days in 30 yrs
- 1 days/yr
Risk factors via First Street. Map © Google.
Why this score? — see what drove the C- grade
The composite is a weighted blend of 9 inputs, each scored 0–100. Each bar is that input's sub-score; the figure is the points it added to the 100-point composite (weight × sub-score).
- Cash flow +16.7/30.0
- 1% rule +9.9/10.0
- ARV discount +7.5/15.0
- DSCR +5.2/10.0
- Schools +4.1/10.0
- Livability +3.8/5.0
- Condition / age +2.5/5.0
- Rent growth +2.2/5.0
- Appreciation +0.0/10.0
$299,900
🖨 Deal sheet 📄 Offer letter ✓ Due diligence
Listing remarks
3-bedroom condo with sunset views overlooking a lake and the 14th island green! The sellers removed the wall in the kitchen for an open layout to the living room, with a movable butcher block island—making the home feel brighter, larger, and more inviting. This rarely found 2nd floor "Cambridge" is just a short walk to the clubhouse, pool, Sandpiper Restaurant, pro shop, Bocce courts and Pickleball and tennis courts. The kitchen has white cabinetry, granite countertops, and stainless steel appliances. Acrylic sliders, Electric storm shutters and No see-um screening on the lanai. Enjoy direct access to the lanai with views of the golf course’s 14th signature hole and
Key facts
- Open layout
- Views of golf course
- $1,485 HOA
Tags
Property features AI
Finance
- Financial info: Pets allowed conditionally (call); maximum of 2 pets
- HOA & community: Homeowners association with quarterly fees; Association covers cable TV, insurance, internet, legal/accounting, grounds maintenance, pest control, reserve fund, sewer and water; Community amenities include clubhouse, golf course, bocce court, putting green(s), tennis courts, pickleball, pool, restaurant, barbecue and picnic areas, sidewalks, library, and management; Elevator in community; Gated community
Exterior
- Parking: Assigned parking; Guest parking; Detached carport; 1 covered space / 1 carport space
- Security: Gated community with security gate and guard; Fire sprinkler system; Smoke detector(s)
- Utilities: Public water; Public sewer; Cable available
- Home design: 2 stories; Entry level 2; Resale; East-facing
- Construction: Block, concrete and stucco construction; Tile roof
- Exterior features: Shutters (electric); Lanai; Porch; Screened porch; Community pool; Lakefront; West exposure; On golf course; Private road (privately maintained); Reclaimed water irrigation
Interior
- Kitchen: Dishwasher; Range; Microwave; Refrigerator; Disposal
- Bedrooms: Entry level 2
- Flooring: Tile; Vinyl
- Bathrooms: 2 full bathrooms
- Heating & cooling: Central heating (electric); Central air (electric); Ceiling fan(s)
- Interior features: Breakfast bar; Eat-in kitchen; Living/dining room; Pantry; Split bedrooms; Dual sinks; Shower only (separate shower); Walk-in closet(s); Window coverings; Window treatments; High speed internet; Furnished
- Laundry & utility: Washer; Dryer
Neighborhood map
What this means for you Summary
Snapshot
- This is a 3-bed/2.0-bath condo listed at $300k.
Deal economics
- At list price, monthly cash flow is $-240 ($-3k/yr) — negative.
- To cash-flow at today's rent, offer at most $258k (14.1% below list).
- Meets the 1% rule at list price ($4k rent vs $300k).
- Recommended offer: $258k (14.1% below list) — sets the bar for cash-flow.
- Cap rate 7.0% vs local median 2.9% in Harlem Heights — top-decile yield for the area; either an underpriced asset or a hidden risk that comps aren't pricing in. Stress-test before assuming the spread holds.
Location & tenants
- Location reads 75/100 on livability (#263 in FL, #4,209 nationally) — a middle-class / working-renter tenant base. Strengths: crime A+, cost of living A+, health & safety A+; Watch: schools F, amenities F, employment F.
- Lee (suburban): math 47% / reading 50% proficiency, ranked #42 of 73 in FL (top 58%) — families likely to look elsewhere, expect single-tenant / working-renter base with shorter leases.
- Market conditions: Rents soft (-1.2%/yr); 1244 active listings in the ZIP; 21 comparable units currently listed for rent nearby; rentals at typical pace (median 15d on market — plan ~3-4 weeks tenant-placement turnaround); solid renter incomes; 15,411 units permitted in Lee County in 2024 (4,686 in 5+ unit buildings).
- At $4,459/mo this rent would consume 71% of the median local household income ($75k/yr) (locally 1944% of renters already pay >50% of income on rent) — very limited rent-growth headroom before tenants either downsize or default.
Forward outlook
- Local home prices are declining (-3.0%/yr); year-one equity from $2k of loan paydown is wiped out by about $9k of value loss. Plan a longer hold.
- Lee County population projected at +44% by 2050 — long-run rental-demand tailwind backs the buy-and-hold thesis.
Negotiation context
- It's been on market 45 days — a 3% lower offer ($291k) is reasonable based on typical stale-listing flexibility.
- 2 sale attempts; this cycle's ask has dropped $20k (6%) from the opening price — seller is motivated, your offer sets the floor, not the list.
Risks & watch-outs
- Watch-outs: flood insurance adds $427/mo; HOA is 33% of rent.
- Climate carrying-cost: in FEMA flood zone AE (mandatory federal flood insurance); severe wind risk, 99% chance of damaging wind over 30y; extreme-heat days projected 7→28/yr by 2055 (HVAC capex compounding) — expect insurance premiums to compound above CPI over the hold.
Questions for the listing agent
- What do current leases actually rent for vs. the listed asking? Can we see a recent rent roll and the last 12 months of T-12 income?
- It's been on market 45 days. Have you received any prior offers? Is the seller open to a 14% concession, seller financing, or rate buy-down credit?
- What's the actual annual flood-insurance premium (NFIP or private), and is the property in a SFHA with mandatory coverage?
- What does the HOA fee cover, when was the last increase, and are there any pending special assessments or reserve-fund shortfalls?
- Any open or pending special assessments — roof, HVAC, plumbing, elevator, façade? What's the per-unit balance and payoff schedule, and is the seller paying it off at close or rolling it to the buyer?
- Is there a deadline driving the sale (1031 exchange, divorce, estate, relocation)? That informs how much negotiation room exists.
- Schools are F-rated, which usually means shorter tenancies and higher turnover. Who's the typical renter profile here, and what's been the actual vacancy rate?
- What's the average days-on-market for RENTAL listings here right now (not sales)? A rising rental-DOM trend means longer vacancies and softer asking-rent achievability than the comps imply.
- What's the recent tenant-quality profile in this submarket — average credit score on applications, eviction rate, late-payment / NSF rate, and stable-employment percentage? A property-management company in the area should have these aggregated.
- How much new apartment / multifamily construction is in the pipeline within 1–3 miles? Heavy new supply (>2% of stock underway) typically softens rents 12–24 months out; light construction supports rent growth.
Investment metrics
- 1% rule
- 1.49% ✓
- Cap rate
- 7.04%
- Cash-on-cash
- 2.67%
- DSCR
- 1.12
- GRM
- 5.6
CMA / ARV
No comps found within radius.
Projected returns pro-forma
-3.0% appreciation · 0.0% rent growth · sell at horizon
- IRR
- -28.3%
- Equity multiple
- 0.10×
- Total profit
- $-75,822
- Equity at exit
- $44,716
- IRR
- -71.9%
- Equity multiple
- -0.57×
- Total profit
- $-131,688
- Equity at exit
- $25,930
Cash invested: $83,972 (down + closing). Projections, not guarantees.
Landlord ↔ Tenant lean methodology
- Overall (STATE)
- 87 Strongly Landlord-Friendly
- State Florida
- 87 Strongly Landlord-Friendly · R+3
- County
- — inherits STATE
- City
- — inherits STATE
ZIP-level market 33908
- Home prices YoY
- -32.8%
- Rents YoY
- -1.2%
- Active inventory
- 1244
- Price-to-rent
- 5.6×
Monthly cashflow live
- Estimated rent
- $4,459 high interval (Pro) →
- Mortgage (P&I)
- −$1,573
- Tax from tax record
- −$153 /mo · $1,837/yr
- Insurance
- −$125
- Flood insurance flood zone
- −$427 /mo · $5,118/yr
- HOA
- −$1,485
- Vacancy / Maint / Mgmt
- −$936
- Net cashflow
- $-240
Break-even live
UW: 25.0% down · 7.5% · 30yr · 1.5% tax · 5.0% vac · 8.0% maint · 8.0% mgmt
Financing live
Cash to close
- Down payment
- $74,975
- Closing costs
- $8,997
- Reserves months
- —
- Total cash needed
- —
Loan-product check · same deal, 3 products live
Conventional
25% down · 7.5% · 30yr
- Down + closing
- —
- Monthly P&I
- —
- Monthly cashflow
- —
- DSCR
- —
- Eligible?
- —
Personal DTI + credit; lowest rate.
DSCR
20% down · 8.5% · 30yr
- Down + closing
- —
- Monthly P&I
- —
- Monthly cashflow
- —
- DSCR
- —
- Eligible?
- —
No personal income docs; deal must DSCR.
Hard money
10% down · 12.0% · 12mo
- Down + closing
- —
- Monthly P&I
- —
- Monthly cashflow
- —
- DSCR
- —
- Eligible?
- —
Short-term bridge; refi at stabilization.
Rent comps 21 comps
| Address | Beds | Baths | Sqft | Rent | $/sqft | DOM | Units | Dist |
|---|---|---|---|---|---|---|---|---|
| 16421 Millstone Cir Fort Myers, FL | 2.0 | 2.0 | 1068 | $4,400 | $4.12 | 16d | 2 | 0.13mi |
| 16430 Millstone Cir #103 Fort Myers, FL | 2.0 | 2.0 | 1067 | $6,300 | $5.90 | 14d | 1 | 0.15mi |
| 16440 Millstone Cir #203 Fort Myers, FL | 2.0 | 2.0 | 1067 | $6,300 | $5.90 | 14d | 1 | 0.20mi |
| 16471 Millstone Cir #303 Fort Myers, FL | 2.0 | 2.0 | 1068 | $6,100 | $5.71 | 14d | 1 | 0.34mi |
| 16481 Millstone Cir #207 Fort Myers, FL | 3.0 | 2.0 | 1348 | $2,700 | $2.00 | 23d | 1 | 0.38mi |
| 16491 Millstone Cir #207 Fort Myers, FL | 2.0 | 2.0 | 1348 | $2,000 | $1.48 | 14d | 1 | 0.41mi |
| 9170 Southmont Cv Fort Myers, FL | 2.0–3.0 | 2.0 | 1358 | $6,300 | $4.64 | 14d | 1 | 0.58mi |
| 9190 Southmont Cv #309 Fort Myers, FL | 3.0 | 2.0 | 1331 | $6,500 | $4.88 | 2d | 1 | 0.63mi |
| 17020 Willowcrest Way Fort Myers, FL | 2.0–3.0 | 2.0 | 1344 | $6,300 | $4.69 | 16d | 2 | 0.68mi |
| 17006 Middlebrook Ct Fort Myers, FL | 2.0 | 2.0 | 1247 | $6,300 | $5.05 | 14d | 1 | 0.72mi |
| 17006 Middlebrook Ct Fort Myers, FL | 2.0 | 2.0 | 1498 | $6,300 | $4.21 | 16d | 1 | 0.72mi |
| 9140 Southmont Cv #102 Fort Myers, FL | 3.0 | 2.0 | 1331 | $2,500 | $1.88 | 14d | 1 | 0.74mi |
| 8837 E Bay Cir Fort Myers, FL | 2.0 | 2.0 | 1156 | $2,600 | $2.25 | 23d | 1 | 0.84mi |
| 17100 Bridgestone Ct #303 Fort Myers, FL | 2.0 | 2.0 | 1175 | $4,575 | $3.89 | 14d | 1 | 0.91mi |
| 17120 Bridgestone Ct #104 Fort Myers, FL | 2.0 | 2.0 | 1282 | $2,400 | $1.87 | 23d | 1 | 1.00mi |
| 17120 Bridgestone Ct #104 Fort Myers, FL | 2.0 | 2.0 | 1175 | $2,400 | $2.04 | 3d | 1 | 1.00mi |
| 16214 Via Solera Cir #5 Fort Myers, FL | 2.0 | 2.5 | 1300 | $1,750 | $1.35 | 23d | 1 | 1.05mi |
| 15250 Sonoma Dr Fort Myers, FL | 1.0–3.0 | 1.0–2.0 | 1252 | $2,365 | $1.89 | 3d | 31 | 1.15mi |
| 16625 Lake Circle Dr #523 Fort Myers, FL | 2.0 | 2.0 | 1154 | $2,100 | $1.82 | 23d | 1 | 1.39mi |
| 16635 Lake Circle Dr Fort Myers, FL | 2.0 | 2.0 | 1277 | $2,150 | $1.68 | 16d | 2 | 1.41mi |
| 16645 Lake Circle Dr #732 Fort Myers, FL | 2.0 | 2.0 | 1154 | $4,000 | $3.47 | 23d | 1 | 1.45mi |
HOA detail condo
- Monthly dues
- $1,485 · $17,820/yr
- Likely covers
- electricpool
- Assessments
- None detected in remarks — confirm with the listing agent.
Listing history 12 events
-
2026-05-12status Pending
-
2026-04-07price $299,900
-
2026-04-02price $309,900
-
2026-03-28$319,900 Active
-
2025-11-01historical
-
2025-10-06price $369,000
-
2025-05-01$385,000 Active
-
2005-03-18soldstatus $268,000
-
2005-03-15soldstatus $268,000
-
2002-09-09soldstatus $181,500
-
1998-05-04soldstatus $131,900
-
1996-02-08soldstatus $138,900
ⓘ Source: listings_history table (triggers on properties + properties_extension) + one-shot
backfill from property_details.listing_events for pre-trigger history.
Tax reassessment forecast FL · Resets to sale price
- Current annual tax
- $1,837 · $153/mo
- Projected year-2 tax
- $2,489 · $207/mo
- Expected delta
- +$652/yr (+$54/mo · 35.5%)
ⓘ Screening estimate from a state-policy table — verify with the county assessor before closing.
Climate risk First Street
- Flood 9/10 Extreme FEMA zone AE · 99% chance over 30 yrs
- Wildfire 3/10 Moderate
- Heat 10/10 Extreme 7 d/yr ≥107°F today · 28 d/yr by 30 yrs out
- Wind 10/10 Extreme 99% chance of damaging wind over 30 yrs
- Air quality 2/10 Low 1 unhealthy d/yr today · 1 by 30 yrs out
Nearby sold comps map
Loading sold comps map…
Walkable amenities ~0.75 mi
Loading nearby amenities…
Taxation est. · year 1
- Rental income
- $53,508
- − Mortgage interest
- −$16,799
- − Property taxes
- −$1,837
- − Insurance
- −$6,618
- − Repairs & maintenance
- −$4,281
- − Management
- −$4,281
- − HOA
- −$17,820
- − Depreciation
- −$8,724
- Taxable loss
- −$6,851
- Est. tax savings @ 24.0%
- +$1,644
- After-tax cash flow
- $-1,231/yr
For passive investors: Depreciation is non-cash, so a rental often shows a tax loss while cash-flowing — sheltering income. Rental losses are passive: they offset passive income freely, and up to $25,000/yr can offset ordinary (W-2) income if you actively participate and your MAGI is under $100k (phasing out to $0 by $150k); unused losses carry forward. On sale, claimed depreciation is recaptured at up to 25%, and gains may owe capital-gains tax (a 1031 exchange can defer both). Figures are a year-1 estimate at your 24.0% rate — not tax advice; consult a CPA.
Schools (NCES district)
- District
- Lee
- NCES district ID
- 1201080
- Math proficiency
- 47% ▼ -11.00%
- Reading proficiency
- 50% ▼ -4.00%
- Median HH income
- $49,518
- Composite
- 41.49/100
- National rank
- #3458
- State rank
- #42 of 73 in FL
Livability — Harlem Heights
- Score
- 75/100
- State rank
- #263
- US rank
- #4209
Category grades
Schools grade is shown separately in the Schools card above.
Census & demographics
- County
- Lee County · 788,662 people
- Metro
- Cape Coral-Fort Myers, FL
- Population (ZIP)
- 37,423
- Household income
- $75,396
- Rent vs Own
- Severe rent burden
- 1944.0
Population outlook (Lee County) Hauer SSP2
- Today (2025)
- 871,946 people
- By 2030
- 955,468 · +9.6%
- By 2040
- 1,113,587 · +27.7%
- By 2050
- 1,256,891 · +44.1%
- By 2075
- 1,560,270 · +78.9%
- By 2100
- 1,726,848 · +98.0%
Race, ethnicity, and origin ACS 2023
- Neighborhood character
- Predominantly White (88%)
- Race & ethnicity
- White 88% Hispanic / Latino 6% Two or more races 5% Black 3% Asian 1%
- Hispanic origin (detail)
- Mexican 1% Puerto Rican 2%
- Common ancestry
- Romanian 5% Lithuanian 4% Slovak 3%
- Foreign-born
- 10% · Canada, Jamaica
- Languages at home
- 90% English-only · Spanish 4% Russian/Polish/Slavic 1% Other Indo-European 1%
Political lean MEDSL · Lee
- 2024 margin
- Strong R (+28.4) · D 35.5% · R 63.9%
- 2008→2024 swing
- -18.0pp toward R · 2008: -10.4pp · 2024: -28.4pp
- All cycles
- 2024: R+28.4 2020: R+19.2 2016: R+20.4 2012: R+16.6 2008: R+10.4
Not yet ingested
- Civics
- —
Market trends
- HPI YoY
- ▼ -102.22%
- Current HPI
- 209.7595
- Rent YoY
- ▼ -1.18%
- Metro
- Cape Coral-Fort Myers, FL
- State GDP YoY
- ▲ 3.28%
- F500 in state
- 36
Industry mix (Fortune 500 HQ in FL)
| Industry | F500 HQs | Revenue |
|---|---|---|
| Industrial Technology | 2 | $29B |
|
||
| Insurance | 2 | $17B |
|
||
| Retail | 1 | $60B |
|
||
| Technology Distribution | 1 | $58B |
|
||
| Homebuilding | 1 | $35B |
|
||
| Technology Manufacturing | 1 | $35B |
|
||
Price history
+115.9% since first listed12 events — show timeline
- 2026-05-12 Pending — FORTMLS
- 2026-04-07 Price Changed $299,900 FORTMLS
- 2026-04-02 Price Changed $309,900 FORTMLS
- 2026-03-28 Listed $319,900 FORTMLS
- 2025-11-01 Listing Removed — FORTMLS
- 2025-10-06 Price Changed $369,000 FORTMLS
- 2025-05-01 Listed $385,000 FORTMLS
- 2005-03-18 Sold (Public Records) $268,000 Public Records
- 2005-03-15 Sold (MLS) $268,000 FORTMLS
- 2002-09-09 Sold (Public Records) $181,500 Public Records
- 1998-05-04 Sold (Public Records) $131,900 Public Records
- 1996-02-08 Sold (Public Records) $138,900 Public Records
Property tax history
+0.2%/yrLatest (2025): $1,837 · +3.6% YoY. Source: county tax records.
Cash-flow waterfall
monthlySold comps — $/sqft
last 12 mo · ≤1 miLoading sold comps…