2907 S Santa Fe Ave #57 · San Marcos, CA
Flood risk 1/10 · Minimal
- FEMA flood zone
- X (unshaded)
- Chance of flooding over 30 yrs
- 0.0%
- Est. flood insurance / yr
- $507 – $1,088
Fire risk 4/10 · Minor
- Est. fire insurance / yr
- $659 – $1,223
Heat risk 5/10 · Moderate
- Hot days now (above 91°F)
- 7 days/yr
- Hot days in 30 yrs
- 22 days/yr
Wind risk 1/10 · Minimal
- Chance of severe wind over 30 yrs
- —
Air-quality risk 3/10 · Minor
- Unhealthy air days now
- 4 days/yr
- Unhealthy air days in 30 yrs
- 4 days/yr
Risk factors via First Street. Map © Google.
Why this score? — see what drove the C grade
The composite is a weighted blend of 9 inputs, each scored 0–100. Each bar is that input's sub-score; the figure is the points it added to the 100-point composite (weight × sub-score).
- Cash flow +21.6/30.0
- ARV discount +7.5/15.0
- DSCR +6.9/10.0
- 1% rule +5.7/10.0
- Schools +5.4/10.0
- Condition / age +4.0/5.0
- Livability +3.9/5.0
- Rent growth +2.6/5.0
- Appreciation +0.0/10.0
$279,900
🖨 Deal sheet (PDF) 📄 Offer letter ✓ Due diligence
Listing remarks
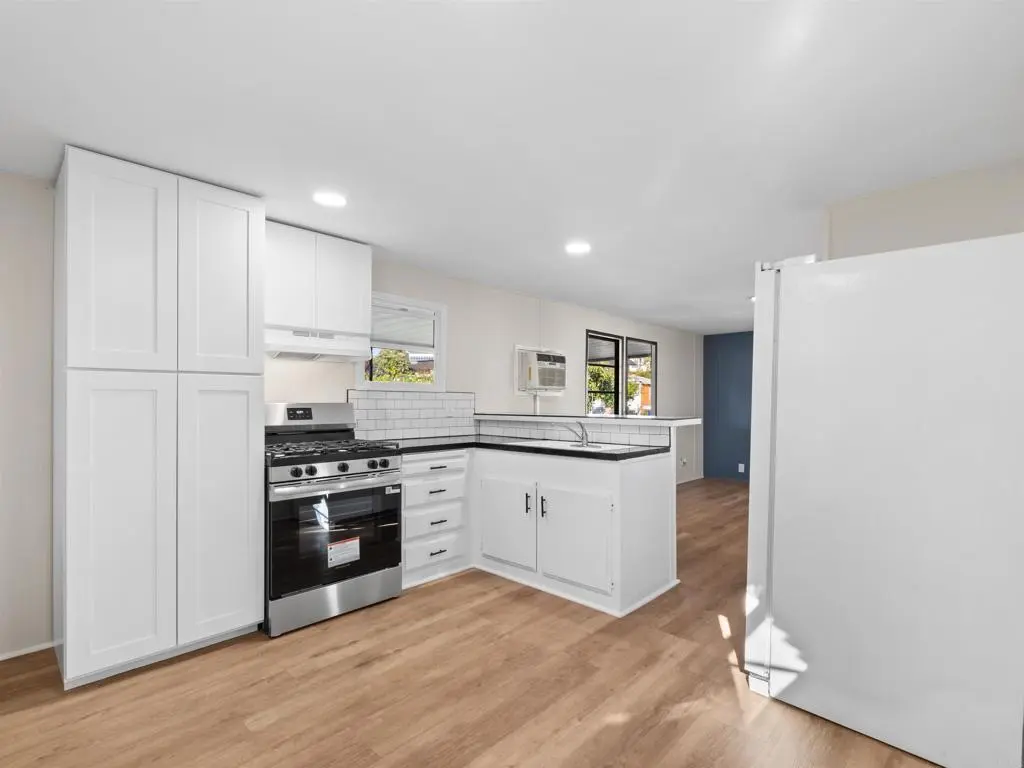
Beautifully remodeled 2-bedroom, 2-bath home located on a desirable corner lot in an all-ages family community in San Marcos. This move-in ready home features an open floor plan, luxury vinyl flooring, fresh paint, updated bathrooms, and a modern kitchen with white shaker cabinets, subway tile backsplash, and stainless steel appliances. Enjoy a spacious covered porch, storage shed, covered parking, and a large side yard with potential for additional parking. Community amenities include a clubhouse, library, billiards room, game room, and community kitchen. Conveniently located near shopping, dining, schools, and freeway access. A great opportunity to own an affordable, turnkey home in San M
Key facts
- Open floor plan
- Modern kitchen
- Corner lot
Tags
Property features AI
Finance
- Other: Lot density: 0–1 unit per acre
- Financial info: Assessments: buyer to verify; Manager approval required
- HOA & community: Land lease community; Land lease amount $1,006
Exterior
- Parking: Located in Springdale Estates park
- Utilities: Public sewer
- Home design: Manufactured/mobile home (12' x 60'); Mobile home remains on site; One story
- Exterior features: Community pool; Street lighting
Interior
- Bathrooms: 2 full bathrooms
- Interior features: All bedrooms on one level; Single-level home; Porch entry
- Laundry & utility: No laundry in unit
Neighborhood map
What this means for you Summary
Snapshot
- This is a 2-bed/2.0-bath manufactured listed at $280k. Condition is rated good.
Deal economics
- At list price, monthly cash flow is $428 ($5k/yr) — positive.
- The deal already cash-flows at list — no discount required.
- Meets the 1% rule at list price ($3k rent vs $280k).
- Recommended offer: $276k (1.5% below list) — sets the bar for market timing.
- Cap rate 8.1% vs local median 2.5% in San Marcos — top-decile yield for the area; either an underpriced asset or a hidden risk that comps aren't pricing in. Stress-test before assuming the spread holds.
Location & tenants
- Location reads 77/100 on livability (#80 in CA, #3,074 nationally) — a middle-class / working-renter tenant base. Strengths: amenities A+, commute A+, employment A+; Watch: health & safety D+, cost of living F.
- San Marcos Unified (suburban): math 52% / reading 67% proficiency, ranked #249 of 1,400 in CA (top 18%) — acceptable for families but not a draw, mixed tenant base, ~2y average lease.
- Market conditions: Rents flat; 115 active listings in the ZIP; 5 comparable units currently listed for rent nearby; rentals leasing fast (median 0d on market — plan ~1-2 weeks tenant-placement turnaround); solid renter incomes; 11,759 units permitted in San Diego County in 2024 (7,244 in 5+ unit buildings).
- This rent runs 37% of the median local income ($97k/yr) — at the standard rent-burdened threshold; future hikes will face affordability resistance.
Forward outlook
- Local home prices are declining (-3.0%/yr); year-one equity from $2k of loan paydown is wiped out by about $8k of value loss. Plan a longer hold.
- San Diego County population projected at +20% by 2050 — long-run rental-demand tailwind backs the buy-and-hold thesis.
Negotiation context
- It's been on market 19 days — a 2% lower offer ($276k) is reasonable based on typical stale-listing flexibility.
Risks & watch-outs
- Climate carrying-cost: extreme-heat days projected 7→22/yr by 2055 (HVAC capex compounding) — expect insurance premiums to compound above CPI over the hold.
Questions for the listing agent
- Built in 1971 — when were the roof, HVAC, electrical panel, plumbing, and water heater last replaced?
- Is there a deadline driving the sale (1031 exchange, divorce, estate, relocation)? That informs how much negotiation room exists.
- What's the average days-on-market for RENTAL listings here right now (not sales)? A rising rental-DOM trend means longer vacancies and softer asking-rent achievability than the comps imply.
- What's the recent tenant-quality profile in this submarket — average credit score on applications, eviction rate, late-payment / NSF rate, and stable-employment percentage? A property-management company in the area should have these aggregated.
- How much new for-sale + rental construction is in the pipeline within 1–3 miles? Heavy new supply typically softens prices + rents 12–24 months out; constrained supply supports both.
Investment metrics
- 1% rule
- 1.07% ✓
- Cap rate
- 8.13%
- Cash-on-cash
- 6.55%
- DSCR
- 1.29
- GRM
- 7.8
CMA / ARV
- ARV (on-the-fly)
- $126,720
- Comps found
- 3
Show comp detail 3 sales within ~0.75 mi
| Address | Dist | Beds/Ba | Sqft | Sold | Price | $/sf | Match |
|---|---|---|---|---|---|---|---|
| 155 Las Flores Dr #36 | 0.20mi | 2/2.0 | 800 (+11%) | 24mo | $309,000 | $386 | 52 |
| 1515 E Capalina Rd Spc 4 | 0.71mi | 1/1.0 (-1) | 676 (-6%) | 10mo | $119,000 | $176 | 39 |
| 1515 Capalina Rd Spc 10 | 0.74mi | 2/1.0 | 818 (+14%) | 18mo | $65,000 | $79 | 24 |
Match score weights: distance 35% · size 25% · config 20% · recency 20%. Top-matched comps best support the ARV.
Projected returns pro-forma
-3.0% appreciation · 0.55% rent growth · sell at horizon
- IRR
- -9.0%
- Equity multiple
- 0.68×
- Total profit
- $-25,275
- Equity at exit
- $41,734
- IRR
- -3.2%
- Equity multiple
- 0.81×
- Total profit
- $-14,870
- Equity at exit
- $24,201
Cash invested: $78,372 (down + closing). Projections, not guarantees.
Landlord ↔ Tenant lean methodology
- Overall (STATE)
- 18 Strongly Tenant-Friendly
- State California
- 18 Strongly Tenant-Friendly · D+13
- County
- — inherits STATE
- City
- — inherits STATE
ZIP-level market 92069
- Rents YoY
- 0.6%
- Active inventory
- 115
- Price-to-rent
- 7.8×
Monthly cashflow live
- Estimated rent
- $2,990 high interval (Pro) →
- Mortgage (P&I)
- −$1,468
- Tax est. 1.5%
- −$350 /mo · $4,198/yr
- Insurance
- −$117
- HOA
- −$0
- Vacancy / Maint / Mgmt
- −$628
- Net cashflow
- $428
Break-even live
Sensitivity live
| Price | -10% $621 | -5% $524 | +0% $428 | +5% $331 | +10% $234 |
|---|---|---|---|---|---|
| Rent | -10% $191 | -5% $309 | +0% $428 | +5% $546 | +10% $664 |
| Rate | -1.0pp $568 | -0.5pp $499 | base $428 | +0.5pp $355 | +1.0pp $281 |
UW: 25.0% down · 7.5% · 30yr · 1.5% tax · 5.0% vac · 8.0% maint · 8.0% mgmt
Financing live
Cash to close
- Down payment
- $69,975
- Closing costs
- $8,397
- Reserves months
- —
- Total cash needed
- —
Loan-product check · same deal, 3 products live
Conventional
25% down · 7.5% · 30yr
- Down + closing
- —
- Monthly P&I
- —
- Monthly cashflow
- —
- DSCR
- —
- Eligible?
- —
Personal DTI + credit; lowest rate.
DSCR
20% down · 8.5% · 30yr
- Down + closing
- —
- Monthly P&I
- —
- Monthly cashflow
- —
- DSCR
- —
- Eligible?
- —
No personal income docs; deal must DSCR.
Hard money
10% down · 12.0% · 12mo
- Down + closing
- —
- Monthly P&I
- —
- Monthly cashflow
- —
- DSCR
- —
- Eligible?
- —
Short-term bridge; refi at stabilization.
Rent comps 5 comps
| Address | Beds | Baths | Sqft | Rent | $/sqft | DOM | Units | Dist |
|---|---|---|---|---|---|---|---|---|
| 221 Smilax Rd Vista, CA | 1.0–2.0 | 1.0–2.0 | 855 | $2,799 | $3.27 | 3d | 8 | 0.23mi |
| 1257 Armorlite Dr San Marcos, CA | 2.0 | 1.0–2.5 | 1226 | $4,330 | $3.53 | 0d | 21 | 1.23mi |
| 856 Heatherwood Ln Vista, CA | 1.0–2.0 | 1.0–2.0 | 786 | $2,950 | $3.75 | 3d | 8 | 1.24mi |
| 1982 Wellington Ln Vista, CA | 1.0–2.0 | 1.0–2.0 | 852 | $3,044 | $3.57 | 0d | 3 | 1.28mi |
| 1045 Armorlite Dr San Marcos, CA | 2.0 | 1.0–3.0 | 902 | $3,398 | $3.77 | 0d | 17 | 1.37mi |
Listing history 12 events
-
2026-06-18days on market $279,900 Active 19 DOM
-
2026-06-17days on market $279,900 Active 18 DOM
-
2026-06-16days on market $279,900 Active 17 DOM
-
2026-06-15days on market $279,900 Active 16 DOM
-
2026-06-13days on market $279,900 Active 14 DOM
-
2026-06-09days on market $279,900 Active 10 DOM
-
2026-06-08days on market $279,900 Active 9 DOM
-
2026-06-07days on market $279,900 Active 8 DOM
-
2026-06-04days on market $279,900 Active 5 DOM
-
2026-06-03days on market $279,900 Active 4 DOM
-
2026-06-02days on market $279,900 Active 3 DOM
-
2026-06-01days on market $279,900 Active 2 DOM
ⓘ Source: listings_history table (triggers on properties + properties_extension) + one-shot
backfill from property_details.listing_events for pre-trigger history.
Climate risk First Street
- Flood 1/10 Low FEMA zone X (unshaded) · 0% chance over 30 yrs
- Wildfire 4/10 Moderate
- Heat 5/10 Major 7 d/yr ≥91°F today · 22 d/yr by 30 yrs out
- Wind 1/10 Low
- Air quality 3/10 Moderate 4 unhealthy d/yr today · 4 by 30 yrs out
Nearby sold comps map
Loading sold comps map…
Walkable amenities ~0.75 mi
Loading nearby amenities…
Taxation est. · year 1
- Rental income
- $35,876
- − Mortgage interest
- −$15,679
- − Property taxes
- −$4,198
- − Insurance
- −$1,400
- − Repairs & maintenance
- −$2,870
- − Management
- −$2,870
- − Depreciation
- −$8,143
- Taxable income
- $717
- Est. tax owed @ 24.0%
- −$172
- After-tax cash flow
- $4,958/yr
For passive investors: Depreciation is non-cash, so a rental often shows a tax loss while cash-flowing — sheltering income. Rental losses are passive: they offset passive income freely, and up to $25,000/yr can offset ordinary (W-2) income if you actively participate and your MAGI is under $100k (phasing out to $0 by $150k); unused losses carry forward. On sale, claimed depreciation is recaptured at up to 25%, and gains may owe capital-gains tax (a 1031 exchange can defer both). Figures are a year-1 estimate at your 24.0% rate — not tax advice; consult a CPA.
Condition & rehab AI · 6 photos
This move-in ready home features an open floor plan, luxury vinyl flooring, fresh paint, updated bathrooms, and a modern kitchen. It is located in a desirable corner lot in an all-ages family community in San Marcos.
Value-add opportunities
- Both Paint exterior and interior — Fresh paint enhances curb appeal and interior aesthetics
- Both Replace air conditioning unit — Modernizing HVAC improves comfort and energy efficiency
- Both Install smart home devices — Enhances convenience and energy savings
Renovation cost estimate screening
Value-add ROI direction
- Both Paint exterior and interior — Fresh paint enhances curb appeal and interior aesthetics ↑
- Both Replace air conditioning unit — Modernizing HVAC improves comfort and energy efficiency ↑
- Both Install smart home devices — Enhances convenience and energy savings ↑
ⓘ Cost ranges are severity-bucket heuristics (US national rule-of-thumb). Get contractor quotes + a written scope before underwriting a rehab budget.
Schools (NCES district)
- District
- San Marcos Unified
- NCES district ID
- 0634880
- Math proficiency
- 52% ▲ 1.00%
- Reading proficiency
- 67% ▲ 2.00%
- Median HH income
- $64,752
- Composite
- 53.67/100
- National rank
- #3093
- State rank
- #249 of 1400 in CA
Livability — San Marcos
- Score
- 77/100
- State rank
- #80
- US rank
- #3074
Category grades
Schools grade is shown separately in the Schools card above.
Census & demographics
- Census place
- San Marcos, CA
- County
- San Diego County · 3,178,799 people
- City population
- 100,940
- Metro
- San Diego-Chula Vista-Carlsbad, CA
- Population (ZIP)
- 47,335
- Household income
- $96,771
- Rent vs Own
- Severe rent burden
- 2399.0
Population outlook (San Diego County) Hauer SSP2
- Today (2025)
- 3,678,185 people
- By 2030
- 3,856,546 · +4.8%
- By 2040
- 4,171,407 · +13.4%
- By 2050
- 4,421,607 · +20.2%
- By 2075
- 4,831,599 · +31.4%
- By 2100
- 4,832,502 · +31.4%
Race, ethnicity, and origin ACS 2023
- Neighborhood character
- Diverse neighborhood (Simpson 0.64)
- Race & ethnicity
- Hispanic / Latino 46% White 36% Two or more races 20% Asian 11% Native American 1% Black 1%
- Hispanic origin (detail)
- Mexican 41%
- Common ancestry
- Lithuanian 2% Romanian 2% Portuguese 2%
- Foreign-born
- 26% · Canada, China, Vietnam
- Languages at home
- 57% English-only · Spanish 32% Tagalog/Filipino 2% Other Asian/Pacific 2%
Political lean MEDSL · San Diego
- 2024 margin
- D (+16.8) · D 56.9% · R 40.1% · Other 2.9%
- 2008→2024 swing
- +6.6pp toward D · 2008: 10.2pp · 2024: 16.8pp
- All cycles
- 2024: D+16.8 2020: D+22.8 2016: D+17.8 2012: D+5.1 2008: D+10.2
Not yet ingested
- Civics
- —
Market trends
- HPI YoY
- ▼ -522.69%
- Current HPI
- 376.182
- Rent YoY
- ▲ 0.55%
- Metro
- San Diego-Chula Vista-Carlsbad, CA
- State GDP YoY
- ▲ 3.21%
- F500 in state
- 116
Industry mix (Fortune 500 HQ in CA)
| Industry | F500 HQs | Revenue |
|---|---|---|
| Technology | 27 | $1,492B |
|
||
| Financial Services | 3 | $174B |
|
||
| Retail | 3 | $44B |
|
||
| Insurance | 3 | $26B |
|
||
| Media / Entertainment | 2 | $115B |
|
||
| Pharmaceuticals / Biotech | 2 | $62B |
|
||
Price history
1 event — show timeline
- 2026-05-28 Listed $279,900 CRMLS
Cash-flow waterfall
monthlySold comps — $/sqft
last 12 mo · ≤1 miLoading sold comps…