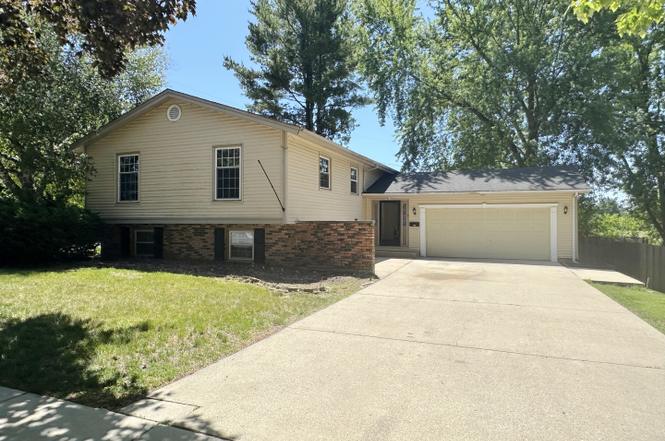
641 Webster St · Algonquin, IL
Flood risk 1/10 · Minimal
- FEMA flood zone
- X (unshaded)
- Chance of flooding over 30 yrs
- 0.0%
- Est. flood insurance / yr
- $473 – $860
Fire risk 1/10 · Minimal
- Est. fire insurance / yr
- $804 – $1,492
Heat risk 3/10 · Minor
- Hot days now (above 101°F)
- 7 days/yr
- Hot days in 30 yrs
- 14 days/yr
Wind risk 2/10 · Minimal
- Chance of severe wind over 30 yrs
- 1.0%
Air-quality risk 2/10 · Minimal
- Unhealthy air days now
- 1 days/yr
- Unhealthy air days in 30 yrs
- 2 days/yr
Risk factors via First Street. Map © Google.
Why this score? — see what drove the C- grade
The composite is a weighted blend of 9 inputs, each scored 0–100. Each bar is that input's sub-score; the figure is the points it added to the 100-point composite (weight × sub-score).
- ARV discount +15.0/15.0
- Cash flow +14.4/30.0
- 1% rule +5.1/10.0
- DSCR +4.4/10.0
- Livability +3.9/5.0
- Rent growth +2.5/5.0
- Schools +2.5/10.0
- Condition / age +2.5/5.0
- Appreciation +0.0/10.0
$319,900
🖨 Deal sheet (PDF) 📄 Offer letter ✓ Due diligence
Listing remarks MLS
Great House, GREAT LOCATION, EAST of the FOX RIVER, Walk to Schools, Library, Community Pool, Parks & Tennis. Close to Bike Trails. Ground Level Mid-Entry Raised Ranch with a very large 2 1/2 Car attached Garage and Driveway. Main level has Open Floor Plan, Kitchen, Living and Dining rooms with access to Deck. Finished walk-out basement with access to screened patio. Fenced yard, nicely landscaped corner lot. The finished basement has a large family room with gas fireplace, 4th bedroom and full bath. This home sits on a Large Lot with Mature trees. It's ready for the next owners to bring it into the 21st Century, It's priced accordingly & could be the Dream Home that you have been looking for at a Very Compelling Price to call your very own. New Roof & Siding 2017, HVAC 2010, Appliances 2011. Includes a one year $600 AHS "Shield Plus" Home Warranty. All of this along with being Sold "AS IS". Quick close is available
Key facts
- 9,583 sq ft lot
- 2 garage spots
- Built 1970
Property features AI
Finance
- Other: School bus service available
- HOA & community: No master association fee required
Exterior
- Parking: Attached garage (2 spaces), concrete driveway; 2 total parking spaces
- Utilities: Public water; Public sewer
- Home design: Detached single-family raised ranch; Approximately 51-60 years old; Fee simple ownership
- Construction: Vinyl siding and brick exterior; Built before 1978
- Exterior features: Fenced yard; Lot dimensions approximately 78 x 133 (less than 0.25 acre)
Interior
- Kitchen: Kitchen on main level
- Bedrooms: 4 bedrooms (Master, three additional: two on main level, one on lower level)
- Flooring: Hardwood flooring in living room, dining room, and kitchen; Laminate flooring in family room
- Bathrooms: 2 full bathrooms; Basement has a bathroom
- Heating & cooling: Natural gas forced air heating; Central air conditioning
- Interior features: Finished walk-out basement; Family room with fireplace; 8 total rooms
- Laundry & utility: In-unit laundry (lower level, 13 x 21)
Neighborhood map
What this means for you Summary
Snapshot
- This is a 4-bed/2.0-bath single-family listed at $320k.
Deal economics
- At list price, monthly cash flow is $62 ($742/yr) — positive.
- The deal already cash-flows at list — no discount required.
- Meets the 1% rule at list price ($3k rent vs $320k).
- Cap rate 6.5% vs local median 3.8% in Algonquin — top-decile yield for the area; either an underpriced asset or a hidden risk that comps aren't pricing in. Stress-test before assuming the spread holds.
Location & tenants
- Location reads 78/100 on livability (#137 in IL, #2,503 nationally) — a middle-class / working-renter tenant base. Strengths: crime A+, employment A+, housing A+; Watch: cost of living C-, amenities F, commute F.
- CUSD 300 (suburban): math 24% / reading 27% proficiency, ranked #261 of 620 in IL (top 42%) — low school quality limits family demand, transient renter base, plan for 1-2y turnover.
- Zoned schools: Eastview Elem School (math 42% / reading 42%, grade F, #336 of 2,056 statewide, top 18%, 385 students, 0% FRL); Algonquin Middle School (math 25% / reading 31%, grade F, #284 of 665 statewide, top 44%, 399 students, 0% FRL); Dundee-Crown High School (math 20% / reading 21%, grade F, #350 of 693 statewide, top 51%, 2,636 students, 0% FRL) — zoned schools average 0% FRL vs 37% district-wide (37 pts lower); this property's tenant base skews higher-income than the district average.
- Market conditions: 117 active listings in the ZIP; 4 comparable units currently listed for rent nearby; rentals at typical pace (median 20d on market — plan ~3-4 weeks tenant-placement turnaround); high-income renter base; 1,595 units permitted in McHenry County in 2024 (485 in 5+ unit buildings).
Forward outlook
- Local home prices are declining (-3.0%/yr); year-one equity from $2k of loan paydown is wiped out by about $10k of value loss. Plan a longer hold.
- McHenry County population projected at -12% by 2050 — secular population decline; favor cash flow + early exit over multi-decade hold.
Negotiation context
- Only 5 days on market — expect competitive offers; lowballing is unlikely to land.
- 3 sale attempts since 8y ago with the ask held roughly flat each time — persistent listings suggest the price (not the market) is what's stuck; bring a comps-based counter.
- Current owner paid $197k; list at $320k implies a 62% gain — meaningful room to come down on a strong offer.
Risks & watch-outs
- Watch-outs: property tax is 2.6% of price.
Questions for the listing agent
- Built in 1970 — when were the roof, HVAC, electrical panel, plumbing, and water heater last replaced?
- Property tax is high relative to price — has the assessment been appealed recently, and will the sale trigger a re-assessment?
- Is there a deadline driving the sale (1031 exchange, divorce, estate, relocation)? That informs how much negotiation room exists.
- What's the average days-on-market for RENTAL listings here right now (not sales)? A rising rental-DOM trend means longer vacancies and softer asking-rent achievability than the comps imply.
- What's the recent tenant-quality profile in this submarket — average credit score on applications, eviction rate, late-payment / NSF rate, and stable-employment percentage? A property-management company in the area should have these aggregated.
- How much new for-sale + rental construction is in the pipeline within 1–3 miles? Heavy new supply typically softens prices + rents 12–24 months out; constrained supply supports both.
Investment metrics
- 1% rule
- 1.01% ✓
- Cap rate
- 6.52%
- Cash-on-cash
- 0.83%
- DSCR
- 1.04
- GRM
- 8.2
CMA / ARV
- ARV (on-the-fly)
- $434,712
- Comps found
- 12
Show comp detail 12 sales within ~0.75 mi
| Address | Dist | Beds/Ba | Sqft | Sold | Price | $/sf | Match |
|---|---|---|---|---|---|---|---|
| 719 Webster St | 0.12mi | 4/2.0 | 2,400 (-2%) | 3mo | $425,000 | $177 | 88 |
| 610 Chelsea Dr | 0.28mi | 3/3.0 (-1) | 2,452 (-0%) | 8mo | $399,900 | $163 | 71 |
| 910 S Vista Dr | 0.36mi | 4/3.0 | 2,524 (+3%) | 8mo | $407,000 | $161 | 68 |
| 345 Souwanas Trl | 0.48mi | 4/2.0 | 2,400 (-2%) | 9mo | $385,000 | $160 | 67 |
| 407 La Fox River Dr | 0.53mi | 4/2.5 | 2,268 (-8%) | 2mo | $682,000 | $301 | 59 |
| 1245 Winaki Trl | 0.67mi | 4/3.0 | 2,418 (-2%) | 4mo | $405,000 | $167 | 58 |
| 1405 Charles Ave | 0.69mi | 5/3.0 (+1) | 2,401 (-2%) | 1mo | $425,000 | $177 | 54 |
| 19N963 Manito Trl | 0.41mi | 4/4.0 | 2,101 (-14%) | 0mo | $425,000 | $202 | 48 |
| 643 Kingsbury Ct | 0.60mi | 4/2.5 | 2,239 (-9%) | 9mo | $342,500 | $153 | 48 |
| 400 Diamond Back Way | 0.70mi | 4/3.5 | 2,700 (+10%) | 5mo | $494,000 | $183 | 40 |
| 1031 Timberwood Ln | 0.58mi | 3/2.5 (-1) | 2,100 (-14%) | 3mo | $390,000 | $186 | 39 |
| 620 Old Oak Cir | 0.64mi | 3/2.5 (-1) | 2,092 (-15%) | 5mo | $400,000 | $191 | 34 |
Match score weights: distance 35% · size 25% · config 20% · recency 20%. Top-matched comps best support the ARV.
Projected returns pro-forma
-3.0% appreciation · 3.0% rent growth · sell at horizon
- IRR
- -14.9%
- Equity multiple
- 0.47×
- Total profit
- $-47,675
- Equity at exit
- $47,698
- IRR
- -6.1%
- Equity multiple
- 0.60×
- Total profit
- $-35,534
- Equity at exit
- $27,659
Cash invested: $89,572 (down + closing). Projections, not guarantees.
Landlord ↔ Tenant lean methodology
- Overall (STATE)
- 43 Moderately Tenant-Leaning
- State Illinois
- 43 Moderately Tenant-Leaning · D+7
- County
- — inherits STATE
- City
- — inherits STATE
ZIP-level market 60102
- Active inventory
- 117
- Price-to-rent
- 8.2×
Monthly cashflow live
- Estimated rent
- $3,237 medium interval (Pro) →
- Mortgage (P&I)
- −$1,678
- Tax from tax record
- −$685 /mo · $8,214/yr
- Insurance
- −$133
- HOA
- −$0
- Vacancy / Maint / Mgmt
- −$680
- Net cashflow
- $62
Break-even live
Sensitivity live
| Price | -10% $243 | -5% $152 | +0% $62 | +5% $-29 | +10% $-119 |
|---|---|---|---|---|---|
| Rent | -10% $-194 | -5% $-66 | +0% $62 | +5% $190 | +10% $318 |
| Rate | -1.0pp $223 | -0.5pp $143 | base $62 | +0.5pp $-21 | +1.0pp $-105 |
UW: 25.0% down · 7.5% · 30yr · 1.5% tax · 5.0% vac · 8.0% maint · 8.0% mgmt
Financing live
Cash to close
- Down payment
- $79,975
- Closing costs
- $9,597
- Reserves months
- —
- Total cash needed
- —
Loan-product check · same deal, 3 products live
Conventional
25% down · 7.5% · 30yr
- Down + closing
- —
- Monthly P&I
- —
- Monthly cashflow
- —
- DSCR
- —
- Eligible?
- —
Personal DTI + credit; lowest rate.
DSCR
20% down · 8.5% · 30yr
- Down + closing
- —
- Monthly P&I
- —
- Monthly cashflow
- —
- DSCR
- —
- Eligible?
- —
No personal income docs; deal must DSCR.
Hard money
10% down · 12.0% · 12mo
- Down + closing
- —
- Monthly P&I
- —
- Monthly cashflow
- —
- DSCR
- —
- Eligible?
- —
Short-term bridge; refi at stabilization.
Rent comps 4 comps
| Address | Beds | Baths | Sqft | Rent | $/sqft | DOM | Units | Dist |
|---|---|---|---|---|---|---|---|---|
| 973 Old Oak Cir Algonquin, IL | 3.0 | 2.5 | 1600 | $2,995 | $1.87 | 0d | 1 | 0.46mi |
| 1311 Blue Ridge Pkwy Algonquin, IL | 4.0 | 2.5 | 2432 | $3,100 | $1.27 | 7d | 1 | 0.96mi |
| 1037 N Harrison St Algonquin, IL | 4.0 | 2.5 | 1600 | $3,500 | $2.19 | 20d | 1 | 0.97mi |
| 530 Eagle Ridge Ln Algonquin, IL | 4.0 | 2.5 | 2434 | $3,000 | $1.23 | 26d | 1 | 1.44mi |
Listing history 4 events
-
2026-06-21days on market $319,900 Active 5 DOM
-
2026-06-18days on market $319,900 Active 2 DOM
-
2026-06-16remarks 699-char remark
-
2026-06-16$319,900 Active 1 DOM
ⓘ Source: listings_history table (triggers on properties + properties_extension) + one-shot
backfill from property_details.listing_events for pre-trigger history.
Tax reassessment forecast IL · Partial reset (capped growth)
- Current annual tax
- $8,214 · $685/mo
- Projected year-2 tax
- $8,214 · $685/mo
- Expected delta
- $0/yr ($0/mo · 0.0%)
ⓘ Screening estimate from a state-policy table — verify with the county assessor before closing.
Climate risk First Street
- Flood 1/10 Low FEMA zone X (unshaded) · 0% chance over 30 yrs
- Wildfire 1/10 Low
- Heat 3/10 Moderate 7 d/yr ≥101°F today · 14 d/yr by 30 yrs out
- Wind 2/10 Low 100% chance of damaging wind over 30 yrs
- Air quality 2/10 Low 1 unhealthy d/yr today · 2 by 30 yrs out
Nearby sold comps map
Loading sold comps map…
Walkable amenities ~0.75 mi
Loading nearby amenities…
Taxation est. · year 1
- Rental income
- $38,844
- − Mortgage interest
- −$17,919
- − Property taxes
- −$8,214
- − Insurance
- −$1,600
- − Repairs & maintenance
- −$3,108
- − Management
- −$3,108
- − Depreciation
- −$9,306
- Taxable loss
- −$4,410
- Est. tax savings @ 24.0%
- +$1,058
- After-tax cash flow
- $1,800/yr
For passive investors: Depreciation is non-cash, so a rental often shows a tax loss while cash-flowing — sheltering income. Rental losses are passive: they offset passive income freely, and up to $25,000/yr can offset ordinary (W-2) income if you actively participate and your MAGI is under $100k (phasing out to $0 by $150k); unused losses carry forward. On sale, claimed depreciation is recaptured at up to 25%, and gains may owe capital-gains tax (a 1031 exchange can defer both). Figures are a year-1 estimate at your 24.0% rate — not tax advice; consult a CPA.
Schools (NCES district)
- District
- CUSD 300
- NCES district ID
- 1708550
- Math proficiency
- 24% ▼ -12.00%
- Reading proficiency
- 27% ▼ -11.00%
- Median HH income
- $77,706
- Composite
- 25.12/100
- National rank
- #7524
- State rank
- #261 of 620 in IL
Livability — Algonquin
- Score
- 78/100
- State rank
- #137
- US rank
- #2503
Category grades
Schools grade is shown separately in the Schools card above.
Census & demographics
- Census place
- Algonquin, IL
- County
- McHenry County · 204,279 people
- City population
- 32,286
- Metro
- Chicago-Naperville-Elgin, IL-IN-WI
- Population (ZIP)
- 32,286
- Household income
- $132,949
- Rent vs Own
- Severe rent burden
- 255.0
Population outlook (McHenry County) Hauer SSP2
- Today (2025)
- 305,342 people
- By 2030
- 301,491 · -1.3%
- By 2040
- 288,211 · -5.6%
- By 2050
- 268,430 · -12.1%
- By 2075
- 226,209 · -25.9%
- By 2100
- 181,247 · -40.6%
Race, ethnicity, and origin ACS 2023
- Neighborhood character
- Predominantly White (74%)
- Race & ethnicity
- White 74% Hispanic / Latino 14% Two or more races 8% Asian 5% Black 2%
- Hispanic origin (detail)
- Mexican 10% Puerto Rican 2%
- Common ancestry
- Romanian 14% Iranian 2% Slovak 2%
- Foreign-born
- 12% · Canada, South Korea
- Languages at home
- 80% English-only · Spanish 9% Russian/Polish/Slavic 3% Other Indo-European 3%
Political lean MEDSL · McHenry
- 2024 margin
- Lean R (+5.3) · D 46.6% · R 51.9% · Other 1.5%
- 2008→2024 swing
- -10.6pp toward R · 2008: 5.3pp · 2024: -5.3pp
- All cycles
- 2024: R+5.3 2020: R+2.5 2016: R+8.1 2012: R+8.8 2008: D+5.3
Not yet ingested
- Civics
- —
Market trends
- HPI YoY
- ▼ -124.68%
- Current HPI
- 203.4513
- Rent YoY
- —
- Metro
- Chicago-Naperville-Elgin, IL-IN-WI
- State GDP YoY
- ▲ 1.59%
- F500 in state
- 60
Industry mix (Fortune 500 HQ in IL)
| Industry | F500 HQs | Revenue |
|---|---|---|
| Insurance | 4 | $201B |
|
||
| Consumer Goods | 4 | $87B |
|
||
| Industrial Machinery | 3 | $64B |
|
||
| Healthcare | 2 | $55B |
|
||
| Retail / Pharmacy | 1 | $148B |
|
||
| Agriculture / Food | 1 | $86B |
|
||
Price history
+244.0% since first listed12 events — show timeline
- 2026-06-15 Listed $319,900 MRED as Distributed by MLS Grid
- 2018-10-17 Sold (Public Records) $197,000 Public Records
- 2018-10-11 Sold (MLS) $197,000 MRED as Distributed by MLS Grid
- 2018-09-18 Contingent — MRED as Distributed by MLS Grid
- 2018-09-14 Price Changed $199,000 MRED as Distributed by MLS Grid
- 2018-09-08 Relisted — MRED as Distributed by MLS Grid
- 2018-09-01 Contingent — MRED as Distributed by MLS Grid
- 2018-08-31 Price Changed $219,000 MRED as Distributed by MLS Grid
- 2018-08-17 Price Changed $232,000 MRED as Distributed by MLS Grid
- 2018-07-06 Price Changed $242,900 MRED as Distributed by MLS Grid
- 2018-06-01 Listed $249,900 MRED as Distributed by MLS Grid
- 1986-02-01 Sold (Public Records) $93,000 Public Records
Property tax history
+2.5%/yrLatest (2025): $8,214 · +6.4% YoY. Source: county tax records.
Cash-flow waterfall
monthlySold comps — $/sqft
last 12 mo · ≤1 miLoading sold comps…