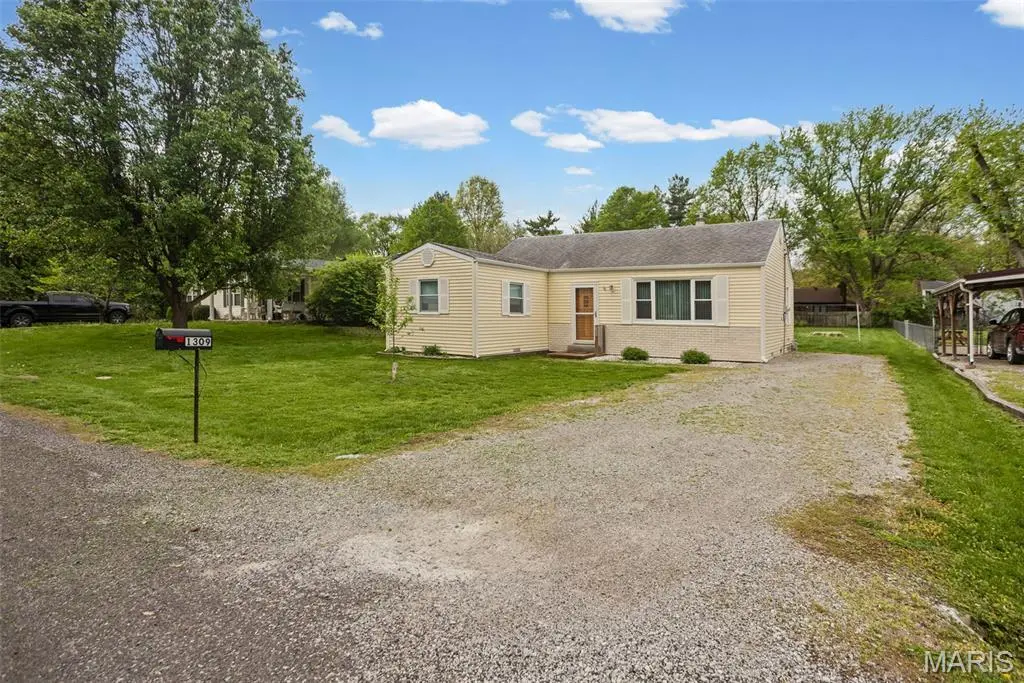
1309 Schilling Ave · Belleville, IL
Flood risk 1/10 · Minimal
- FEMA flood zone
- —
- Chance of flooding over 30 yrs
- 0.0%
- Est. flood insurance / yr
- —
Fire risk 1/10 · Minimal
- Est. fire insurance / yr
- $804 – $1,492
Heat risk 5/10 · Moderate
- Hot days now (above 107°F)
- 7 days/yr
- Hot days in 30 yrs
- 21 days/yr
Wind risk 2/10 · Minimal
- Chance of severe wind over 30 yrs
- 1.0%
Air-quality risk 4/10 · Minor
- Unhealthy air days now
- 3 days/yr
- Unhealthy air days in 30 yrs
- 6 days/yr
Risk factors via First Street. Map © Google.
Why this score? — see what drove the B grade
The composite is a weighted blend of 9 inputs, each scored 0–100. Each bar is that input's sub-score; the figure is the points it added to the 100-point composite (weight × sub-score).
- Cash flow +29.5/30.0
- ARV discount +14.5/15.0
- DSCR +10.0/10.0
- 1% rule +7.1/10.0
- Rent growth +4.3/5.0
- Livability +3.9/5.0
- Condition / age +2.5/5.0
- Schools +2.2/10.0
- Appreciation +0.0/10.0
$109,900
🖨 Deal sheet 📄 Offer letter ✓ Due diligence
Listing remarks
Welcome to this charming starter ranch-style home—ideal for folks looking for a cozy and practical living space. This welcoming spot features three bedrooms, with one having a walk-through setup to get to another. You’ll find a comfy living room, an efficient kitchen/dining area perfect for family meals, and a full bathroom with a stand-up shower. There’s also a handy utility room and two storage sheds, offering plenty of space to keep things organized. The property wraps up with a generously sized backyard, great for hanging out or relaxing. Come check out the potential of this lovely home that blends comfort and functionality in a nice setting. Situated near Scott AFB, d
Key facts
- 9,583 sq ft lot
- Built 1949
- Listed 9 days
Neighborhood map
What this means for you Summary
Snapshot
- This is a 3-bed/2.0-bath single-family listed at $110k.
Deal economics
- At list price, monthly cash flow is $392 ($5k/yr) — positive.
- The deal already cash-flows at list — no discount required.
- Meets the 1% rule at list price ($1k rent vs $110k).
- Cap rate 10.6% vs local median 5.6% in Belleville — top-decile yield for the area; either an underpriced asset or a hidden risk that comps aren't pricing in. Stress-test before assuming the spread holds.
Location & tenants
- Location reads 78/100 on livability (#142 in IL, #2,604 nationally) — a middle-class / working-renter tenant base. Strengths: commute A+, cost of living A+, housing A+; Watch: crime F, amenities D-.
- Belleville Twp Hsd 201 (suburban): math 21% / reading 28% proficiency, ranked #308 of 620 in IL (top 50%) — low school quality limits family demand, transient renter base, plan for 1-2y turnover.
- Zoned schools: Belleville High School-East (math 23% / reading 30%, grade F, #241 of 693 statewide, top 35%, 2,568 students, 0% FRL).
- Market conditions: Rents rising fast (+7.0%/yr); 157 active listings in the ZIP; 14 comparable units currently listed for rent nearby; rentals at typical pace (median 15d on market — plan ~3-4 weeks tenant-placement turnaround); solid renter incomes; 783 units permitted in St. Clair County in 2024 (378 in 5+ unit buildings).
Forward outlook
- Local home prices are declining (-3.0%/yr); year-one equity from $760 of loan paydown is wiped out by about $3k of value loss. Plan a longer hold.
- St. Clair County population projected at -23% by 2050 — secular population decline; favor cash flow + early exit over multi-decade hold.
- At projected returns (-3.0% appreciation + 7.0% rent growth), your $31k cash investment doubles in ~7 years — after that, you're playing with house money.
Negotiation context
- Only 9 days on market — expect competitive offers; lowballing is unlikely to land.
Risks & watch-outs
- Watch-outs: built in 1949 — expect roof / HVAC / electrical / plumbing capex.
- Climate carrying-cost: extreme-heat days projected 7→21/yr by 2055 (HVAC capex compounding) — expect insurance premiums to compound above CPI over the hold.
Questions for the listing agent
- Built in 1949 — when were the roof, HVAC, electrical panel, plumbing, and water heater last replaced?
- Is there a deadline driving the sale (1031 exchange, divorce, estate, relocation)? That informs how much negotiation room exists.
- Crime grade is F in this area — have there been break-ins, vandalism, or insurance claims at this property in the last 3 years? What carrier currently insures it and at what premium?
- What's the average days-on-market for RENTAL listings here right now (not sales)? A rising rental-DOM trend means longer vacancies and softer asking-rent achievability than the comps imply.
- What's the recent tenant-quality profile in this submarket — average credit score on applications, eviction rate, late-payment / NSF rate, and stable-employment percentage? A property-management company in the area should have these aggregated.
- How much new for-sale + rental construction is in the pipeline within 1–3 miles? Heavy new supply typically softens prices + rents 12–24 months out; constrained supply supports both.
Investment metrics
- 1% rule
- 1.21% ✓
- Cap rate
- 10.57%
- Cash-on-cash
- 15.29%
- DSCR
- 1.68
- GRM
- 6.9
CMA / ARV
- ARV (on-the-fly)
- $130,032
- Comps found
- 12
Show comp detail 12 sales within ~0.75 mi
| Address | Dist | Beds/Ba | Sqft | Sold | Price | $/sf | Match |
|---|---|---|---|---|---|---|---|
| 1309 Schilling Ave | 0.00mi | 3/1.0 | 1,032 (0%) | 1mo | $109,900 | $106 | 95 |
| 1419 Lebanon Ave | 0.43mi | 3/2.0 | 1,053 (+2%) | 6mo | $55,000 | $52 | 71 |
| 1813 Page Ave | 0.43mi | 3/1.0 | 1,021 (-1%) | 5mo | $119,900 | $117 | 70 |
| 1918 E C St | 0.29mi | 3/1.0 | 1,120 (+8%) | 3mo | $155,000 | $138 | 66 |
| 4 Eastland Dr | 0.42mi | 2/1.0 (-1) | 1,080 (+5%) | 1mo | $149,900 | $139 | 62 |
| 1636 N Charles St | 0.45mi | 2/1.0 (-1) | 1,056 (+2%) | 6mo | $100,000 | $95 | 61 |
| 139 Kansas Ave | 0.62mi | 2/1.5 (-1) | 1,028 (-0%) | 3mo | $135,000 | $131 | 61 |
| 2125 E B St | 0.19mi | 3/1.0 | 884 (-14%) | 2mo | $115,000 | $130 | 61 |
| 1621 La Salle St | 0.47mi | 2/1.0 (-1) | 1,080 (+5%) | 3mo | $58,000 | $54 | 59 |
| 1649 N Church St | 0.49mi | 2/1.0 (-1) | 1,100 (+7%) | 6mo | $39,900 | $36 | 53 |
| 1804 Muren Blvd | 0.43mi | 2/2.0 (-1) | 1,186 (+15%) | 2mo | $149,900 | $126 | 48 |
| 1114 La Salle St | 0.70mi | 3/2.0 | 1,181 (+14%) | 4mo | $159,900 | $135 | 40 |
Match score weights: distance 35% · size 25% · config 20% · recency 20%. Top-matched comps best support the ARV.
Projected returns pro-forma
-3.0% appreciation · 7.04% rent growth · sell at horizon
- IRR
- 10.1%
- Equity multiple
- 1.41×
- Total profit
- $12,734
- Equity at exit
- $16,386
- IRR
- 22.0%
- Equity multiple
- 3.21×
- Total profit
- $68,098
- Equity at exit
- $9,502
Cash invested: $30,772 (down + closing). Projections, not guarantees.
Landlord ↔ Tenant lean methodology
- Overall (STATE)
- 43 Moderately Tenant-Leaning
- State Illinois
- 43 Moderately Tenant-Leaning · D+7
- County
- — inherits STATE
- City
- — inherits STATE
ZIP-level market 62221
- Home prices YoY
- -24.2%
- Rents YoY
- 7.0%
- Active inventory
- 157
- Price-to-rent
- 6.9×
Monthly cashflow live
- Estimated rent
- $1,326 high interval (Pro) →
- Mortgage (P&I)
- −$576
- Tax from tax record
- −$34 /mo · $404/yr
- Insurance
- −$46
- HOA
- −$0
- Vacancy / Maint / Mgmt
- −$279
- Net cashflow
- $392
Break-even live
UW: 25.0% down · 7.5% · 30yr · 1.5% tax · 5.0% vac · 8.0% maint · 8.0% mgmt
Financing live
Cash to close
- Down payment
- $27,475
- Closing costs
- $3,297
- Reserves months
- —
- Total cash needed
- —
Loan-product check · same deal, 3 products live
Conventional
25% down · 7.5% · 30yr
- Down + closing
- —
- Monthly P&I
- —
- Monthly cashflow
- —
- DSCR
- —
- Eligible?
- —
Personal DTI + credit; lowest rate.
DSCR
20% down · 8.5% · 30yr
- Down + closing
- —
- Monthly P&I
- —
- Monthly cashflow
- —
- DSCR
- —
- Eligible?
- —
No personal income docs; deal must DSCR.
Hard money
10% down · 12.0% · 12mo
- Down + closing
- —
- Monthly P&I
- —
- Monthly cashflow
- —
- DSCR
- —
- Eligible?
- —
Short-term bridge; refi at stabilization.
Rent comps 14 comps
| Address | Beds | Baths | Sqft | Rent | $/sqft | DOM | Units | Dist |
|---|---|---|---|---|---|---|---|---|
| 25 Glencoe Dr Belleville, IL | 3.0 | 1.0 | 1200 | $1,275 | $1.06 | 23d | 1 | 0.08mi |
| 1717 La Salle St Belleville, IL | 3.0 | 1.0 | 1104 | $1,350 | $1.22 | 23d | 1 | 0.33mi |
| 1528 Lebanon Ave Belleville, IL | 2.0 | 1.0 | 900 | $1,095 | $1.22 | 12d | 1 | 0.38mi |
| 308 Bobbie Dr Swansea, IL | 2.0 | 2.0 | 1130 | $1,500 | $1.33 | 23d | 1 | 0.83mi |
| 1671 Shadow Ridge Ct Belleville, IL | 1.0–2.0 | 1.0 | 815 | $1,325 | $1.62 | 1d | 12 | 0.85mi |
| 223 Anderson Ln Belleville, IL | 2.0 | 1.0 | 1000 | $1,190 | $1.19 | 23d | 1 | 1.04mi |
| 1107 Bristow St Belleville, IL | 3.0 | 1.0 | 1238 | $1,500 | $1.21 | 12d | 1 | 1.06mi |
| 535 Williamsburg Dr Belleville, IL | 1.0–2.0 | 1.0 | 700 | $1,866 | $2.67 | 1d | 6 | 1.10mi |
| 537 Vicksburg Dr Unit h Belleville, IL | 2.0 | 1.0 | 950 | $1,190 | $1.25 | 16d | 1 | 1.13mi |
| 2917 West Blvd Belleville, IL | 2.0 | 2.0 | 1000 | $1,025 | $1.02 | 14d | 1 | 1.14mi |
| 1320 Sangamon Dr Belleville, IL | 2.0 | 2.0 | 950 | $1,145 | $1.21 | 1d | 1 | 1.27mi |
| 1400 Sangamon Dr Belleville, IL | 2.0 | 2.0 | 950 | $1,120 | $1.18 | 1d | 1 | 1.30mi |
| 2416 Patrick Dr Belleville, IL | 3.0 | 1.5 | 1218 | $1,350 | $1.11 | 17d | 1 | 1.32mi |
| 409 Carlyle E Belleville, IL | 3.0 | 1.5 | 1280 | $1,458 | $1.14 | 1d | 1 | 1.37mi |
Listing history 2 events
-
2026-04-24status Pending
-
2026-04-14$109,900 Active
ⓘ Source: listings_history table (triggers on properties + properties_extension) + one-shot
backfill from property_details.listing_events for pre-trigger history.
Tax reassessment forecast IL · Partial reset (capped growth)
- Current annual tax
- $404 · $34/mo
- Projected year-2 tax
- $1,449 · $121/mo
- Expected delta
- +$1,045/yr (+$87/mo · 258.6%)
ⓘ Screening estimate from a state-policy table — verify with the county assessor before closing.
Climate risk First Street
- Flood 1/10 Low 0% chance over 30 yrs
- Wildfire 1/10 Low
- Heat 5/10 Major 7 d/yr ≥107°F today · 21 d/yr by 30 yrs out
- Wind 2/10 Low 100% chance of damaging wind over 30 yrs
- Air quality 4/10 Moderate 3 unhealthy d/yr today · 6 by 30 yrs out
Nearby sold comps map
Loading sold comps map…
Walkable amenities ~0.75 mi
Loading nearby amenities…
Taxation est. · year 1
- Rental income
- $15,918
- − Mortgage interest
- −$6,156
- − Property taxes
- −$404
- − Insurance
- −$550
- − Repairs & maintenance
- −$1,273
- − Management
- −$1,273
- − Depreciation
- −$3,197
- Taxable income
- $3,064
- Est. tax owed @ 24.0%
- −$735
- After-tax cash flow
- $3,970/yr
For passive investors: Depreciation is non-cash, so a rental often shows a tax loss while cash-flowing — sheltering income. Rental losses are passive: they offset passive income freely, and up to $25,000/yr can offset ordinary (W-2) income if you actively participate and your MAGI is under $100k (phasing out to $0 by $150k); unused losses carry forward. On sale, claimed depreciation is recaptured at up to 25%, and gains may owe capital-gains tax (a 1031 exchange can defer both). Figures are a year-1 estimate at your 24.0% rate — not tax advice; consult a CPA.
Schools (NCES district)
- District
- Belleville Twp Hsd 201
- NCES district ID
- 1705640
- Math proficiency
- 21% ▼ -8.00%
- Reading proficiency
- 28% ▼ -3.00%
- Median HH income
- $58,064
- Composite
- 22.39/100
- National rank
- #8115
- State rank
- #308 of 620 in IL
Livability — Belleville
- Score
- 78/100
- State rank
- #142
- US rank
- #2604
Category grades
Schools grade is shown separately in the Schools card above.
Census & demographics
- Census place
- Belleville, IL
- County
- Saint Clair County · 169,691 people
- City population
- 47,407
- Metro
- St. Louis, MO-IL
- Population (ZIP)
- 29,875
- Household income
- $82,271
- Rent vs Own
- Severe rent burden
- 658.0
Population outlook (St. Clair County) Hauer SSP2
- Today (2025)
- 250,366 people
- By 2030
- 240,511 · -3.9%
- By 2040
- 217,391 · -13.2%
- By 2050
- 192,699 · -23.0%
- By 2075
- 140,637 · -43.8%
- By 2100
- 100,499 · -59.9%
Race, ethnicity, and origin ACS 2023
- Neighborhood character
- Diverse neighborhood (Simpson 0.58)
- Race & ethnicity
- White 56% Black 31% Two or more races 6% Hispanic / Latino 3% Asian 2%
- Common ancestry
- Lithuanian 4% Romanian 2% Slovak 2%
- Foreign-born
- 3% · Canada, South Korea
- Languages at home
- 94% English-only · Spanish 2% German/W. Germanic 1% French/Haitian/Cajun 1%
Political lean MEDSL · St. Clair
- 2024 margin
- Lean D (+7.9) · D 53.0% · R 45.1% · Other 1.8%
- 2008→2024 swing
- -14.6pp toward R · 2008: 22.4pp · 2024: 7.9pp
- All cycles
- 2024: D+7.9 2020: D+8.7 2016: D+5.6 2012: D+14.5 2008: D+22.4
Not yet ingested
- Civics
- —
Market trends
- HPI YoY
- ▼ -53.50%
- Current HPI
- 167.8124
- Rent YoY
- ▲ 7.04%
- Metro
- St. Louis, MO-IL
- State GDP YoY
- ▲ 1.59%
- F500 in state
- 60
Industry mix (Fortune 500 HQ in IL)
| Industry | F500 HQs | Revenue |
|---|---|---|
| Insurance | 4 | $201B |
|
||
| Consumer Goods | 4 | $87B |
|
||
| Industrial Machinery | 3 | $64B |
|
||
| Healthcare | 2 | $55B |
|
||
| Retail / Pharmacy | 1 | $148B |
|
||
| Agriculture / Food | 1 | $86B |
|
||
Price history
2 events — show timeline
- 2026-04-24 Pending — MARIS as Distributed by MLS Grid
- 2026-04-14 Listed $109,900 MARIS as Distributed by MLS Grid
Property tax history
-5.5%/yrLatest (2024): $404 · -6.3% YoY. Source: county tax records.
Cash-flow waterfall
monthlySold comps — $/sqft
last 12 mo · ≤1 miLoading sold comps…