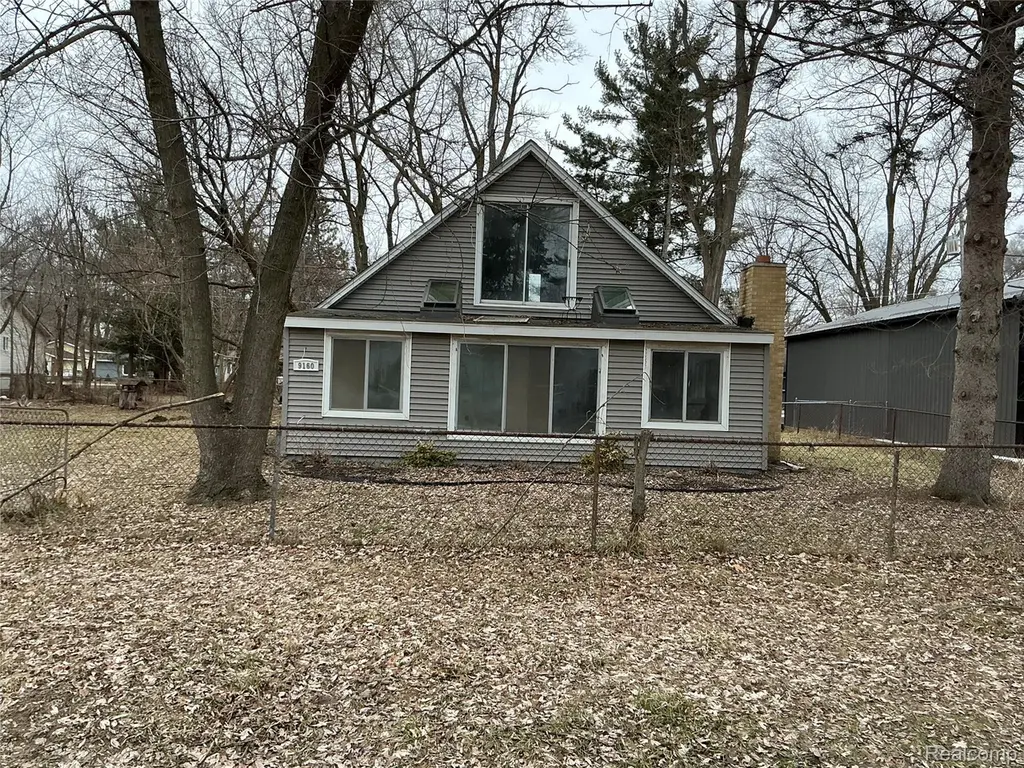
9160 Blondell Ave. Blondell Ave W · White Lake, MI
Flood risk 1/10 · Minimal
- FEMA flood zone
- X (unshaded)
- Chance of flooding over 30 yrs
- 0.0%
- Est. flood insurance / yr
- $473 – $860
Fire risk 1/10 · Minimal
- Est. fire insurance / yr
- $784 – $1,456
Heat risk 2/10 · Minimal
- Hot days now (above 95°F)
- 7 days/yr
- Hot days in 30 yrs
- 15 days/yr
Wind risk 2/10 · Minimal
- Chance of severe wind over 30 yrs
- —
Air-quality risk 3/10 · Minor
- Unhealthy air days now
- 2 days/yr
- Unhealthy air days in 30 yrs
- 4 days/yr
Risk factors via First Street. Map © Google.
Why this score? — see what drove the B grade
The composite is a weighted blend of 9 inputs, each scored 0–100. Each bar is that input's sub-score; the figure is the points it added to the 100-point composite (weight × sub-score).
- Cash flow +27.2/30.0
- ARV discount +15.0/15.0
- DSCR +9.4/10.0
- 1% rule +7.6/10.0
- Schools +5.0/10.0
- Rent growth +2.5/5.0
- Livability +2.5/5.0
- Condition / age +2.5/5.0
- Appreciation +0.0/10.0
$159,000
🖨 Deal sheet 📄 Offer letter ✓ Due diligence
Listing remarks MLS
Charming 3bedroom 1 bathroom Cape Cod great for an investor or a homeowner, in need of rehab the home has a new furnace, rough plumbing, and electrical has been done and has pass inspection with the building department, this property is being sold As-Is. A licensed agent is part of the selling entity. A licensed agent must be present at all showings.
Key facts
- New furnace
- Pass inspection
- Rough plumbing
Tags
Neighborhood map
What this means for you Summary
Snapshot
- This is a 2-bed/1.0-bath single-family listed at $159k.
Deal economics
- At list price, monthly cash flow is $453 ($5k/yr) — positive.
- The deal already cash-flows at list — no discount required.
- Meets the 1% rule at list price ($2k rent vs $159k).
- Recommended offer: $145k (9.0% below list) — sets the bar for market timing.
Location & tenants
- Location reads: area grade B — affects rentability + tenant quality, not the cash-flow math above.
- Walled Lake Consolidated Schools (suburban): math 52% / reading 60% proficiency, ranked #58 of 540 in MI (top 11%) — acceptable for families but not a draw, mixed tenant base, ~2y average lease; only 20% free/reduced lunch — higher-income household profile.
- Market conditions: 145 active listings in the ZIP; 8 comparable units currently listed for rent nearby; rentals leasing fast (median 5d on market — plan ~1-2 weeks tenant-placement turnaround); solid renter incomes; 2,614 units permitted in Oakland County in 2024 (721 in 5+ unit buildings).
Forward outlook
- Local home prices are declining (-3.0%/yr); year-one equity from $1k of loan paydown is wiped out by about $5k of value loss. Plan a longer hold.
- Oakland County population projected at +10% by 2050 — modest demand growth; plan on rents tracking national, not racing it.
- At projected returns (-3.0% appreciation + 3.0% rent growth), your $45k cash investment doubles in ~10 years — after that, you're playing with house money.
Negotiation context
- It's been on market 114 days — a 9% lower offer ($145k) is reasonable based on typical stale-listing flexibility.
- 4 sale attempts since 4y ago; this cycle's ask has dropped $10k (6%) from the opening price — seller is motivated, your offer sets the floor, not the list.
- Current owner paid $68k; list at $159k implies a 135% gain — meaningful room to come down on a strong offer.
Questions for the listing agent
- It's been on market 114 days. Have you received any prior offers? Is the seller open to a 9% concession, seller financing, or rate buy-down credit?
- Built in 1969 — when were the roof, HVAC, electrical panel, plumbing, and water heater last replaced?
- Why hasn't it sold? Are there any deal-killer items the seller is aware of (foundation, flood, title, zoning, code violations)?
- Is there a deadline driving the sale (1031 exchange, divorce, estate, relocation)? That informs how much negotiation room exists.
- What's the average days-on-market for RENTAL listings here right now (not sales)? A rising rental-DOM trend means longer vacancies and softer asking-rent achievability than the comps imply.
- What's the recent tenant-quality profile in this submarket — average credit score on applications, eviction rate, late-payment / NSF rate, and stable-employment percentage? A property-management company in the area should have these aggregated.
- How much new for-sale + rental construction is in the pipeline within 1–3 miles? Heavy new supply typically softens prices + rents 12–24 months out; constrained supply supports both.
Investment metrics
- 1% rule
- 1.26% ✓
- Cap rate
- 9.71%
- Cash-on-cash
- 12.20%
- DSCR
- 1.54
- GRM
- 6.6
CMA / ARV
- ARV (median comp)
- $259,019
- List price
- $159,000
- Delta
- -38.61%
- Verdict
- UNDERPRICED
- Comps
- 20 within 1.0 mi
Show comp detail 12 sales within ~0.75 mi
| Address | Dist | Beds/Ba | Sqft | Sold | Price | $/sf | Match |
|---|---|---|---|---|---|---|---|
| 1065 Round Lake Rd | 0.41mi | 3/1.5 (+1) | 1,472 (-2%) | 2mo | $342,000 | $232 | 70 |
| 9081 Julia Ave | 0.10mi | 3/1.0 (+1) | 1,626 (+9%) | 11mo | $253,000 | $156 | 67 |
| 1243 Clearwater Blvd | 0.64mi | 3/1.0 (+1) | 1,480 (-1%) | 10mo | $219,000 | $148 | 55 |
| 636 Lakeview Dr | 0.29mi | 3/1.0 (+1) | 1,710 (+14%) | 4mo | $332,000 | $194 | 54 |
| 9121 Sandyside Rd | 0.44mi | 3/1.5 (+1) | 1,412 (-6%) | 13mo | $295,000 | $209 | 52 |
| 9150 Pennfield Ave | 0.41mi | 3/1.5 (+1) | 1,339 (-11%) | 6mo | $270,000 | $202 | 51 |
| 365 Glasgow Dr | 0.61mi | 3/2.0 (+1) | 1,566 (+5%) | 12mo | $258,000 | $165 | 45 |
| 9175 Maplewood Dr | 0.57mi | 3/1.5 (+1) | 1,392 (-7%) | 12mo | $277,500 | $199 | 45 |
| 325/VL Tower Rd | 0.58mi | 2/2.0 | 1,683 (+12%) | 6mo | $292,500 | $174 | 44 |
| 9801 Coledale Ct | 0.68mi | 2/1.5 | 1,274 (-15%) | 0mo | $540,000 | $424 | 41 |
| 1116 Fairview St | 0.54mi | 3/1.5 (+1) | 1,332 (-11%) | 12mo | $319,000 | $239 | 39 |
| 9884 Cedar Island Rd | 0.71mi | 3/1.0 (+1) | 1,380 (-8%) | 13mo | $285,000 | $207 | 38 |
Match score weights: distance 35% · size 25% · config 20% · recency 20%. Top-matched comps best support the ARV.
Projected returns pro-forma
-3.0% appreciation · 3.0% rent growth · sell at horizon
- IRR
- 1.8%
- Equity multiple
- 1.07×
- Total profit
- $3,121
- Equity at exit
- $23,707
- IRR
- 11.5%
- Equity multiple
- 1.90×
- Total profit
- $40,054
- Equity at exit
- $13,747
Cash invested: $44,520 (down + closing). Projections, not guarantees.
Landlord ↔ Tenant lean methodology
- Overall (STATE)
- 62 Landlord-Friendly
- State Michigan
- 62 Landlord-Friendly · EVEN
- County
- — inherits STATE
- City
- — inherits STATE
ZIP-level market 48386
- Active inventory
- 145
- Price-to-rent
- 6.6×
Monthly cashflow live
- Estimated rent
- $2,007 high interval (Pro) →
- Mortgage (P&I)
- −$834
- Tax from tax record
- −$233 /mo · $2,790/yr
- Insurance
- −$66
- HOA
- −$0
- Vacancy / Maint / Mgmt
- −$421
- Net cashflow
- $453
Break-even live
UW: 25.0% down · 7.5% · 30yr · 1.5% tax · 5.0% vac · 8.0% maint · 8.0% mgmt
Financing live
Cash to close
- Down payment
- $39,750
- Closing costs
- $4,770
- Reserves months
- —
- Total cash needed
- —
Loan-product check · same deal, 3 products live
Conventional
25% down · 7.5% · 30yr
- Down + closing
- —
- Monthly P&I
- —
- Monthly cashflow
- —
- DSCR
- —
- Eligible?
- —
Personal DTI + credit; lowest rate.
DSCR
20% down · 8.5% · 30yr
- Down + closing
- —
- Monthly P&I
- —
- Monthly cashflow
- —
- DSCR
- —
- Eligible?
- —
No personal income docs; deal must DSCR.
Hard money
10% down · 12.0% · 12mo
- Down + closing
- —
- Monthly P&I
- —
- Monthly cashflow
- —
- DSCR
- —
- Eligible?
- —
Short-term bridge; refi at stabilization.
Rent comps 8 comps
| Address | Beds | Baths | Sqft | Rent | $/sqft | DOM | Units | Dist |
|---|---|---|---|---|---|---|---|---|
| 336 Rustic Cir White Lake, MI | 3.0 | 1.0 | 1562 | $2,450 | $1.57 | 2d | 1 | 0.60mi |
| 10094 Elizabeth Lake Rd White Lake, MI | 3.0 | 2.0 | 1872 | $3,000 | $1.60 | 24d | 1 | 1.28mi |
| 211 Summit Ridge Dr Unit D White Lake Charter Township, MI | 2.0 | 1.0 | 912 | $1,200 | $1.32 | 3d | 1 | 1.31mi |
| 211 Summit Ridge Dr Unit D White Lake Charter Township, MI | 2.0 | 1.0 | 875 | $1,200 | $1.37 | 5d | 1 | 1.31mi |
| 8020 Wadi White Lake, MI | 2.0 | 2.0 | 1352 | $2,512 | $1.86 | 1d | 16 | 1.34mi |
| 153 Huronview Ct White Lake, MI | 1.0 | 1.5 | 950 | $1,200 | $1.26 | 10d | 1 | 1.38mi |
| 149 Huronview Ct White Lake, MI | 1.0 | 1.5 | 1000 | $1,200 | $1.20 | 43d | 1 | 1.39mi |
| 132 Huronview Ct White Lake Charter Township, MI | 2.0 | 1.5 | 920 | $1,425 | $1.55 | 1d | 1 | 1.39mi |
Listing history 22 events
-
2026-06-17status $159,000 Pending 114 DOM
-
2026-06-16days on market $159,000 Active Under Contract 114 DOM
-
2026-06-15days on market $159,000 Active Under Contract 113 DOM
-
2026-06-13days on market $159,000 Active Under Contract 111 DOM
-
2026-06-13days on market $159,000 Active Under Contract 110 DOM
-
2026-06-09days on market $159,000 Active Under Contract 107 DOM
-
2026-06-08days on market $159,000 Active Under Contract 106 DOM
-
2026-06-07days on market $159,000 Active Under Contract 105 DOM
-
2026-06-04days on market $159,000 Active Under Contract 102 DOM
-
2026-06-03days on market $159,000 Active Under Contract 101 DOM
-
2026-06-02statusdays on market $159,000 Active Under Contract 100 DOM
-
2026-06-01days on market $159,000 Active 99 DOM
-
2026-05-31days on market $159,000 Active 98 DOM
-
2026-04-10price $159,000 352-char remark
Show marketing remark (352 chars)
Charming 3bedroom 1 bathroom Cape Cod great for an investor or a homeowner, in need of rehab the home has a new furnace, rough plumbing, and electrical has been done and has pass inspection with the building department, this property is being sold As-Is. A licensed agent is part of the selling entity. A licensed agent must be present at all showings.
-
2026-04-09price $159,000 352-char remark
Show marketing remark (352 chars)
Charming 3bedroom 1 bathroom Cape Cod great for an investor or a homeowner, in need of rehab the home has a new furnace, rough plumbing, and electrical has been done and has pass inspection with the building department, this property is being sold As-Is. A licensed agent is part of the selling entity. A licensed agent must be present at all showings.
-
2026-02-17$169,000 Active 352-char remark
Show marketing remark (352 chars)
Charming 3bedroom 1 bathroom Cape Cod great for an investor or a homeowner, in need of rehab the home has a new furnace, rough plumbing, and electrical has been done and has pass inspection with the building department, this property is being sold As-Is. A licensed agent is part of the selling entity. A licensed agent must be present at all showings.
-
2023-02-06historical
-
2023-02-06historical
-
2022-09-28$149,000 Active
-
2022-09-28$149,000 Active
-
1994-04-18soldstatus $67,750
ⓘ Source: listings_history table (triggers on properties + properties_extension) + one-shot
backfill from property_details.listing_events for pre-trigger history.
Tax reassessment forecast MI · Partial reset (capped growth)
- Current annual tax
- $2,790 · $233/mo
- Projected year-2 tax
- $2,790 · $233/mo
- Expected delta
- $0/yr ($0/mo · 0.0%)
ⓘ Screening estimate from a state-policy table — verify with the county assessor before closing.
Climate risk First Street
- Flood 1/10 Low FEMA zone X (unshaded) · 0% chance over 30 yrs
- Wildfire 1/10 Low
- Heat 2/10 Low 7 d/yr ≥95°F today · 15 d/yr by 30 yrs out
- Wind 2/10 Low
- Air quality 3/10 Moderate 2 unhealthy d/yr today · 4 by 30 yrs out
Nearby sold comps map
Loading sold comps map…
Walkable amenities ~0.75 mi
Loading nearby amenities…
Taxation est. · year 1
- Rental income
- $24,081
- − Mortgage interest
- −$8,906
- − Property taxes
- −$2,790
- − Insurance
- −$795
- − Repairs & maintenance
- −$1,926
- − Management
- −$1,926
- − Depreciation
- −$4,625
- Taxable income
- $3,111
- Est. tax owed @ 24.0%
- −$747
- After-tax cash flow
- $4,686/yr
For passive investors: Depreciation is non-cash, so a rental often shows a tax loss while cash-flowing — sheltering income. Rental losses are passive: they offset passive income freely, and up to $25,000/yr can offset ordinary (W-2) income if you actively participate and your MAGI is under $100k (phasing out to $0 by $150k); unused losses carry forward. On sale, claimed depreciation is recaptured at up to 25%, and gains may owe capital-gains tax (a 1031 exchange can defer both). Figures are a year-1 estimate at your 24.0% rate — not tax advice; consult a CPA.
Schools (NCES district)
- District
- Walled Lake Consolidated Schools
- NCES district ID
- 2635160
- Math proficiency
- 52% ▼ -4.00%
- Reading proficiency
- 60% ▼ -1.00%
- Median HH income
- $69,184
- Composite
- 49.57/100
- National rank
- #1987
- State rank
- #58 of 540 in MI
Livability — White Lake
No livability data for this city. (Only ~50 U.S. cities are tracked.)
Census & demographics
- County
- Oakland County · 1,009,092 people
- City population
- 17,856
- Metro
- Detroit-Warren-Dearborn, MI
- Population (ZIP)
- 17,856
- Household income
- $89,702
- Rent vs Own
- Severe rent burden
- 664.0
Population outlook (Oakland County) Hauer SSP2
- Today (2025)
- 1,335,747 people
- By 2030
- 1,375,100 · +2.9%
- By 2040
- 1,435,385 · +7.5%
- By 2050
- 1,469,250 · +10.0%
- By 2075
- 1,531,946 · +14.7%
- By 2100
- 1,450,485 · +8.6%
Race, ethnicity, and origin ACS 2023
- Neighborhood character
- Predominantly White (90%)
- Race & ethnicity
- White 90% Two or more races 6% Hispanic / Latino 4% Black 1%
- Common ancestry
- Romanian 12% Lithuanian 6% Slovak 4%
- Foreign-born
- 5% · Canada
- Languages at home
- 95% English-only · Russian/Polish/Slavic 2% Spanish 1% Arabic 1%
Political lean MEDSL · Oakland
- 2024 margin
- D (+10.6) · D 54.4% · R 43.8% · Other 1.9%
- 2008→2024 swing
- -3.9pp toward R · 2008: 14.5pp · 2024: 10.6pp
- All cycles
- 2024: D+10.6 2020: D+14.1 2016: D+8.1 2012: D+8.1 2008: D+14.5
Not yet ingested
- Civics
- —
Market trends
- HPI YoY
- ▼ -269.78%
- Current HPI
- 207.917
- Rent YoY
- —
- Metro
- Detroit-Warren-Dearborn, MI
- State GDP YoY
- ▲ 1.37%
- F500 in state
- 28
Industry mix (Fortune 500 HQ in MI)
| Industry | F500 HQs | Revenue |
|---|---|---|
| Automotive Parts | 3 | $48B |
|
||
| Automotive | 2 | $372B |
|
||
| Chemicals | 1 | $45B |
|
||
| Automotive Retail | 1 | $29B |
|
||
| Healthcare / Medical Devices | 1 | $23B |
|
||
| Automotive Technology | 1 | $20B |
|
||
Price history
+134.7% since first listed9 events — show timeline
- 2026-04-10 Price Changed $159,000 MiRealSource-MiMLS
- 2026-04-09 Price Changed $159,000 REALCOMP
- 2026-02-17 Listed $169,000 REALCOMP
- 2026-02-17 Listed $169,000 MiRealSource-MiMLS
- 2023-02-06 Listing Removed — MiRealSource-MiMLS
- 2023-02-06 Listing Removed — REALCOMP
- 2022-09-28 Listed $149,000 MiRealSource-MiMLS
- 2022-09-28 Listed $149,000 REALCOMP
- 1994-04-18 Sold (Public Records) $67,750 Public Records
Property tax history
+6.7%/yrLatest (2025): $2,790 · -26.3% YoY. Source: county tax records.
Cash-flow waterfall
monthlySold comps — $/sqft
last 12 mo · ≤1 miLoading sold comps…