 🌊 Lakefront
9902 S Thomas Dr #2029 · Panama City Beach, FL
Flood risk 7/10 · Major
- FEMA flood zone
- X (unshaded)
- Chance of flooding over 30 yrs
- 0.77%
- Est. flood insurance / yr
- $507 – $1,088
Fire risk 3/10 · Minor
- Est. fire insurance / yr
- $947 – $1,759
Heat risk 10/10 · Severe
- Hot days now (above 106°F)
- 7 days/yr
- Hot days in 30 yrs
- 21 days/yr
Wind risk 10/10 · Severe
- Chance of severe wind over 30 yrs
- 99.0%
Air-quality risk 1/10 · Minimal
- Unhealthy air days now
- 0 days/yr
- Unhealthy air days in 30 yrs
- 0 days/yr
Risk factors via First Street. Map © Google.
Why this score? — see what drove the D- grade
The composite is a weighted blend of 9 inputs, each scored 0–100. Each bar is that input's sub-score; the figure is the points it added to the 100-point composite (weight × sub-score).
- ARV discount +15.0/15.0
- Cash flow +5.8/30.0
- 1% rule +5.0/10.0
- Schools +4.3/10.0
- Livability +3.9/5.0
- Rent growth +3.1/5.0
- Condition / age +2.5/5.0
- DSCR +0.2/10.0
- Appreciation +0.0/10.0
$290,000
🖨 Deal sheet 📄 Offer letter ✓ Due diligence
Listing remarks MLS
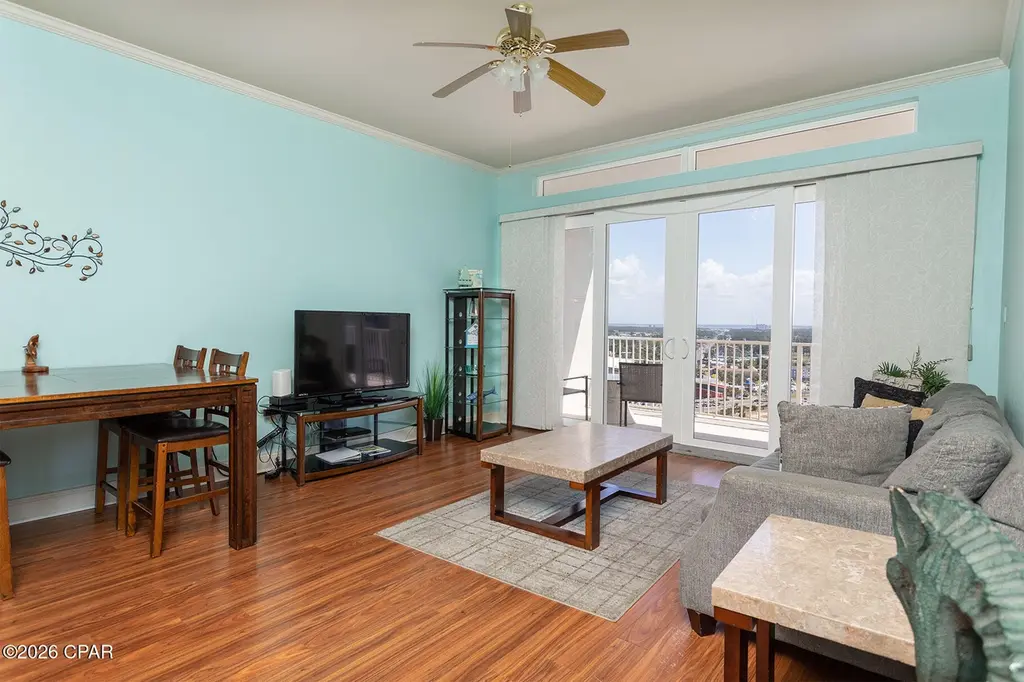
Welcome to Laketown Wharf - where location, lifestyle, and investment potential come together beautifully. This spacious 2BR, 2BA condo with a bunk room offers approximately 1,262 sqft of comfortable coastal living. Thoughtfully designed for both personal enjoyment and rental income, the unit features a stacked washer and dryer and a flexible layout that easily accommodates guests. Step out onto your private balcony and take in the direct waterfront views of the lake, creating a peaceful backdrop for your morning coffee or evening unwind. Perfectly positioned directly across the street from the Gulf, this condo includes dedicated deeded beach access with a private gate and boardwalk through Pineapple Willy's, making beach days effortless. You're also within walking distance to some of Panama City Beach's most popular attractions, including dining, shopping, and entertainment. Whether you're looking for a vacation getaway, income-producing property, or both, this condo offers a true one-stop destination in the heart of Panama City Beach.
Key facts
- Deeded beach access
- Private balcony
- Private gate
Tags
Neighborhood map
What this means for you Summary
Snapshot
- This is a 3-bed/2.0-bath condo listed at $290k.
Deal economics
- At list price, monthly cash flow is $-645 ($-8k/yr) — negative.
- The deal already cash-flows at list — no discount required.
- Meets the 1% rule at list price ($3k rent vs $290k).
- Recommended offer: $273k (6.0% below list) — sets the bar for market timing.
- Cap rate 3.9% vs local median 2.6% in Panama City Beach — top-decile yield for the area; either an underpriced asset or a hidden risk that comps aren't pricing in. Stress-test before assuming the spread holds.
Location & tenants
- Location reads 78/100 on livability (#172 in FL, #2,624 nationally) — a middle-class / working-renter tenant base. Strengths: crime A+, housing A+, health & safety A+; Watch: amenities D-, commute F.
- Bay (suburban): math 51% / reading 51% proficiency, ranked #29 of 73 in FL (top 40%) — acceptable for families but not a draw, mixed tenant base, ~2y average lease.
- Market conditions: Rents rising (+2.5%/yr); 1022 active listings in the ZIP; 27 comparable units currently listed for rent nearby; rentals leasing fast (median 14d on market — plan ~1-2 weeks tenant-placement turnaround); solid renter incomes; 2,473 units permitted in Bay County in 2024 (559 in 5+ unit buildings).
- This rent runs 43% of the median local income ($81k/yr) — at the standard rent-burdened threshold; future hikes will face affordability resistance.
Forward outlook
- Local home prices are declining (-3.0%/yr); year-one equity from $2k of loan paydown is wiped out by about $9k of value loss. Plan a longer hold.
- Bay County population projected at +24% by 2050 — long-run rental-demand tailwind backs the buy-and-hold thesis.
Negotiation context
- It's been on market 74 days — a 6% lower offer ($273k) is reasonable based on typical stale-listing flexibility.
- 4 sale attempts since 5y ago; this cycle's ask has dropped $22k (7%) from the opening price — seller is motivated, your offer sets the floor, not the list.
Risks & watch-outs
- Watch-outs: flood insurance adds $66/mo; HOA is 32% of rent.
- Climate carrying-cost: major flood risk; severe wind risk, 99% chance of damaging wind over 30y; extreme-heat days projected 7→21/yr by 2055 (HVAC capex compounding) — expect insurance premiums to compound above CPI over the hold.
Questions for the listing agent
- What do current leases actually rent for vs. the listed asking? Can we see a recent rent roll and the last 12 months of T-12 income?
- It's been on market 74 days. Have you received any prior offers? Is the seller open to a 6% concession, seller financing, or rate buy-down credit?
- What's the actual annual flood-insurance premium (NFIP or private), and is the property in a SFHA with mandatory coverage?
- What does the HOA fee cover, when was the last increase, and are there any pending special assessments or reserve-fund shortfalls?
- Any open or pending special assessments — roof, HVAC, plumbing, elevator, façade? What's the per-unit balance and payoff schedule, and is the seller paying it off at close or rolling it to the buyer?
- Why hasn't it sold? Are there any deal-killer items the seller is aware of (foundation, flood, title, zoning, code violations)?
- Is there a deadline driving the sale (1031 exchange, divorce, estate, relocation)? That informs how much negotiation room exists.
- Schools are B-rated — typically a magnet for longer-tenancy family renters. What's the average tenant stay here, and is there a school-zone premium baked into asking?
- The area grade is low — what's the realistic commute time and amenity access for the typical tenant pool here? Any planned neighborhood developments (good or bad) we should know about?
- This sits on a lake — are riparian / water-frontage rights deeded with the parcel? Any dock permits, shoreline easements, or HOA water-use restrictions?
- What's the documented flood / surge / shoreline-erosion history here (FEMA AND non-FEMA — e.g., storm surge, creek backup, septic-field saturation)?
- Any water-quality or seasonal algae-bloom issues that affect tenant satisfaction or short-term-rental demand?
- What's the average days-on-market for RENTAL listings here right now (not sales)? A rising rental-DOM trend means longer vacancies and softer asking-rent achievability than the comps imply.
- What's the recent tenant-quality profile in this submarket — average credit score on applications, eviction rate, late-payment / NSF rate, and stable-employment percentage? A property-management company in the area should have these aggregated.
- How much new apartment / multifamily construction is in the pipeline within 1–3 miles? Heavy new supply (>2% of stock underway) typically softens rents 12–24 months out; light construction supports rent growth.
Investment metrics
- 1% rule
- 1.00% ✓
- Cap rate
- 3.90%
- Cash-on-cash
- -8.55%
- DSCR
- 0.62
- GRM
- 8.3
CMA / ARV
- ARV (median comp)
- $370,140
- List price
- $290,000
- Delta
- -21.65%
- Verdict
- UNDERPRICED
- Comps
- 20 within 1.0 mi
Projected returns pro-forma
-3.0% appreciation · 2.55% rent growth · sell at horizon
- IRR
- -33.8%
- Equity multiple
- -0.09×
- Total profit
- $-88,777
- Equity at exit
- $43,240
- IRR
- -44.6%
- Equity multiple
- -0.64×
- Total profit
- $-133,031
- Equity at exit
- $25,074
Cash invested: $81,200 (down + closing). Projections, not guarantees.
Landlord ↔ Tenant lean methodology
- Overall (STATE)
- 87 Strongly Landlord-Friendly
- State Florida
- 87 Strongly Landlord-Friendly · R+3
- County
- — inherits STATE
- City
- — inherits STATE
ZIP-level market 32408
- Rents YoY
- 2.5%
- Active inventory
- 1022
- Price-to-rent
- 8.3×
Monthly cashflow live
- Estimated rent
- $2,904 high interval (Pro) →
- Mortgage (P&I)
- −$1,521
- Tax from tax record
- −$303 /mo · $3,636/yr
- Insurance
- −$121
- Flood insurance flood zone
- −$66 /mo · $798/yr
- HOA est. from 3 same-building comps
- −$928
- Vacancy / Maint / Mgmt
- −$610
- Net cashflow
- $-645
Break-even live
UW: 25.0% down · 7.5% · 30yr · 1.5% tax · 5.0% vac · 8.0% maint · 8.0% mgmt
Financing live
Cash to close
- Down payment
- $72,500
- Closing costs
- $8,700
- Reserves months
- —
- Total cash needed
- —
Loan-product check · same deal, 3 products live
Conventional
25% down · 7.5% · 30yr
- Down + closing
- —
- Monthly P&I
- —
- Monthly cashflow
- —
- DSCR
- —
- Eligible?
- —
Personal DTI + credit; lowest rate.
DSCR
20% down · 8.5% · 30yr
- Down + closing
- —
- Monthly P&I
- —
- Monthly cashflow
- —
- DSCR
- —
- Eligible?
- —
No personal income docs; deal must DSCR.
Hard money
10% down · 12.0% · 12mo
- Down + closing
- —
- Monthly P&I
- —
- Monthly cashflow
- —
- DSCR
- —
- Eligible?
- —
Short-term bridge; refi at stabilization.
Rent comps 27 comps
| Address | Beds | Baths | Sqft | Rent | $/sqft | DOM | Units | Dist |
|---|---|---|---|---|---|---|---|---|
| 9902 S Thomas Dr Unit 1354966P Panama City Beach, FL | 2.0 | 2.0 | 1259 | $1,970 | $1.56 | 13d | 1 | 0.02mi |
| 9815 S Thomas Dr Unit 1523339P Panama City, FL | 3.0 | 2.0 | 1259 | $4,018 | $3.19 | 21d | 1 | 0.10mi |
| 104 Gulfside Ct Unit 1523320P Panama City Beach, FL | 3.0 | 3.0 | 1496 | $5,020 | $3.36 | 13d | 1 | 0.15mi |
| 998 Gulfside Ct Unit 1523366P Panama City Beach, FL | 2.0 | 2.0 | 1065 | $4,124 | $3.87 | 13d | 1 | 0.15mi |
| 10625 Front Beach Rd Unit 1354975P Panama City Beach, FL | 2.0 | 2.0 | 1140 | $3,166 | $2.78 | 13d | 1 | 0.48mi |
| 204 Potters Bluff Dr Panama City Beach, FL | 1.0–3.0 | 1.0–2.0 | 1035 | $1,947 | $1.88 | 13d | 12 | 0.56mi |
| 10811 Front Beach Rd Unit 1354928P Panama City Beach, FL | 3.0 | 2.0 | 1194 | $3,463 | $2.90 | 13d | 1 | 0.64mi |
| 135 Grande Island Blvd Unit 1355007P Panama City Beach, FL | 3.0 | 3.5 | 1797 | $2,759 | $1.54 | 21d | 1 | 0.67mi |
| 133 W Leslie Ln Unit 1 Panama City Beach, FL | 2.0 | 1.5 | 950 | $2,200 | $2.32 | 21d | 1 | 0.77mi |
| 136 Bonnie Ln Panama City Beach, FL | 2.0 | 1.5 | 972 | $1,750 | $1.80 | 13d | 1 | 0.91mi |
| 138 Bonnie Ln Panama City Beach, FL | 2.0 | 1.5 | 972 | $1,599 | $1.65 | 13d | 1 | 0.91mi |
| 2858 Joan Ave Unit 1523343P Panama City, FL | 4.0 | 3.0 | 1754 | $5,270 | $3.00 | 13d | 1 | 0.97mi |
| 8715 Surf Dr Unit 1523323P Panama City Beach, FL | 2.0 | 2.0 | 1194 | $5,377 | $4.50 | 13d | 1 | 1.01mi |
| 2521 Allison Ave Panama City, FL | 2.0 | 2.0 | 980 | $1,450 | $1.48 | 21d | 1 | 1.03mi |
| 98 Paddock Club Dr Panama City Beach, FL | 1.0–3.0 | 1.0–2.0 | 1093 | $2,063 | $1.89 | 13d | 19 | 1.09mi |
| 2917 Allison Ave Panama City Beach, FL | 3.0 | 2.0 | 1592 | $1,700 | $1.07 | 21d | 1 | 1.10mi |
| 2301 Anne Ave Unit 8901 Laird Panama City, FL | 2.0 | 2.0 | 900 | $1,625 | $1.81 | 13d | 1 | 1.13mi |
| 2216 Anne Ave Panama City, FL | 2.0 | 2.0 | 951 | $1,300 | $1.37 | 13d | 1 | 1.16mi |
| 520 N Richard Jackson Blvd #1912 Panama City Beach, FL | 2.0 | 2.0 | 1200 | $2,375 | $1.98 | 13d | 1 | 1.21mi |
| 11222 Hutchison Blvd Unit 1523347P Panama City Beach, FL | 2.0 | 2.0 | 1194 | $3,907 | $3.27 | 21d | 1 | 1.27mi |
| 2526 Laurie Ave Panama City, FL | 2.0 | 2.0 | 950 | $1,750 | $1.84 | 13d | 1 | 1.28mi |
| 104 White Cap Way Panama City Beach, FL | 3.0 | 2.0 | 1146 | $2,700 | $2.36 | 21d | 1 | 1.30mi |
| 10400 Panama City Beach Pkwy Panama City Beach, FL | 1.0–3.0 | 1.0–2.0 | 1151 | $2,372 | $2.06 | 13d | 20 | 1.33mi |
| 175 White Cap Way Unit 1 Panama City Beach, FL | 3.0 | 2.5 | 1432 | $1,750 | $1.22 | 13d | 1 | 1.35mi |
| 1609 Vecuna Cir Panama City Beach, FL | 3.0 | 2.0 | 1268 | $2,100 | $1.66 | 13d | 1 | 1.38mi |
| 8700 Front Beach Rd Panama City Beach, FL | 2.0–3.0 | 2.5 | 1543 | $2,400 | $1.56 | 13d | 2 | 1.41mi |
| 8604 Whelch Dr Panama City, FL | 1.0–3.0 | 1.0–3.0 | 1087 | $2,950 | $2.71 | 13d | 18 | 1.42mi |
HOA detail condo
- Monthly dues
- $0 · $0/yr
- Likely covers
- water
- Assessments
- None detected in remarks — confirm with the listing agent.
Listing history 29 events
-
2026-06-19days on market $290,000 Active 74 DOM
-
2026-06-18days on market $290,000 Active 73 DOM
-
2026-06-17days on market $290,000 Active 72 DOM
-
2026-06-16days on market $290,000 Active 71 DOM
-
2026-06-15days on market $290,000 Active 70 DOM
-
2026-06-14days on market $290,000 Active 68 DOM
-
2026-06-13days on market $290,000 Active 67 DOM
-
2026-06-10days on market $290,000 Active 65 DOM
-
2026-06-09pricedays on market $290,000 Active 64 DOM
-
2026-06-08days on market $312,500 Active 63 DOM
-
2026-06-07days on market $312,500 Active 62 DOM
-
2026-06-05days on market $312,500 Active 59 DOM
-
2026-06-03days on market $312,500 Active 58 DOM
-
2026-06-02days on market $312,500 Active 57 DOM
-
2026-06-01days on market $312,500 Active 56 DOM
-
2026-05-31days on market $312,500 Active 55 DOM
-
2026-05-30days on market $312,500 Active 54 DOM
-
2026-04-06$312,500 Active 1052-char remark
Show marketing remark (1052 chars)
Welcome to Laketown Wharf - where location, lifestyle, and investment potential come together beautifully. This spacious 2BR, 2BA condo with a bunk room offers approximately 1,262 sqft of comfortable coastal living. Thoughtfully designed for both personal enjoyment and rental income, the unit features a stacked washer and dryer and a flexible layout that easily accommodates guests. Step out onto your private balcony and take in the direct waterfront views of the lake, creating a peaceful backdrop for your morning coffee or evening unwind. Perfectly positioned directly across the street from the Gulf, this condo includes dedicated deeded beach access with a private gate and boardwalk through Pineapple Willy's, making beach days effortless. You're also within walking distance to some of Panama City Beach's most popular attractions, including dining, shopping, and entertainment. Whether you're looking for a vacation getaway, income-producing property, or both, this condo offers a true one-stop destination in the heart of Panama City Beach.
-
2025-11-25historical
-
2025-10-30price $310,000
-
2025-05-25$349,900 Active
-
2025-01-01historical
-
2024-05-29price $355,000
-
2024-04-22price $369,000
-
2024-03-01price $379,000
-
2024-01-03$389,000 Active
-
2021-06-22soldstatus $307,500
-
2021-06-18soldstatus $307,500
-
2021-01-26$320,000
ⓘ Source: listings_history table (triggers on properties + properties_extension) + one-shot
backfill from property_details.listing_events for pre-trigger history.
Tax reassessment forecast FL · Resets to sale price
- Current annual tax
- $3,636 · $303/mo
- Projected year-2 tax
- $3,636 · $303/mo
- Expected delta
- $0/yr ($0/mo · 0.0%)
ⓘ Screening estimate from a state-policy table — verify with the county assessor before closing.
Climate risk First Street
- Flood 7/10 Severe FEMA zone X (unshaded) · 77% chance over 30 yrs
- Wildfire 3/10 Moderate
- Heat 10/10 Extreme 7 d/yr ≥106°F today · 21 d/yr by 30 yrs out
- Wind 10/10 Extreme 99% chance of damaging wind over 30 yrs
- Air quality 1/10 Low 0 unhealthy d/yr today · 0 by 30 yrs out
Nearby sold comps map
Loading sold comps map…
Walkable amenities ~0.75 mi
Loading nearby amenities…
Taxation est. · year 1
- Rental income
- $34,844
- − Mortgage interest
- −$16,245
- − Property taxes
- −$3,636
- − Insurance
- −$2,248
- − Repairs & maintenance
- −$2,788
- − Management
- −$2,788
- − HOA
- −$11,136
- − Depreciation
- −$8,436
- Taxable loss
- −$12,432
- Est. tax savings @ 24.0%
- +$2,984
- After-tax cash flow
- $-4,759/yr
For passive investors: Depreciation is non-cash, so a rental often shows a tax loss while cash-flowing — sheltering income. Rental losses are passive: they offset passive income freely, and up to $25,000/yr can offset ordinary (W-2) income if you actively participate and your MAGI is under $100k (phasing out to $0 by $150k); unused losses carry forward. On sale, claimed depreciation is recaptured at up to 25%, and gains may owe capital-gains tax (a 1031 exchange can defer both). Figures are a year-1 estimate at your 24.0% rate — not tax advice; consult a CPA.
Schools (NCES district)
- District
- Bay
- NCES district ID
- 1200090
- Math proficiency
- 51% ▼ -8.00%
- Reading proficiency
- 51% ▼ -7.00%
- Median HH income
- $47,740
- Composite
- 43.41/100
- National rank
- #3014
- State rank
- #29 of 73 in FL
Livability — Panama City Beach
- Score
- 78/100
- State rank
- #172
- US rank
- #2624
Category grades
Schools grade is shown separately in the Schools card above.
Census & demographics
- Census place
- Panama City Beach, FL
- County
- Bay County · 163,593 people
- City population
- 50,689
- Metro
- Panama City, FL
- Population (ZIP)
- 18,832
- Household income
- $80,822
- Rent vs Own
- Severe rent burden
- 817.0
Population outlook (Bay County) Hauer SSP2
- Today (2025)
- 206,264 people
- By 2030
- 217,740 · +5.6%
- By 2040
- 238,738 · +15.7%
- By 2050
- 255,545 · +23.9%
- By 2075
- 288,295 · +39.8%
- By 2100
- 288,638 · +39.9%
Race, ethnicity, and origin ACS 2023
- Neighborhood character
- Predominantly White (81%)
- Race & ethnicity
- White 81% Hispanic / Latino 7% Two or more races 6% Black 3% Asian 2%
- Hispanic origin (detail)
- Mexican 2% Puerto Rican 2%
- Common ancestry
- Romanian 4% Lithuanian 4% Italian 2%
- Foreign-born
- 11% · Canada, South Korea
- Languages at home
- 88% English-only · Spanish 5% Russian/Polish/Slavic 4% Tagalog/Filipino 1%
Political lean MEDSL · Bay
- 2024 margin
- Solid R (+47.4) · D 25.8% · R 73.1% · Other 1.1%
- 2008→2024 swing
- -6.6pp toward R · 2008: -40.7pp · 2024: -47.4pp
- All cycles
- 2024: R+47.4 2020: R+43.5 2016: R+46.3 2012: R+43.6 2008: R+40.7
Not yet ingested
- Civics
- —
Market trends
- HPI YoY
- ▼ -202.52%
- Current HPI
- 246.9126
- Rent YoY
- ▲ 2.55%
- Metro
- Panama City, FL
- State GDP YoY
- ▲ 3.28%
- F500 in state
- 36
Industry mix (Fortune 500 HQ in FL)
| Industry | F500 HQs | Revenue |
|---|---|---|
| Industrial Technology | 2 | $29B |
|
||
| Insurance | 2 | $17B |
|
||
| Retail | 1 | $60B |
|
||
| Technology Distribution | 1 | $58B |
|
||
| Homebuilding | 1 | $35B |
|
||
| Technology Manufacturing | 1 | $35B |
|
||
Price history
-2.3% since first listed12 events — show timeline
- 2026-04-06 Listed $312,500 CPARMLS
- 2025-11-25 Listing Removed — CPARMLS
- 2025-10-30 Price Changed $310,000 CPARMLS
- 2025-05-25 Listed $349,900 CPARMLS
- 2025-01-01 Listing Removed — CPARMLS
- 2024-05-29 Price Changed $355,000 CPARMLS
- 2024-04-22 Price Changed $369,000 CPARMLS
- 2024-03-01 Price Changed $379,000 CPARMLS
- 2024-01-03 Listed $389,000 CPARMLS
- 2021-06-22 Sold (Public Records) $307,500 Public Records
- 2021-06-18 Sold (MLS) $307,500 CPARMLS
- 2021-01-26 Listed $320,000 CPARMLS
Property tax history
+9.8%/yrLatest (2025): $3,636 · -14.6% YoY. Source: county tax records.
Cash-flow waterfall
monthlySold comps — $/sqft
last 12 mo · ≤1 miLoading sold comps…