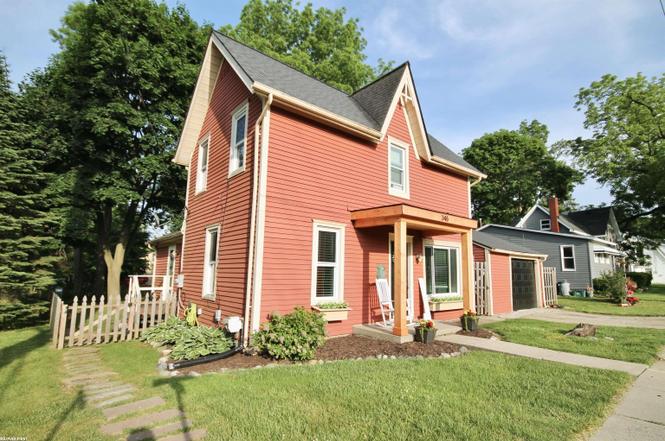
346 N Anderson St · Orion, MI
Flood risk 1/10 · Minimal
- FEMA flood zone
- X (unshaded)
- Chance of flooding over 30 yrs
- 0.0%
- Est. flood insurance / yr
- $473 – $860
Fire risk 1/10 · Minimal
- Est. fire insurance / yr
- $784 – $1,456
Heat risk 2/10 · Minimal
- Hot days now (above 97°F)
- 7 days/yr
- Hot days in 30 yrs
- 15 days/yr
Wind risk 2/10 · Minimal
- Chance of severe wind over 30 yrs
- —
Air-quality risk 3/10 · Minor
- Unhealthy air days now
- 2 days/yr
- Unhealthy air days in 30 yrs
- 4 days/yr
Risk factors via First Street. Map © Google.
Why this score? — see what drove the C grade
The composite is a weighted blend of 9 inputs, each scored 0–100. Each bar is that input's sub-score; the figure is the points it added to the 100-point composite (weight × sub-score).
- Cash flow +21.6/30.0
- ARV discount +8.5/15.0
- DSCR +6.9/10.0
- 1% rule +5.9/10.0
- Schools +5.1/10.0
- Rent growth +2.5/5.0
- Livability +2.5/5.0
- Condition / age +2.5/5.0
- Appreciation +0.0/10.0
$254,900
🖨 Deal sheet 📄 Offer letter ✓ Due diligence
Listing remarks MLS
Welcome home to this charming downtown colonial. Walking distance to downtown restaurants and shopping. Corner, double lot with a beautiful pergola and great entertaining space. House has 3 spacious bedrooms, 2 with brand new flooring updated in 2020. New roof from 2015. Kitchen has been completely remodeled with cement counters and huge farm style sink. Recently remodeled laundry room with custom Penny flooring and updated washer and dryer. This house is full of unique character waiting for you to add your personal touch and call it home.
Key facts
- Deck under pergola
- Quartz countertops
- Fenced yard
Tags
Property features AI
Finance
- Other: Property type: Residential; Lot size approx. 0.15 acres (frontage ~58'); Zoning: Residential; Located in the Village of Lake Orion (Hemingways subdivision)
Exterior
- Parking: Detached garage with garage door opener; Electric in garage; Approximately 1.5 garage parking spaces
- Utilities: Public water; Public sanitary sewer; Natural gas heat and gas water heater; Electric service to garage
- Home design: Residential 2-story; Built in 1920; Entry-level kitchen, dining and great room; Below-grade finished area not reported (416 sq ft below grade)
- Construction: Basement and crawl foundation; Aluminum exterior construction; Basement present (mi basement type)
- Exterior features: Aluminum exterior; Deck; Fenced yard; Paved street frontage; Frontage on road; No floodplain
Interior
- Kitchen: Dishwasher; Range/oven; Microwave; Refrigerator
- Bedrooms: Bedroom 1 on upper level (approx. 13 x 11); Bedroom 2 on upper level (approx. 16 x 10); Bedroom 3 on upper level (approx. 9 wide)
- Flooring: Hardwood floors
- Bathrooms: One full bathroom (entry level)
- Heating & cooling: Forced air heating; Central A/C; Ceiling fan(s); Gas water heater
- Interior features: Hardwood floors; Great room; Formal dining room; Eat-in kitchen; First-floor laundry
- Laundry & utility: Washer; Dryer; Laundry room on entry level (approx. 7 x 5)
Neighborhood map
What this means for you Summary
Snapshot
- This is a 3-bed/1.0-bath single-family listed at $255k.
Deal economics
- At list price, monthly cash flow is $389 ($5k/yr) — positive.
- The deal already cash-flows at list — no discount required.
- Meets the 1% rule at list price ($3k rent vs $255k).
Location & tenants
- Location reads: area grade C — affects rentability + tenant quality, not the cash-flow math above.
- Lake Orion Community Schools (suburban): math 49% / reading 64% proficiency, ranked #45 of 540 in MI (top 8%) — acceptable for families but not a draw, mixed tenant base, ~2y average lease; only 16% free/reduced lunch — higher-income household profile.
- Market conditions: 88 active listings in the ZIP; 5 comparable units currently listed for rent nearby; rentals at typical pace (median 15d on market — plan ~3-4 weeks tenant-placement turnaround); 2,614 units permitted in Oakland County in 2024 (721 in 5+ unit buildings).
Forward outlook
- Local home prices are declining (-3.0%/yr); year-one equity from $2k of loan paydown is wiped out by about $8k of value loss. Plan a longer hold.
- Oakland County population projected at +10% by 2050 — modest demand growth; plan on rents tracking national, not racing it.
Negotiation context
- Only 1 days on market — expect competitive offers; lowballing is unlikely to land.
- 3 sale attempts since 24y ago; this cycle's ask is 13% above the opening price — seller raised mid-cycle; expect resistance to lowballs.
- Current owner paid $210k; 21% above their basis — modest negotiation headroom, anchor on the comps not their cost.
Risks & watch-outs
- Watch-outs: built in 1920 — expect roof / HVAC / electrical / plumbing capex.
Questions for the listing agent
- Built in 1920 — when were the roof, HVAC, electrical panel, plumbing, and water heater last replaced?
- Is there a deadline driving the sale (1031 exchange, divorce, estate, relocation)? That informs how much negotiation room exists.
- What's the average days-on-market for RENTAL listings here right now (not sales)? A rising rental-DOM trend means longer vacancies and softer asking-rent achievability than the comps imply.
- What's the recent tenant-quality profile in this submarket — average credit score on applications, eviction rate, late-payment / NSF rate, and stable-employment percentage? A property-management company in the area should have these aggregated.
- How much new for-sale + rental construction is in the pipeline within 1–3 miles? Heavy new supply typically softens prices + rents 12–24 months out; constrained supply supports both.
Investment metrics
- 1% rule
- 1.09% ✓
- Cap rate
- 8.13%
- Cash-on-cash
- 6.55%
- DSCR
- 1.29
- GRM
- 7.7
CMA / ARV
- ARV (on-the-fly)
- $260,400
- Comps found
- 12
Show comp detail 12 sales within ~0.75 mi
| Address | Dist | Beds/Ba | Sqft | Sold | Price | $/sf | Match |
|---|---|---|---|---|---|---|---|
| 325 N Broadway St | 0.08mi | 3/1.0 | 1,318 (+10%) | 1mo | $165,000 | $125 | 79 |
| 225 E Shadbolt St | 0.16mi | 2/1.0 (-1) | 1,215 (+1%) | 8mo | $315,000 | $259 | 79 |
| 126 N North Shore Dr | 0.46mi | 3/1.5 | 1,170 (-2%) | 4mo | $230,000 | $197 | 69 |
| 790 Luna Ct | 0.53mi | 3/2.0 | 1,224 (+2%) | 0mo | $307,000 | $251 | 67 |
| 811 Miller Rd | 0.58mi | 3/2.0 | 1,271 (+6%) | 0mo | $219,000 | $172 | 59 |
| 733 Luna Ct | 0.48mi | 2/1.5 (-1) | 1,128 (-6%) | 3mo | $245,000 | $217 | 58 |
| 229 W Flint St | 0.38mi | 3/2.0 | 1,352 (+13%) | 4mo | $285,000 | $211 | 53 |
| 749 Mariday St | 0.60mi | 3/1.5 | 1,316 (+10%) | 3mo | $275,000 | $209 | 51 |
| 586 Bagley St | 0.55mi | 3/1.0 | 1,036 (-14%) | 1mo | $242,500 | $234 | 51 |
| 902 Mcclellan St | 0.65mi | 3/2.5 | 1,150 (-4%) | 13mo | $256,000 | $223 | 46 |
| 414 Norland St | 0.65mi | 3/1.0 | 1,300 (+8%) | 12mo | $265,000 | $204 | 45 |
| 243 Reno St | 0.47mi | 2/1.0 (-1) | 1,068 (-11%) | 12mo | $240,000 | $225 | 45 |
Match score weights: distance 35% · size 25% · config 20% · recency 20%. Top-matched comps best support the ARV.
Projected returns pro-forma
-3.0% appreciation · 3.0% rent growth · sell at horizon
- IRR
- -6.2%
- Equity multiple
- 0.77×
- Total profit
- $-16,444
- Equity at exit
- $38,006
- IRR
- 3.5%
- Equity multiple
- 1.25×
- Total profit
- $17,868
- Equity at exit
- $22,039
Cash invested: $71,372 (down + closing). Projections, not guarantees.
Landlord ↔ Tenant lean methodology
- Overall (STATE)
- 62 Landlord-Friendly
- State Michigan
- 62 Landlord-Friendly · EVEN
- County
- — inherits STATE
- City
- — inherits STATE
ZIP-level market 48362
- Active inventory
- 88
- Price-to-rent
- 7.7×
Monthly cashflow live
- Estimated rent
- $2,767 high interval (Pro) →
- Mortgage (P&I)
- −$1,337
- Tax from tax record
- −$354 /mo · $4,246/yr
- Insurance
- −$106
- HOA
- −$0
- Vacancy / Maint / Mgmt
- −$581
- Net cashflow
- $389
Break-even live
UW: 25.0% down · 7.5% · 30yr · 1.5% tax · 5.0% vac · 8.0% maint · 8.0% mgmt
Financing live
Cash to close
- Down payment
- $63,725
- Closing costs
- $7,647
- Reserves months
- —
- Total cash needed
- —
Loan-product check · same deal, 3 products live
Conventional
25% down · 7.5% · 30yr
- Down + closing
- —
- Monthly P&I
- —
- Monthly cashflow
- —
- DSCR
- —
- Eligible?
- —
Personal DTI + credit; lowest rate.
DSCR
20% down · 8.5% · 30yr
- Down + closing
- —
- Monthly P&I
- —
- Monthly cashflow
- —
- DSCR
- —
- Eligible?
- —
No personal income docs; deal must DSCR.
Hard money
10% down · 12.0% · 12mo
- Down + closing
- —
- Monthly P&I
- —
- Monthly cashflow
- —
- DSCR
- —
- Eligible?
- —
Short-term bridge; refi at stabilization.
Rent comps 5 comps
| Address | Beds | Baths | Sqft | Rent | $/sqft | DOM | Units | Dist |
|---|---|---|---|---|---|---|---|---|
| 120 S Broadway St Lake Orion, MI | 2.0 | 2.0 | 1065 | $2,950 | $2.77 | 14d | 1 | 0.32mi |
| 733 Luna Ct Lake Orion, MI | 3.0 | 1.5 | 1177 | $2,695 | $2.29 | 19d | 1 | 0.50mi |
| 784 Porteous Dr Lake Orion, MI | 2.0 | 1.0 | 875 | $1,600 | $1.83 | 43d | 1 | 0.68mi |
| 442 Mystic Cove Ln Lake Orion, MI | 2.0–4.0 | 2.0–3.0 | 1989 | $5,350 | $2.69 | 1d | 4 | 0.74mi |
| 711 Kimberly Lake Orion, MI | 1.0–2.0 | 1.0–1.5 | 985 | $1,149 | $1.17 | 1d | 6 | 1.09mi |
Listing history 2 events
-
2026-06-18remarks 699-char remark
-
2026-06-18$254,900 Coming Soon 1 DOM
ⓘ Source: listings_history table (triggers on properties + properties_extension) + one-shot
backfill from property_details.listing_events for pre-trigger history.
Tax reassessment forecast MI · Partial reset (capped growth)
- Current annual tax
- $4,246 · $354/mo
- Projected year-2 tax
- $4,246 · $354/mo
- Expected delta
- $0/yr ($0/mo · 0.0%)
ⓘ Screening estimate from a state-policy table — verify with the county assessor before closing.
Climate risk First Street
- Flood 1/10 Low FEMA zone X (unshaded) · 0% chance over 30 yrs
- Wildfire 1/10 Low
- Heat 2/10 Low 7 d/yr ≥97°F today · 15 d/yr by 30 yrs out
- Wind 2/10 Low
- Air quality 3/10 Moderate 2 unhealthy d/yr today · 4 by 30 yrs out
Nearby sold comps map
Loading sold comps map…
Walkable amenities ~0.75 mi
Loading nearby amenities…
Taxation est. · year 1
- Rental income
- $33,206
- − Mortgage interest
- −$14,278
- − Property taxes
- −$4,246
- − Insurance
- −$1,274
- − Repairs & maintenance
- −$2,656
- − Management
- −$2,656
- − Depreciation
- −$7,415
- Taxable income
- $679
- Est. tax owed @ 24.0%
- −$163
- After-tax cash flow
- $4,509/yr
For passive investors: Depreciation is non-cash, so a rental often shows a tax loss while cash-flowing — sheltering income. Rental losses are passive: they offset passive income freely, and up to $25,000/yr can offset ordinary (W-2) income if you actively participate and your MAGI is under $100k (phasing out to $0 by $150k); unused losses carry forward. On sale, claimed depreciation is recaptured at up to 25%, and gains may owe capital-gains tax (a 1031 exchange can defer both). Figures are a year-1 estimate at your 24.0% rate — not tax advice; consult a CPA.
Schools (NCES district)
- District
- Lake Orion Community Schools
- NCES district ID
- 2620730
- Math proficiency
- 49% ▼ -10.00%
- Reading proficiency
- 64% ▼ -10.00%
- Median HH income
- $82,396
- Composite
- 51.21/100
- National rank
- #1755
- State rank
- #45 of 540 in MI
Livability — Orion
No livability data for this city. (Only ~50 U.S. cities are tracked.)
Census & demographics
- Census place
- Lake Orion, MI
- City population
- 10,401
- Population (ZIP)
- 14,746
Population outlook (Oakland County) Hauer SSP2
- Today (2025)
- 1,335,747 people
- By 2030
- 1,375,100 · +2.9%
- By 2040
- 1,435,385 · +7.5%
- By 2050
- 1,469,250 · +10.0%
- By 2075
- 1,531,946 · +14.7%
- By 2100
- 1,450,485 · +8.6%
Race, ethnicity, and origin ACS 2023
- Neighborhood character
- Predominantly White (88%)
- Race & ethnicity
- White 88% Two or more races 5% Hispanic / Latino 4% Black 2% Asian 2%
- Common ancestry
- Romanian 11% Lithuanian 5% Slovak 3%
- Foreign-born
- 6% · Canada, China, Dominican Republic
- Languages at home
- 95% English-only · Spanish 1% Chinese 1% German/W. Germanic 1%
Political lean MEDSL · Oakland
- 2024 margin
- D (+10.6) · D 54.4% · R 43.8% · Other 1.9%
- 2008→2024 swing
- -3.9pp toward R · 2008: 14.5pp · 2024: 10.6pp
- All cycles
- 2024: D+10.6 2020: D+14.1 2016: D+8.1 2012: D+8.1 2008: D+14.5
Not yet ingested
- Civics
- —
Market trends
- HPI YoY
- ▼ -307.96%
- Current HPI
- 182.3653
- Rent YoY
- —
- Metro
- —
- State GDP YoY
- ▲ 1.37%
- F500 in state
- 28
Industry mix (Fortune 500 HQ in MI)
| Industry | F500 HQs | Revenue |
|---|---|---|
| Automotive Parts | 3 | $48B |
|
||
| Automotive | 2 | $372B |
|
||
| Chemicals | 1 | $45B |
|
||
| Automotive Retail | 1 | $29B |
|
||
| Healthcare / Medical Devices | 1 | $23B |
|
||
| Automotive Technology | 1 | $20B |
|
||
Price history
+84.8% since first listed12 events — show timeline
- 2026-06-18 Coming Soon $254,900 MiRealSource-MiMLS
- 2020-11-06 Sold (MLS) $210,000 MiRealSource-MiMLS
- 2020-11-06 Sold (MLS) $210,000 REALCOMP
- 2020-10-06 Contingent — MiRealSource-MiMLS
- 2020-10-06 Contingent — REALCOMP
- 2020-10-02 Price Changed $217,900 MiRealSource-MiMLS
- 2020-10-02 Price Changed $217,900 REALCOMP
- 2020-09-24 Listed $225,000 MiRealSource-MiMLS
- 2020-09-24 Listed $225,000 REALCOMP
- 2002-12-16 Sold (Public Records) $135,000 Public Records
- 2002-10-10 Sold (MLS) $135,000 REALCOMP
- 2002-08-20 Listed $137,900 REALCOMP
Property tax history
+8.2%/yrLatest (2025): $4,246 · +2.8% YoY. Source: county tax records.
Cash-flow waterfall
monthlySold comps — $/sqft
last 12 mo · ≤1 miLoading sold comps…