 🏗️ New Construction
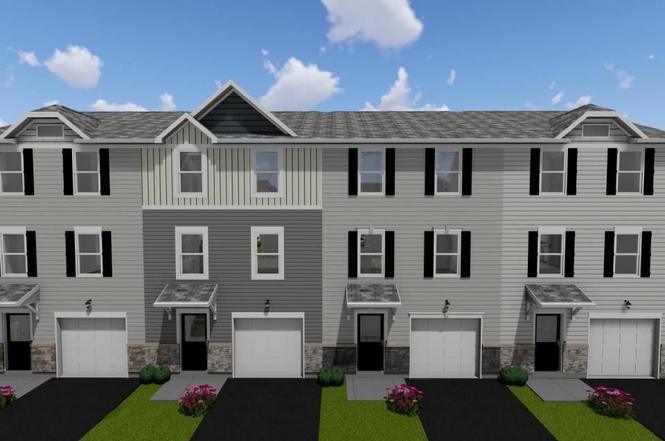
Tulip Plan · Ranson, WV
Flood risk No data
- FEMA flood zone
- —
- Chance of flooding over 30 yrs
- —
- Est. flood insurance / yr
- —
Fire risk No data
- Est. fire insurance / yr
- —
Heat risk No data
- Hot days now (above threshold)
- —
- Hot days in 30 yrs
- —
Wind risk No data
- Chance of severe wind over 30 yrs
- —
Air-quality risk No data
- Unhealthy air days now
- —
- Unhealthy air days in 30 yrs
- —
Risk factors via First Street. Map © Google.
Why this score? — see what drove the D grade
The composite is a weighted blend of 9 inputs, each scored 0–100. Each bar is that input's sub-score; the figure is the points it added to the 100-point composite (weight × sub-score).
- Appreciation +10.0/10.0
- ARV discount +7.5/15.0
- Cash flow +7.3/30.0
- Schools +3.4/10.0
- Livability +3.3/5.0
- Rent growth +2.5/5.0
- Condition / age +2.5/5.0
- 1% rule +2.1/10.0
- DSCR +1.5/10.0
$279,990
🖨 Deal sheet (PDF) 📄 Offer letter ✓ Due diligence
Key facts
- Built-in flex space
- Stunning kitchen
- Lvp flooring
Tags
Property features AI
Finance
- Financial info: List price $289,990
Exterior
- Home design: Single-family plan (Tulip); Located at 54 Sumter Ave, Ranson, WV 25438; Active listing
- Construction: New construction inventory (Plan)
- Exterior features: Living area of 1,576
Interior
- Bedrooms: 3 bedrooms
- Bathrooms: 2 full bathrooms and 1 half bathroom (2.5 total)
- Interior features: Plan is named Tulip (new construction plan)
Neighborhood map
What this means for you Summary
Snapshot
- This is a 3-bed/2.5-bath single-family listed at $280k.
Deal economics
- At list price, monthly cash flow is $-419 ($-5k/yr) — negative.
- To cash-flow at today's rent, offer at most $255k (9.1% below list).
- To meet the 1% rule (rent ≥ 1% of price), the offer needs to be $223k (20.5% below list).
- Recommended offer: $223k (20.5% below list) — sets the bar for 1% rule.
- Cap rate 4.7% vs local median 3.8% in Ranson — meaningfully above typical; check what's discounted (condition, days-on-market, listing class) to confirm the premium yield is real.
Location & tenants
- Location reads 66/100 on livability (#100 in WV) — a middle-class / working-renter tenant base. Strengths: crime A+, housing A+, cost of living A-; Watch: amenities F, commute F, health & safety F.
- Jefferson County Schools (rural): math 29% / reading 46% proficiency, ranked #6 of 55 in WV (top 11%) — families likely to look elsewhere, expect single-tenant / working-renter base with shorter leases.
- Zoned schools: T A Lowery Elementary School (math 27% / reading 37%, grade F, #191 of 377 statewide, top 56%, 522 students, 0% FRL); Wildwood Middle School (math 15% / reading 40%, grade F, #70 of 109 statewide, top 65%, 425 students, 0% FRL); Jefferson High School (math 30% / reading 62%, grade D-, #9 of 110 statewide, top 7%, 1,444 students, 0% FRL) — zoned schools average 0% FRL vs 33% district-wide (33 pts lower); this property's tenant base skews higher-income than the district average.
- Market conditions: 323 active listings in the ZIP; 17 comparable units currently listed for rent nearby; rentals at typical pace (median 15d on market — plan ~3-4 weeks tenant-placement turnaround); solid renter incomes; 1,162 units permitted in Jefferson County in 2024 (360 in 5+ unit buildings).
- This rent runs 33% of the median local income ($82k/yr) — at the standard rent-burdened threshold; future hikes will face affordability resistance.
Forward outlook
- In year one you build about $34k of equity ($2k loan paydown + $32k appreciation (10.0% local appreciation)).
- Jefferson County population projected at +13% by 2050 — modest demand growth; plan on rents tracking national, not racing it.
- By year 2, paydown + projected appreciation supports a ~$54k cash-out refi (75% LTV) — recoverable capital for the next deal without selling this one.
Negotiation context
- It's been on market 376 days — a 12% lower offer ($246k) is reasonable based on typical stale-listing flexibility.
Questions for the listing agent
- What do current leases actually rent for vs. the listed asking? Can we see a recent rent roll and the last 12 months of T-12 income?
- It's been on market 376 days. Have you received any prior offers? Is the seller open to a 20% concession, seller financing, or rate buy-down credit?
- Why hasn't it sold? Are there any deal-killer items the seller is aware of (foundation, flood, title, zoning, code violations)?
- Is there a deadline driving the sale (1031 exchange, divorce, estate, relocation)? That informs how much negotiation room exists.
- Schools are F-rated, which usually means shorter tenancies and higher turnover. Who's the typical renter profile here, and what's been the actual vacancy rate?
- The area grade is low — what's the realistic commute time and amenity access for the typical tenant pool here? Any planned neighborhood developments (good or bad) we should know about?
- What's the average days-on-market for RENTAL listings here right now (not sales)? A rising rental-DOM trend means longer vacancies and softer asking-rent achievability than the comps imply.
- What's the recent tenant-quality profile in this submarket — average credit score on applications, eviction rate, late-payment / NSF rate, and stable-employment percentage? A property-management company in the area should have these aggregated.
- How much new for-sale + rental construction is in the pipeline within 1–3 miles? Heavy new supply typically softens prices + rents 12–24 months out; constrained supply supports both.
Investment metrics
- 1% rule
- 0.71% ✗
- Cap rate
- 4.70%
- Cash-on-cash
- -5.70%
- DSCR
- 0.75
- GRM
- 11.8
CMA / ARV
- ARV (on-the-fly)
- $315,200
- Comps found
- 11
Show comp detail 11 sales within ~0.75 mi
| Address | Dist | Beds/Ba | Sqft | Sold | Price | $/sf | Match |
|---|---|---|---|---|---|---|---|
| 263 Ellery St | 0.18mi | 3/2.5 | 1,520 (-4%) | 16mo | $375,000 | $247 | 72 |
| 123 Hopkins | 0.18mi | 3/2.5 | 1,520 (-4%) | 17mo | $350,000 | $230 | 71 |
| 252 Ellery St | 0.22mi | 3/2.5 | 1,640 (+4%) | 18mo | $419,990 | $256 | 68 |
| 117 Park Ave E | 0.41mi | 3/2.5 | 1,588 (+1%) | 20mo | $379,000 | $239 | 63 |
| 995 N Mildred St | 0.28mi | 2/2.0 (-1) | 1,658 (+5%) | 10mo | $270,000 | $163 | 62 |
| 305 E 11th Ave | 0.68mi | 3/2.0 | 1,568 (-0%) | 12mo | $309,900 | $198 | 55 |
| 25 Stayman Dr | 0.36mi | 2/1.5 (-1) | 1,638 (+4%) | 15mo | $289,000 | $176 | 55 |
| 40 Stiles Way | 0.10mi | 4/2.0 (+1) | 1,344 (-15%) | 12mo | $300,000 | $223 | 54 |
| 44 Orchard Dr | 0.52mi | 3/1.5 | 1,651 (+5%) | 16mo | $275,000 | $167 | 50 |
| 211 E 11th Ave | 0.66mi | 4/2.0 (+1) | 1,532 (-3%) | 14mo | $307,000 | $200 | 46 |
| 29 Cider Ln | 0.60mi | 3/1.0 | 1,360 (-14%) | 24mo | $270,000 | $199 | 24 |
Match score weights: distance 35% · size 25% · config 20% · recency 20%. Top-matched comps best support the ARV.
Projected returns pro-forma
10.0% appreciation · 3.0% rent growth · sell at horizon
- IRR
- 20.2%
- Equity multiple
- 2.64×
- Total profit
- $145,021
- Equity at exit
- $283,957
- IRR
- 18.5%
- Equity multiple
- 6.08×
- Total profit
- $448,111
- Equity at exit
- $612,364
Cash invested: $88,256 (down + closing). Projections, not guarantees.
Landlord ↔ Tenant lean methodology
- Overall (STATE)
- 83 Strongly Landlord-Friendly
- State West Virginia
- 83 Strongly Landlord-Friendly · R+22
- County
- — inherits STATE
- City
- — inherits STATE
ZIP-level market 25438
- Home prices YoY
- 10.3%
- Active inventory
- 323
- Price-to-rent
- 10.5×
Monthly cashflow live
- Estimated rent
- $2,227 high interval (Pro) →
- Mortgage (P&I)
- −$1,653
- Tax est. 1.5%
- −$394 /mo · $4,728/yr
- Insurance
- −$131
- HOA
- −$0
- Vacancy / Maint / Mgmt
- −$468
- Net cashflow
- $-419
Break-even live
Sensitivity live
| Price | -10% $-201 | -5% $-310 | +0% $-419 | +5% $-528 | +10% $-637 |
|---|---|---|---|---|---|
| Rent | -10% $-595 | -5% $-507 | +0% $-419 | +5% $-331 | +10% $-243 |
| Rate | -1.0pp $-260 | -0.5pp $-339 | base $-419 | +0.5pp $-501 | +1.0pp $-584 |
UW: 25.0% down · 7.5% · 30yr · 1.5% tax · 5.0% vac · 8.0% maint · 8.0% mgmt
Financing live
Cash to close
- Down payment
- $78,800
- Closing costs
- $9,456
- Reserves months
- —
- Total cash needed
- —
Loan-product check · same deal, 3 products live
Conventional
25% down · 7.5% · 30yr
- Down + closing
- —
- Monthly P&I
- —
- Monthly cashflow
- —
- DSCR
- —
- Eligible?
- —
Personal DTI + credit; lowest rate.
DSCR
20% down · 8.5% · 30yr
- Down + closing
- —
- Monthly P&I
- —
- Monthly cashflow
- —
- DSCR
- —
- Eligible?
- —
No personal income docs; deal must DSCR.
Hard money
10% down · 12.0% · 12mo
- Down + closing
- —
- Monthly P&I
- —
- Monthly cashflow
- —
- DSCR
- —
- Eligible?
- —
Short-term bridge; refi at stabilization.
Rent comps 17 comps
| Address | Beds | Baths | Sqft | Rent | $/sqft | DOM | Units | Dist |
|---|---|---|---|---|---|---|---|---|
| 406 Freeman St Ranson, WV | 3.0 | 2.5 | 1906 | $2,600 | $1.36 | 5d | 1 | 0.20mi |
| 415 17th Ave Ranson, WV | 3.0 | 2.5 | 1521 | $1,990 | $1.31 | 26d | 1 | 0.53mi |
| 405 17th Ave Ranson, WV | 3.0 | 2.5 | 1725 | $2,150 | $1.25 | 7d | 1 | 0.53mi |
| 1308 Cedar Valley Rd Unit 1308 Ranson, WV | 2.0 | 4.0 | 1333 | $1,899 | $1.42 | 26d | 1 | 0.54mi |
| 1344 Red Clover Ln Ranson, WV | 3.0 | 2.5 | 1723 | $2,099 | $1.22 | 15d | 1 | 0.55mi |
| 452 18th Ave Ranson, WV | 3.0 | 2.5 | 1726 | $1,895 | $1.10 | 1d | 1 | 0.58mi |
| 1130 Stallion St Ranson, WV | 3.0 | 2.5 | 1648 | $1,900 | $1.15 | 7d | 1 | 0.73mi |
| 1247 Mare St Ranson, WV | 3.0 | 2.5 | 1985 | $2,080 | $1.05 | 26d | 1 | 0.84mi |
| 214 Coolidge Ave Ranson, WV | 2.0 | 2.5 | 1387 | $1,925 | $1.39 | 20d | 1 | 1.26mi |
| 112 Cecily Way Unit 112 Ranson, WV | 3.0 | 4.0 | 1905 | $2,100 | $1.10 | 7d | 1 | 1.27mi |
| 300 Presidents Pointe Ave Ranson, WV | 3.0 | 2.5 | 1731 | $2,200 | $1.27 | 20d | 1 | 1.27mi |
| 163 Anthem St Ranson, WV | 2.0 | 2.5 | 1386 | $2,500 | $1.80 | 6d | 1 | 1.29mi |
| 36 Anthem St Ranson, WV | 2.0 | 2.5 | 1397 | $1,800 | $1.29 | 26d | 1 | 1.29mi |
| 99 Anthem St Ranson, WV | 2.0 | 2.5 | 1387 | $2,000 | $1.44 | 26d | 1 | 1.30mi |
| 51 Cecily Way Ranson, WV | 3.0 | 2.5 | 1998 | $2,000 | $1.00 | 15d | 1 | 1.33mi |
| 34 Coolidge Ave Ranson, WV | 2.0 | 2.5 | 1397 | $1,850 | $1.32 | 4d | 1 | 1.34mi |
| 495 National St Ranson, WV | 2.0 | 2.5 | 1330 | $1,850 | $1.39 | 26d | 1 | 1.35mi |
Listing history 15 events
-
2026-06-21days on market $279,990 Active 376 DOM
-
2026-06-18days on market $279,990 Active 373 DOM
-
2026-06-17days on market $279,990 Active 372 DOM
-
2026-06-16days on market $279,990 Active 371 DOM
-
2026-06-15days on market $279,990 Active 370 DOM
-
2026-06-13days on market $279,990 Active 368 DOM
-
2026-06-13pricedays on market $279,990 Active 367 DOM
-
2026-06-09days on market $289,990 Active 364 DOM
-
2026-06-08days on market $289,990 Active 363 DOM
-
2026-06-07days on market $289,990 Active 362 DOM
-
2026-06-04days on market $289,990 Active 359 DOM
-
2026-06-03days on market $289,990 Active 358 DOM
-
2026-06-02days on market $289,990 Active 357 DOM
-
2026-06-01days on market $289,990 Active 356 DOM
-
2026-05-31days on market $289,990 Active 355 DOM
ⓘ Source: listings_history table (triggers on properties + properties_extension) + one-shot
backfill from property_details.listing_events for pre-trigger history.
Nearby sold comps map
Loading sold comps map…
Walkable amenities ~0.75 mi
Loading nearby amenities…
Taxation est. · year 1
- Rental income
- $26,725
- − Mortgage interest
- −$17,656
- − Property taxes
- −$4,728
- − Insurance
- −$1,576
- − Repairs & maintenance
- −$2,138
- − Management
- −$2,138
- − Depreciation
- −$9,169
- Taxable loss
- −$10,680
- Est. tax savings @ 24.0%
- +$2,563
- After-tax cash flow
- $-2,463/yr
For passive investors: Depreciation is non-cash, so a rental often shows a tax loss while cash-flowing — sheltering income. Rental losses are passive: they offset passive income freely, and up to $25,000/yr can offset ordinary (W-2) income if you actively participate and your MAGI is under $100k (phasing out to $0 by $150k); unused losses carry forward. On sale, claimed depreciation is recaptured at up to 25%, and gains may owe capital-gains tax (a 1031 exchange can defer both). Figures are a year-1 estimate at your 24.0% rate — not tax advice; consult a CPA.
Schools (NCES district)
- District
- Jefferson County Schools
- NCES district ID
- 5400570
- Math proficiency
- 29% ▼ -13.00%
- Reading proficiency
- 46% ▼ -7.00%
- Median HH income
- $67,038
- Composite
- 33.98/100
- National rank
- #5322
- State rank
- #6 of 55 in WV
Livability — Ranson
- Score
- 66/100
- State rank
- #100
- US rank
- #11255
Category grades
Schools grade is shown separately in the Schools card above.
Census & demographics
- Census place
- Ranson, WV
- County
- Jefferson County · 28,403 people
- City population
- 7,330
- Metro
- Washington-Arlington-Alexandria, DC-VA-MD-WV
- Population (ZIP)
- 7,330
- Household income
- $81,875
- Rent vs Own
- Severe rent burden
- 90.0
Population outlook (Jefferson County) Hauer SSP2
- Today (2025)
- 61,715 people
- By 2030
- 64,052 · +3.8%
- By 2040
- 67,713 · +9.7%
- By 2050
- 69,843 · +13.2%
- By 2075
- 72,679 · +17.8%
- By 2100
- 71,872 · +16.5%
Race, ethnicity, and origin ACS 2023
- Neighborhood character
- Predominantly White (72%)
- Race & ethnicity
- White 72% Hispanic / Latino 14% Two or more races 7% Black 7% Asian 3%
- Hispanic origin (detail)
- Mexican 3% Puerto Rican 4%
- Common ancestry
- Serbian 4% Italian 2% Romanian 2%
- Foreign-born
- 7% · Canada, Philippines
- Languages at home
- 87% English-only · Spanish 9% Other Asian/Pacific 3%
Political lean MEDSL · Jefferson
- 2024 margin
- R (+15.8) · D 41.0% · R 56.8% · Other 2.1%
- 2008→2024 swing
- -20.6pp toward R · 2008: 4.8pp · 2024: -15.8pp
- All cycles
- 2024: R+15.8 2020: R+10.5 2016: R+15.3 2012: R+4.0 2008: D+4.8
Not yet ingested
- Civics
- —
Market trends
- HPI YoY
- ▲ 32.87%
- Current HPI
- 352.707
- Rent YoY
- —
- Metro
- Washington-Arlington-Alexandria, DC-VA-MD-WV
- State GDP YoY
- —
- F500 in state
- 0
Cash-flow waterfall
monthlySold comps — $/sqft
last 12 mo · ≤1 miLoading sold comps…