310 Anthon Dr · Monroeville, PA
Flood risk 1/10 · Minimal
- FEMA flood zone
- X (unshaded)
- Chance of flooding over 30 yrs
- 0.0%
- Est. flood insurance / yr
- $473 – $860
Fire risk 1/10 · Minimal
- Est. fire insurance / yr
- $511 – $949
Heat risk 3/10 · Minor
- Hot days now (above 96°F)
- 7 days/yr
- Hot days in 30 yrs
- 17 days/yr
Wind risk 2/10 · Minimal
- Chance of severe wind over 30 yrs
- 0.0%
Air-quality risk 4/10 · Minor
- Unhealthy air days now
- 5 days/yr
- Unhealthy air days in 30 yrs
- 7 days/yr
Risk factors via First Street. Map © Google.
Why this score? — see what drove the B- grade
The composite is a weighted blend of 9 inputs, each scored 0–100. Each bar is that input's sub-score; the figure is the points it added to the 100-point composite (weight × sub-score).
- Cash flow +30.0/30.0
- 1% rule +10.0/10.0
- DSCR +10.0/10.0
- ARV discount +7.5/15.0
- Rent growth +4.4/5.0
- Livability +3.9/5.0
- Condition / age +2.5/5.0
- Schools +1.6/10.0
- Appreciation +0.0/10.0
$49,900
🖨 Deal sheet (PDF) 📄 Offer letter ✓ Due diligence
Listing remarks
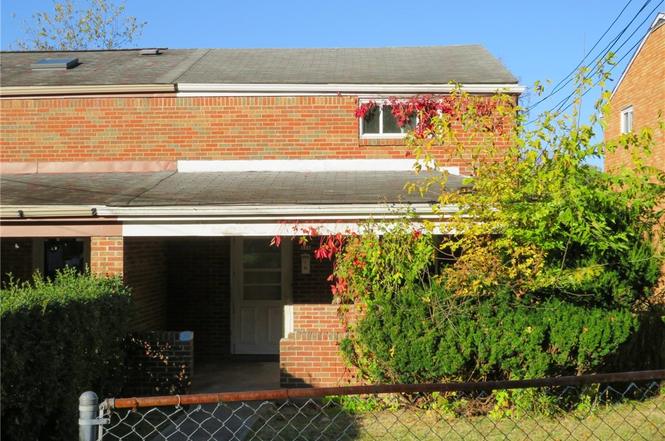
Two story brick home with a front covered porch and a one car integral garage. Both bedrooms and the full bathroom are located upstairs. Full, unfinished basement. Minutes to I-376.
Key facts
- Front covered porch
- Minutes to i-376
- 2,613 sq ft lot
Tags
Property features AI
Exterior
- Parking: Attached garage (built-in), 1 parking space
- Home design: Two-story brick residence; Resale property
- Construction: Brick construction
- Exterior features: 25 x 105 lot dimensions (approx.)
Interior
- Flooring: Hardwood
- Bathrooms: 1 full bathroom
- Interior features: Hardwood flooring; Full unfinished basement
Neighborhood map
What this means for you Summary
Snapshot
- This is a 2-bed/1.0-bath condo listed at $50k.
Deal economics
- At list price, monthly cash flow is $580 ($7k/yr) — positive.
- The deal already cash-flows at list — no discount required.
- Meets the 1% rule at list price ($1k rent vs $50k).
- Recommended offer: $47k (6.0% below list) — sets the bar for market timing.
Location & tenants
- Location reads 77/100 on livability (#358 in PA, #3,140 nationally) — a middle-class / working-renter tenant base. Strengths: cost of living A+, housing A+, employment A; Watch: health & safety D+, amenities F, commute F.
- Penn Hills SD (suburban): math 13% / reading 24% proficiency, ranked #496 of 539 in PA (top 92%) — low school quality limits family demand, transient renter base, plan for 1-2y turnover.
- Zoned schools: Penn Hills El Sch (math 14% / reading 27%, grade F, #1,243 of 1,518 statewide, top 82%, 1,279 students, 100% FRL); Linton Ms (math 3% / reading 21%, grade F, #489 of 512 statewide, top 96%, 640 students, 100% FRL); Penn Hills Shs (math 34% / reading 24%, grade F, #357 of 437 statewide, top 82%, 1,107 students, 88% FRL) — zoned schools average 96% FRL vs 56% district-wide (40 pts higher); higher-poverty schools than district average — tighter screening recommended.
- Market conditions: Rents rising fast (+7.6%/yr); 129 active listings in the ZIP; 10 comparable units currently listed for rent nearby; rentals lingering (median 46d on market — plan ~5-8 weeks vacancy on turnover, expect pricing pressure); 50% of comp listings sitting > 30 days — soft ceiling on asking rent; 2,996 units permitted in Allegheny County in 2024 (1,588 in 5+ unit buildings).
Forward outlook
- Local home prices are declining (-3.0%/yr); year-one equity from $345 of loan paydown is wiped out by about $1k of value loss. Plan a longer hold.
- At projected returns (-3.0% appreciation + 7.6% rent growth), your $14k cash investment doubles in ~3 years — after that, you're playing with house money.
Negotiation context
- It's been on market 74 days — a 6% lower offer ($47k) is reasonable based on typical stale-listing flexibility.
- 4 sale attempts; this cycle's ask has dropped $10k (17%) from the opening price — seller is motivated, your offer sets the floor, not the list.
- Current owner paid $16k; list at $50k implies a 212% gain — meaningful room to come down on a strong offer.
Risks & watch-outs
- Watch-outs: property tax is 4.2% of price; built in 1956 — expect roof / HVAC / electrical / plumbing capex.
Questions for the listing agent
- It's been on market 74 days. Have you received any prior offers? Is the seller open to a 6% concession, seller financing, or rate buy-down credit?
- Built in 1956 — when were the roof, HVAC, electrical panel, plumbing, and water heater last replaced?
- Property tax is high relative to price — has the assessment been appealed recently, and will the sale trigger a re-assessment?
- Any open or pending special assessments — roof, HVAC, plumbing, elevator, façade? What's the per-unit balance and payoff schedule, and is the seller paying it off at close or rolling it to the buyer?
- Why hasn't it sold? Are there any deal-killer items the seller is aware of (foundation, flood, title, zoning, code violations)?
- Is there a deadline driving the sale (1031 exchange, divorce, estate, relocation)? That informs how much negotiation room exists.
- Schools are A-rated — typically a magnet for longer-tenancy family renters. What's the average tenant stay here, and is there a school-zone premium baked into asking?
- What's the average days-on-market for RENTAL listings here right now (not sales)? A rising rental-DOM trend means longer vacancies and softer asking-rent achievability than the comps imply.
- What's the recent tenant-quality profile in this submarket — average credit score on applications, eviction rate, late-payment / NSF rate, and stable-employment percentage? A property-management company in the area should have these aggregated.
- How much new apartment / multifamily construction is in the pipeline within 1–3 miles? Heavy new supply (>2% of stock underway) typically softens rents 12–24 months out; light construction supports rent growth.
Investment metrics
- 1% rule
- 2.63% ✓
- Cap rate
- 20.23%
- Cash-on-cash
- 49.78%
- DSCR
- 3.22
- GRM
- 3.2
CMA / ARV
No comps found within radius.
Projected returns pro-forma
-3.0% appreciation · 7.63% rent growth · sell at horizon
- IRR
- 53.3%
- Equity multiple
- 3.53×
- Total profit
- $35,314
- Equity at exit
- $7,440
- IRR
- 60.5%
- Equity multiple
- 8.70×
- Total profit
- $107,522
- Equity at exit
- $4,314
Cash invested: $13,972 (down + closing). Projections, not guarantees.
Landlord ↔ Tenant lean methodology
- Overall (STATE)
- 62 Landlord-Friendly
- State Pennsylvania
- 62 Landlord-Friendly · EVEN
- County
- — inherits STATE
- City
- — inherits STATE
ZIP-level market 15235
- Home prices YoY
- -34.1%
- Rents YoY
- 7.6%
- Active inventory
- 129
- Price-to-rent
- 3.2×
Monthly cashflow live
- Estimated rent
- $1,311 high interval (Pro) →
- Mortgage (P&I)
- −$262
- Tax from tax record
- −$174 /mo · $2,087/yr
- Insurance
- −$21
- HOA
- −$0
- Vacancy / Maint / Mgmt
- −$275
- Net cashflow
- $580
Break-even live
Sensitivity live
| Price | -10% $608 | -5% $594 | +0% $580 | +5% $566 | +10% $551 |
|---|---|---|---|---|---|
| Rent | -10% $476 | -5% $528 | +0% $580 | +5% $631 | +10% $683 |
| Rate | -1.0pp $605 | -0.5pp $592 | base $580 | +0.5pp $567 | +1.0pp $554 |
UW: 25.0% down · 7.5% · 30yr · 1.5% tax · 5.0% vac · 8.0% maint · 8.0% mgmt
Financing live
Cash to close
- Down payment
- $12,475
- Closing costs
- $1,497
- Reserves months
- —
- Total cash needed
- —
Loan-product check · same deal, 3 products live
Conventional
25% down · 7.5% · 30yr
- Down + closing
- —
- Monthly P&I
- —
- Monthly cashflow
- —
- DSCR
- —
- Eligible?
- —
Personal DTI + credit; lowest rate.
DSCR
20% down · 8.5% · 30yr
- Down + closing
- —
- Monthly P&I
- —
- Monthly cashflow
- —
- DSCR
- —
- Eligible?
- —
No personal income docs; deal must DSCR.
Hard money
10% down · 12.0% · 12mo
- Down + closing
- —
- Monthly P&I
- —
- Monthly cashflow
- —
- DSCR
- —
- Eligible?
- —
Short-term bridge; refi at stabilization.
Rent comps 10 comps
| Address | Beds | Baths | Sqft | Rent | $/sqft | DOM | Units | Dist |
|---|---|---|---|---|---|---|---|---|
| 154 Collins Dr Pittsburgh, PA | 3.0 | 1.0 | 986 | $1,295 | $1.31 | 3d | 1 | 0.68mi |
| 279 Hazel Rd Pittsburgh, PA | 3.0 | 1.0 | 1080 | $1,732 | $1.60 | 45d | 1 | 0.84mi |
| 143 Oak Manor Pl Penn Hills, PA | 1.0 | 1.0 | 637 | $850 | $1.33 | 45d | 2 | 0.92mi |
| 261 Universal Rd Unit 261UNIV Pittsburgh, PA | 3.0 | 1.0 | 1100 | $1,225 | $1.11 | 4d | 1 | 0.94mi |
| 127 Stowe Dr Pittsburgh, PA | 3.0 | 1.0 | 948 | $1,495 | $1.58 | 23d | 1 | 1.14mi |
| 325 Poe Dr Pittsburgh, PA | 2.0 | 1.0 | 1056 | $1,599 | $1.51 | 45d | 1 | 1.16mi |
| 225 Alcoma Blvd Penn Hills, PA | 1.0–2.0 | 1.0–2.5 | 834 | $1,075 | $1.29 | 45d | 1 | 1.20mi |
| 6388 Saltsburg Rd Pittsburgh, PA | 2.0 | 1.5 | 875 | $1,300 | $1.49 | 4d | 1 | 1.21mi |
| 1160 Jefferson Rd Pittsburgh, PA | 3.0 | 1.0 | 1066 | $1,295 | $1.21 | 16d | 1 | 1.36mi |
| 600 Deborah Jane Dr Plum, PA | 1.0 | 1.0 | 600 | $799 | $1.33 | 45d | 1 | 1.45mi |
HOA detail condo
- Monthly dues
- $0 · $0/yr
- Assessments
- None detected in remarks — confirm with the listing agent.
Listing history 13 events
-
2026-05-21status Pending
-
2026-05-13historical Contingent
-
2026-05-08status Active
-
2026-02-11status Pending
-
2026-02-09historical Contingent
-
2026-01-28price $49,900
-
2026-01-20status Active
-
2026-01-16status Pending
-
2026-01-15historical Contingent
-
2026-01-09status Active
-
2026-01-08historical Contingent
-
2025-12-08$59,950 Active
-
1996-08-06soldstatus $16,000
ⓘ Source: listings_history table (triggers on properties + properties_extension) + one-shot
backfill from property_details.listing_events for pre-trigger history.
Tax reassessment forecast PA · Partial reset (capped growth)
- Current annual tax
- $2,087 · $174/mo
- Projected year-2 tax
- $2,087 · $174/mo
- Expected delta
- $0/yr ($0/mo · 0.0%)
ⓘ Screening estimate from a state-policy table — verify with the county assessor before closing.
Climate risk First Street
- Flood 1/10 Low FEMA zone X (unshaded) · 0% chance over 30 yrs
- Wildfire 1/10 Low
- Heat 3/10 Moderate 7 d/yr ≥96°F today · 17 d/yr by 30 yrs out
- Wind 2/10 Low 0% chance of damaging wind over 30 yrs
- Air quality 4/10 Moderate 5 unhealthy d/yr today · 7 by 30 yrs out
Nearby sold comps map
Loading sold comps map…
Walkable amenities ~0.75 mi
Loading nearby amenities…
Taxation est. · year 1
- Rental income
- $15,737
- − Mortgage interest
- −$2,795
- − Property taxes
- −$2,087
- − Insurance
- −$250
- − Repairs & maintenance
- −$1,259
- − Management
- −$1,259
- − Depreciation
- −$1,452
- Taxable income
- $6,636
- Est. tax owed @ 24.0%
- −$1,593
- After-tax cash flow
- $5,363/yr
For passive investors: Depreciation is non-cash, so a rental often shows a tax loss while cash-flowing — sheltering income. Rental losses are passive: they offset passive income freely, and up to $25,000/yr can offset ordinary (W-2) income if you actively participate and your MAGI is under $100k (phasing out to $0 by $150k); unused losses carry forward. On sale, claimed depreciation is recaptured at up to 25%, and gains may owe capital-gains tax (a 1031 exchange can defer both). Figures are a year-1 estimate at your 24.0% rate — not tax advice; consult a CPA.
Schools (NCES district)
- District
- Penn Hills SD
- NCES district ID
- 4218590
- Math proficiency
- 13% ▼ -6.00%
- Reading proficiency
- 24% ▼ -14.00%
- Median HH income
- $47,794
- Composite
- 16.42/100
- National rank
- #9192
- State rank
- #496 of 539 in PA
Livability — Monroeville
- Score
- 77/100
- State rank
- #358
- US rank
- #3140
Category grades
Schools grade is shown separately in the Schools card above.
Census & demographics
- County
- Allegheny County · 1,022,028 people
- City population
- 28,332
- Metro
- Pittsburgh, PA
- Population (ZIP)
- 33,951
- Household income
- $67,240
- Rent vs Own
- Severe rent burden
- 955.0
Population outlook (Allegheny County) Hauer SSP2
- Today (2025)
- 1,250,282 people
- By 2030
- 1,256,482 · +0.5%
- By 2040
- 1,256,318 · +0.5%
- By 2050
- 1,244,169 · -0.5%
- By 2075
- 1,197,693 · -4.2%
- By 2100
- 1,093,187 · -12.6%
Race, ethnicity, and origin ACS 2023
- Neighborhood character
- Diverse neighborhood (Simpson 0.58)
- Race & ethnicity
- White 51% Black 40% Two or more races 7% Hispanic / Latino 2%
- Common ancestry
- Romanian 5% Serbian 2% Slovak 1%
- Foreign-born
- 4% · Canada
- Languages at home
- 97% English-only · Other Indo-European 1% Spanish 1%
Political lean MEDSL · Allegheny
- 2024 margin
- Strong D (+20.3) · D 59.7% · R 39.4%
- 2008→2024 swing
- +4.8pp toward D · 2008: 15.5pp · 2024: 20.3pp
- All cycles
- 2024: D+20.3 2020: D+20.4 2016: D+16.4 2012: D+14.4 2008: D+15.5
Not yet ingested
- Civics
- —
Market trends
- HPI YoY
- ▼ -121.68%
- Current HPI
- 235.4861
- Rent YoY
- ▲ 7.63%
- Metro
- Pittsburgh, PA
- State GDP YoY
- ▲ 1.68%
- F500 in state
- 34
Industry mix (Fortune 500 HQ in PA)
| Industry | F500 HQs | Revenue |
|---|---|---|
| Healthcare | 2 | $309B |
|
||
| Insurance | 2 | $27B |
|
||
| Telecommunications / Media | 1 | $124B |
|
||
| Industrial Distribution | 1 | $22B |
|
||
| Financial Services | 1 | $20B |
|
||
| Chemicals / Materials | 1 | $18B |
|
||
Price history
+211.9% since first listed13 events — show timeline
- 2026-05-21 Pending — West Penn MLS
- 2026-05-13 Contingent — West Penn MLS
- 2026-05-08 Relisted — West Penn MLS
- 2026-02-11 Pending — West Penn MLS
- 2026-02-09 Contingent — West Penn MLS
- 2026-01-28 Price Changed $49,900 West Penn MLS
- 2026-01-20 Relisted — West Penn MLS
- 2026-01-16 Pending — West Penn MLS
- 2026-01-15 Contingent — West Penn MLS
- 2026-01-09 Relisted — West Penn MLS
- 2026-01-08 Contingent — West Penn MLS
- 2025-12-08 Listed $59,950 West Penn MLS
- 1996-08-06 Sold (Public Records) $16,000 Public Records
Property tax history
+6.2%/yrLatest (2026): $2,087 · +63.4% YoY. Source: county tax records.
Cash-flow waterfall
monthlySold comps — $/sqft
last 12 mo · ≤1 miLoading sold comps…