111 S 7th Ave · Munday, TX
Flood risk No data
- FEMA flood zone
- —
- Chance of flooding over 30 yrs
- —
- Est. flood insurance / yr
- —
Fire risk No data
- Est. fire insurance / yr
- —
Heat risk No data
- Hot days now (above threshold)
- —
- Hot days in 30 yrs
- —
Wind risk No data
- Chance of severe wind over 30 yrs
- —
Air-quality risk No data
- Unhealthy air days now
- —
- Unhealthy air days in 30 yrs
- —
Risk factors via First Street. Map © Google.
Why this score? — see what drove the D+ grade
The composite is a weighted blend of 9 inputs, each scored 0–100. Each bar is that input's sub-score; the figure is the points it added to the 100-point composite (weight × sub-score).
- Cash flow +15.0/30.0
- ARV discount +7.5/15.0
- Appreciation +5.5/10.0
- 1% rule +5.0/10.0
- DSCR +5.0/10.0
- Schools +3.6/10.0
- Livability +3.3/5.0
- Rent growth +2.5/5.0
- Condition / age +2.5/5.0
$25,000
🖨 Deal sheet 📄 Offer letter ✓ Due diligence
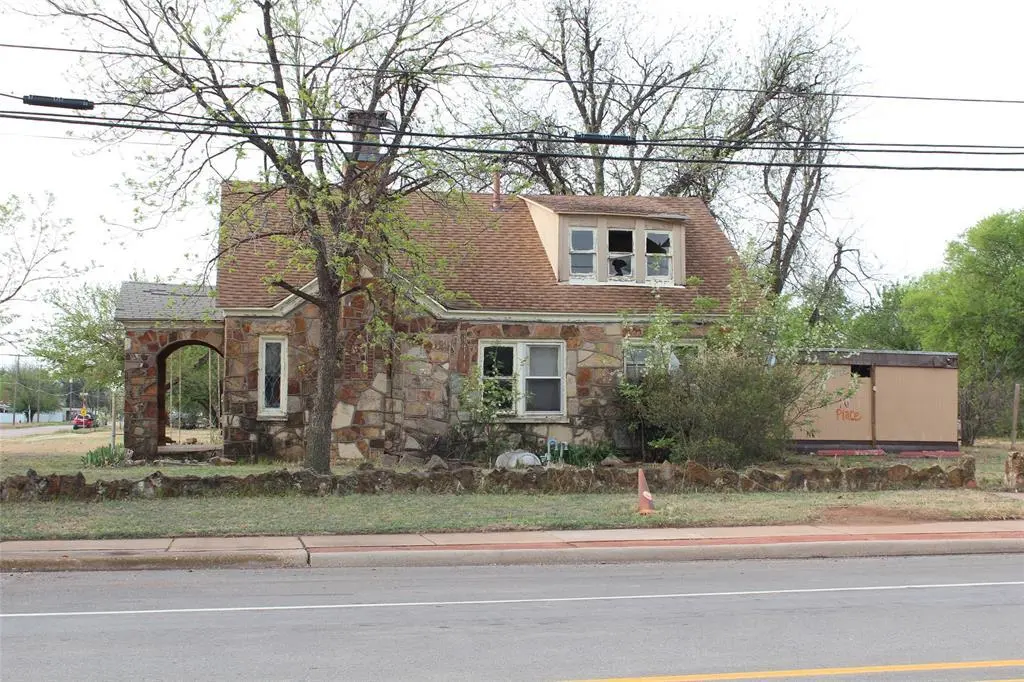
Listing remarks
Two-story stone home full of character and opportunity, ready to be restored to its former glory. This spacious property features 6 bedrooms, 2 bathrooms, a kitchen, and a central living area, offering ample room for a variety of uses. The home showcases unique and artistic stonework details that highlight its solid construction and timeless appeal. Situated in a great location, the property also includes a storage building. With its size and layout, this home presents strong potential as an investment property, including use as a rental to accommodate the area’s transient workforce. Property is in need of repairs and updates and is being sold as-is. Ideal for investors or buyers look
Key facts
- Stone home
- Storage building
- Great location
Tags
Neighborhood map
What this means for you Summary
Snapshot
- This is a 6-bed/2.0-bath single-family listed at $25k.
Deal economics
- At list price, monthly cash flow is $648 ($8k/yr) — positive.
- The deal already cash-flows at list — no discount required.
- Meets the 1% rule at list price ($1k rent vs $25k).
Location & tenants
- Location reads 66/100 on livability (#626 in TX) — a middle-class / working-renter tenant base. Strengths: cost of living A+, crime A-, housing B+; Watch: health & safety C-, amenities F, commute F.
- Munday CISD (rural): math 43% / reading 44% proficiency, ranked #326 of 826 in TX (top 40%) — families likely to look elsewhere, expect single-tenant / working-renter base with shorter leases.
- Zoned schools: Munday El (math 57% / reading 52%, grade C, #621 of 4,322 statewide, top 15%, 216 students, 58% FRL) — zoned schools at 58% FRL track the district average.
- Market conditions: 18 active listings in the ZIP.
Forward outlook
- In year one you build about $428 of equity ($173 loan paydown + $255 appreciation (1.0% local appreciation)).
- Knox County population projected at +21% by 2050 — long-run rental-demand tailwind backs the buy-and-hold thesis.
- At projected returns (1.0% appreciation + 3.0% rent growth), your $7k cash investment doubles in ~1 year — after that, you're playing with house money.
Negotiation context
- Only 11 days on market — expect competitive offers; lowballing is unlikely to land.
Risks & watch-outs
- Watch-outs: property tax is 4.0% of price; built in 1950 — expect roof / HVAC / electrical / plumbing capex.
Questions for the listing agent
- Built in 1950 — when were the roof, HVAC, electrical panel, plumbing, and water heater last replaced?
- Property tax is high relative to price — has the assessment been appealed recently, and will the sale trigger a re-assessment?
- Is there a deadline driving the sale (1031 exchange, divorce, estate, relocation)? That informs how much negotiation room exists.
- Schools are D-rated, which usually means shorter tenancies and higher turnover. Who's the typical renter profile here, and what's been the actual vacancy rate?
- The area grade is low — what's the realistic commute time and amenity access for the typical tenant pool here? Any planned neighborhood developments (good or bad) we should know about?
- What's the average days-on-market for RENTAL listings here right now (not sales)? A rising rental-DOM trend means longer vacancies and softer asking-rent achievability than the comps imply.
- What's the recent tenant-quality profile in this submarket — average credit score on applications, eviction rate, late-payment / NSF rate, and stable-employment percentage? A property-management company in the area should have these aggregated.
- How much new for-sale + rental construction is in the pipeline within 1–3 miles? Heavy new supply typically softens prices + rents 12–24 months out; constrained supply supports both.
Investment metrics
- 1% rule
- 4.42% ✓
- Cap rate
- 37.38%
- Cash-on-cash
- 111.02%
- DSCR
- 5.94
- GRM
- 1.9
CMA / ARV
No comps found within radius.
Projected returns pro-forma
1.02% appreciation · 3.0% rent growth · sell at horizon
- IRR
- —
- Equity multiple
- 6.97×
- Total profit
- $41,787
- Equity at exit
- $8,560
- IRR
- —
- Equity multiple
- 14.49×
- Total profit
- $94,421
- Equity at exit
- $11,395
Cash invested: $7,000 (down + closing). Projections, not guarantees.
Landlord ↔ Tenant lean methodology
- Overall (STATE)
- 87 Strongly Landlord-Friendly
- State Texas
- 87 Strongly Landlord-Friendly · R+5
- County
- — inherits STATE
- City
- — inherits STATE
ZIP-level market 76371
- Home prices YoY
- 1.0%
- Active inventory
- 18
- Price-to-rent
- 1.9×
Monthly cashflow live
- Estimated rent
- $1,104 medium interval (Pro) →
- Mortgage (P&I)
- −$131
- Tax from tax record
- −$83 /mo · $999/yr
- Insurance
- −$10
- HOA
- −$0
- Vacancy / Maint / Mgmt
- −$232
- Net cashflow
- $648
Break-even live
UW: 25.0% down · 7.5% · 30yr · 1.5% tax · 5.0% vac · 8.0% maint · 8.0% mgmt
Financing live
Cash to close
- Down payment
- $6,250
- Closing costs
- $750
- Reserves months
- —
- Total cash needed
- —
Loan-product check · same deal, 3 products live
Conventional
25% down · 7.5% · 30yr
- Down + closing
- —
- Monthly P&I
- —
- Monthly cashflow
- —
- DSCR
- —
- Eligible?
- —
Personal DTI + credit; lowest rate.
DSCR
20% down · 8.5% · 30yr
- Down + closing
- —
- Monthly P&I
- —
- Monthly cashflow
- —
- DSCR
- —
- Eligible?
- —
No personal income docs; deal must DSCR.
Hard money
10% down · 12.0% · 12mo
- Down + closing
- —
- Monthly P&I
- —
- Monthly cashflow
- —
- DSCR
- —
- Eligible?
- —
Short-term bridge; refi at stabilization.
Listing history 3 events
-
2026-04-17status Pending
-
2026-04-06$25,000 Active
-
2002-07-17soldstatus
ⓘ Source: listings_history table (triggers on properties + properties_extension) + one-shot
backfill from property_details.listing_events for pre-trigger history.
Tax reassessment forecast TX · Resets to sale price
- Current annual tax
- $999 · $83/mo
- Projected year-2 tax
- $999 · $83/mo
- Expected delta
- $0/yr ($0/mo · 0.0%)
ⓘ Screening estimate from a state-policy table — verify with the county assessor before closing.
Nearby sold comps map
Loading sold comps map…
Walkable amenities ~0.75 mi
Loading nearby amenities…
Taxation est. · year 1
- Rental income
- $13,252
- − Mortgage interest
- −$1,400
- − Property taxes
- −$999
- − Insurance
- −$125
- − Repairs & maintenance
- −$1,060
- − Management
- −$1,060
- − Depreciation
- −$727
- Taxable income
- $7,879
- Est. tax owed @ 24.0%
- −$1,891
- After-tax cash flow
- $5,880/yr
For passive investors: Depreciation is non-cash, so a rental often shows a tax loss while cash-flowing — sheltering income. Rental losses are passive: they offset passive income freely, and up to $25,000/yr can offset ordinary (W-2) income if you actively participate and your MAGI is under $100k (phasing out to $0 by $150k); unused losses carry forward. On sale, claimed depreciation is recaptured at up to 25%, and gains may owe capital-gains tax (a 1031 exchange can defer both). Figures are a year-1 estimate at your 24.0% rate — not tax advice; consult a CPA.
Schools (NCES district)
- District
- Munday CISD
- NCES district ID
- 4831970
- Math proficiency
- 43% ▼ -2.00%
- Reading proficiency
- 44% ▲ 9.00%
- Median HH income
- $37,618
- Composite
- 36.22/100
- National rank
- #4727
- State rank
- #326 of 826 in TX
Livability — Munday
- Score
- 66/100
- State rank
- #626
- US rank
- #11937
Category grades
Schools grade is shown separately in the Schools card above.
Census & demographics
- Census place
- Munday, TX
- Population (ZIP)
- 1,801
Population outlook (Knox County) Hauer SSP2
- Today (2025)
- 4,136 people
- By 2030
- 4,291 · +3.7%
- By 2040
- 4,655 · +12.5%
- By 2050
- 5,005 · +21.0%
- By 2075
- 6,051 · +46.3%
- By 2100
- 6,427 · +55.4%
Race, ethnicity, and origin ACS 2023
- Neighborhood character
- Majority White (54%)
- Race & ethnicity
- White 54% Hispanic / Latino 40% Two or more races 22%
- Hispanic origin (detail)
- Mexican 38%
- Common ancestry
- Subsaharan African 4% Iranian 2% Slovak 1%
- Foreign-born
- 9% · Canada
- Languages at home
- 74% English-only · Spanish 26%
Political lean MEDSL · Knox
- 2024 margin
- Solid R (+68.5) · D 15.6% · R 84.0%
- 2008→2024 swing
- -23.2pp toward R · 2008: -45.2pp · 2024: -68.5pp
- All cycles
- 2024: R+68.5 2020: R+62.8 2016: R+61.2 2012: R+54.8 2008: R+45.2
Not yet ingested
- Civics
- —
Market trends
- HPI YoY
- ▲ 1.02%
- Current HPI
- 103.0505
- Rent YoY
- —
- Metro
- —
- State GDP YoY
- ▲ 3.95%
- F500 in state
- 110
Industry mix (Fortune 500 HQ in TX)
| Industry | F500 HQs | Revenue |
|---|---|---|
| Energy | 16 | $1,198B |
|
||
| Technology | 5 | $198B |
|
||
| Engineering / Construction | 4 | $72B |
|
||
| Energy Services | 3 | $60B |
|
||
| Utilities | 3 | $41B |
|
||
| Healthcare | 2 | $330B |
|
||
Price history
3 events — show timeline
- 2026-04-17 Pending — NTREIS
- 2026-04-06 Listed $25,000 NTREIS
- 2002-07-17 Sold (Public Records) — Public Records
Property tax history
+4.6%/yrLatest (2025): $999 · +8.2% YoY. Source: county tax records.
Cash-flow waterfall
monthlySold comps — $/sqft
last 12 mo · ≤1 miLoading sold comps…