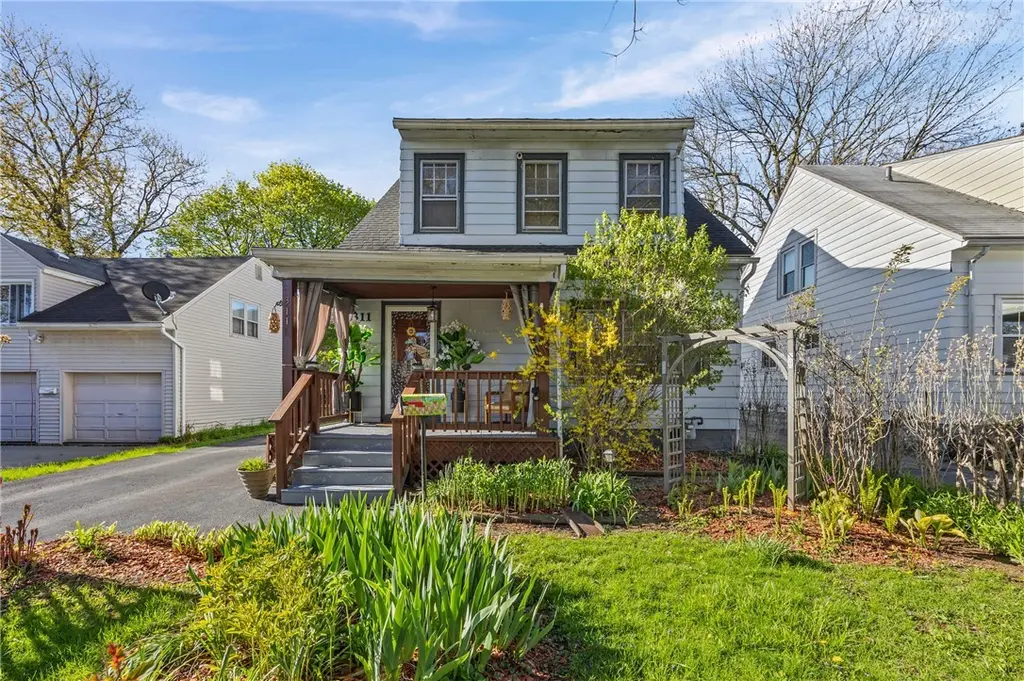
311 Steko Ave · Rochester, NY
Flood risk 1/10 · Minimal
- FEMA flood zone
- X (unshaded)
- Chance of flooding over 30 yrs
- 0.0%
- Est. flood insurance / yr
- $473 – $860
Fire risk 4/10 · Minor
- Est. fire insurance / yr
- $691 – $1,283
Heat risk 2/10 · Minimal
- Hot days now (above 95°F)
- 7 days/yr
- Hot days in 30 yrs
- 15 days/yr
Wind risk 1/10 · Minimal
- Chance of severe wind over 30 yrs
- —
Air-quality risk 2/10 · Minimal
- Unhealthy air days now
- 1 days/yr
- Unhealthy air days in 30 yrs
- 2 days/yr
Risk factors via First Street. Map © Google.
Why this score? — see what drove the B grade
The composite is a weighted blend of 9 inputs, each scored 0–100. Each bar is that input's sub-score; the figure is the points it added to the 100-point composite (weight × sub-score).
- Cash flow +29.1/30.0
- ARV discount +15.0/15.0
- DSCR +10.0/10.0
- 1% rule +7.3/10.0
- Livability +3.8/5.0
- Rent growth +2.5/5.0
- Condition / age +2.5/5.0
- Schools +1.9/10.0
- Appreciation +0.0/10.0
$149,900
🖨 Deal sheet (PDF) 📄 Offer letter ✓ Due diligence
Listing remarks
Welcome home to this charming 4-bedroom, 2-full bath Cape Cod, perfectly tucked away on a quiet dead-end street. Enjoy true peace of mind with a 5-year-young roof and a high-efficiency tankless water heater (2024). The main level offers a nice sized living room, formal dining room, 1 full bath and a smaller bedroom perfect for guest room, office space, or craft room. Kitchen has glass sliding doors that bring you to a secure fully fenced in yard. Upstairs you will find three large bedrooms with a full bath. Spacious, private, and meticulously maintained. A must-see!" Delayed Negotiations on file for May 5th @2pm
Key facts
- 4,720 sq ft lot
- 2 garage spots
- Built 1937
Property features AI
Exterior
- Parking: Detached garage with garage door opener; 2 garage spaces
- Utilities: Public water connected; Sewer connected
- Home design: Single-story; Resale property
- Construction: Aluminum siding; Vinyl siding; Spray foam insulation; Block foundation; Full basement with sump pump
- Exterior features: Awning(s); Blacktop driveway; Fully fenced yard; Open porch
Interior
- Kitchen: Gas oven; Gas range; Range hood; Refrigerator; Exhaust fan
- Bedrooms: 1 main-level bedroom
- Flooring: Carpet; Hardwood; Laminate; Vinyl; Varied flooring
- Bathrooms: 2 full bathrooms; 1 main-level bathroom
- Heating & cooling: Gas heating; Hot water heating; Radiator heat
- Interior features: Sliding doors; Separate/formal dining room; Combined living and dining room; Sliding glass door(s)
- Laundry & utility: Washer; Dryer; Laundry located in basement
Neighborhood map
What this means for you Summary
Snapshot
- This is a 4-bed/2.0-bath single-family listed at $150k.
Deal economics
- At list price, monthly cash flow is $516 ($6k/yr) — positive.
- The deal already cash-flows at list — no discount required.
- Meets the 1% rule at list price ($2k rent vs $150k).
Location & tenants
- Location reads 76/100 on livability (#222 in NY, #3,482 nationally) — a middle-class / working-renter tenant base. Strengths: commute A+, cost of living A+, housing A+; Watch: schools D+, crime F, employment F.
- Rochester City School District (urban): math 21% / reading 26% proficiency, ranked #589 of 590 in NY (top 100%) — low school quality limits family demand, transient renter base, plan for 1-2y turnover; 82% free/reduced lunch — lower-income household profile, screen leases tightly.
- Market conditions: 74 active listings in the ZIP; 8 comparable units currently listed for rent nearby; rentals leasing fast (median 11d on market — plan ~1-2 weeks tenant-placement turnaround); 1,169 units permitted in Monroe County in 2024 (591 in 5+ unit buildings).
- This rent runs 43% of the median local income ($51k/yr) — at the standard rent-burdened threshold; future hikes will face affordability resistance.
Forward outlook
- Local home prices are declining (-3.0%/yr); year-one equity from $1k of loan paydown is wiped out by about $4k of value loss. Plan a longer hold.
- Monroe County population projected to shrink 6% by 2050 — rents likely to lag national; underwrite the cash flow, not the appreciation.
- At projected returns (-3.0% appreciation + 3.0% rent growth), your $42k cash investment doubles in ~8 years — after that, you're playing with house money.
Negotiation context
- Only 9 days on market — expect competitive offers; lowballing is unlikely to land.
- Current owner paid $60k; list at $150k implies a 150% gain — meaningful room to come down on a strong offer.
Risks & watch-outs
- Watch-outs: built in 1937 — expect roof / HVAC / electrical / plumbing capex.
Questions for the listing agent
- Built in 1937 — when were the roof, HVAC, electrical panel, plumbing, and water heater last replaced?
- Is there a deadline driving the sale (1031 exchange, divorce, estate, relocation)? That informs how much negotiation room exists.
- Schools are D-rated, which usually means shorter tenancies and higher turnover. Who's the typical renter profile here, and what's been the actual vacancy rate?
- Crime grade is F in this area — have there been break-ins, vandalism, or insurance claims at this property in the last 3 years? What carrier currently insures it and at what premium?
- What's the average days-on-market for RENTAL listings here right now (not sales)? A rising rental-DOM trend means longer vacancies and softer asking-rent achievability than the comps imply.
- What's the recent tenant-quality profile in this submarket — average credit score on applications, eviction rate, late-payment / NSF rate, and stable-employment percentage? A property-management company in the area should have these aggregated.
- How much new for-sale + rental construction is in the pipeline within 1–3 miles? Heavy new supply typically softens prices + rents 12–24 months out; constrained supply supports both.
Investment metrics
- 1% rule
- 1.23% ✓
- Cap rate
- 10.43%
- Cash-on-cash
- 14.76%
- DSCR
- 1.66
- GRM
- 6.8
CMA / ARV
- ARV (median comp)
- $185,235
- List price
- $149,900
- Delta
- -19.08%
- Verdict
- UNDERPRICED
- Comps
- 20 within 1.0 mi
Show comp detail 12 sales within ~0.75 mi
| Address | Dist | Beds/Ba | Sqft | Sold | Price | $/sf | Match |
|---|---|---|---|---|---|---|---|
| 297 Knickerbocker Ave | 0.20mi | 4/1.5 | 1,618 (+7%) | 1mo | $202,500 | $125 | 76 |
| 534 Ramona St | 0.33mi | 4/2.0 | 1,575 (+4%) | 6mo | $185,000 | $117 | 72 |
| 551 Magee Ave | 0.50mi | 4/1.5 | 1,572 (+4%) | 3mo | $166,500 | $106 | 65 |
| 842 Flower City Park | 0.27mi | 3/1.5 (-1) | 1,300 (-14%) | 1mo | $116,000 | $89 | 56 |
| 621 Clay Ave | 0.38mi | 3/1.5 (-1) | 1,334 (-12%) | 0mo | $200,000 | $150 | 55 |
| 19 Mac Arthur Rd | 0.61mi | 4/1.0 | 1,416 (-6%) | 2mo | $183,000 | $129 | 55 |
| 22 Mac Arthur Rd | 0.58mi | 4/2.0 | 1,332 (-12%) | 1mo | $242,000 | $182 | 52 |
| 262 Pullman Ave | 0.59mi | 4/1.5 | 1,350 (-11%) | 4mo | $159,100 | $118 | 49 |
| 285 Magee Ave | 0.69mi | 4/1.5 | 1,620 (+7%) | 6mo | $80,000 | $49 | 49 |
| 273 Electric Ave | 0.53mi | 3/1.5 (-1) | 1,327 (-12%) | 3mo | $150,000 | $113 | 45 |
| 571 Flower City Park | 0.47mi | 3/1.5 (-1) | 1,302 (-14%) | 4mo | $100,000 | $77 | 44 |
| 18 Avis St | 0.71mi | 3/1.5 (-1) | 1,703 (+13%) | 4mo | $185,000 | $109 | 36 |
Match score weights: distance 35% · size 25% · config 20% · recency 20%. Top-matched comps best support the ARV.
Projected returns pro-forma
-3.0% appreciation · 3.0% rent growth · sell at horizon
- IRR
- 5.3%
- Equity multiple
- 1.20×
- Total profit
- $8,562
- Equity at exit
- $22,351
- IRR
- 14.7%
- Equity multiple
- 2.18×
- Total profit
- $49,665
- Equity at exit
- $12,961
Cash invested: $41,972 (down + closing). Projections, not guarantees.
Landlord ↔ Tenant lean methodology
- Overall (STATE)
- 15 Strongly Tenant-Friendly
- State New York
- 15 Strongly Tenant-Friendly · D+10
- County
- — inherits STATE
- City
- — inherits STATE
ZIP-level market 14615
- Home prices YoY
- -11.7%
- Active inventory
- 74
- Price-to-rent
- 6.8×
Monthly cashflow live
- Estimated rent
- $1,839 high interval (Pro) →
- Mortgage (P&I)
- −$786
- Tax from tax record
- −$88 /mo · $1,051/yr
- Insurance
- −$62
- HOA
- −$0
- Vacancy / Maint / Mgmt
- −$386
- Net cashflow
- $516
Break-even live
Sensitivity live
| Price | -10% $601 | -5% $559 | +0% $516 | +5% $474 | +10% $431 |
|---|---|---|---|---|---|
| Rent | -10% $371 | -5% $444 | +0% $516 | +5% $589 | +10% $662 |
| Rate | -1.0pp $592 | -0.5pp $554 | base $516 | +0.5pp $477 | +1.0pp $438 |
UW: 25.0% down · 7.5% · 30yr · 1.5% tax · 5.0% vac · 8.0% maint · 8.0% mgmt
Financing live
Cash to close
- Down payment
- $37,475
- Closing costs
- $4,497
- Reserves months
- —
- Total cash needed
- —
Loan-product check · same deal, 3 products live
Conventional
25% down · 7.5% · 30yr
- Down + closing
- —
- Monthly P&I
- —
- Monthly cashflow
- —
- DSCR
- —
- Eligible?
- —
Personal DTI + credit; lowest rate.
DSCR
20% down · 8.5% · 30yr
- Down + closing
- —
- Monthly P&I
- —
- Monthly cashflow
- —
- DSCR
- —
- Eligible?
- —
No personal income docs; deal must DSCR.
Hard money
10% down · 12.0% · 12mo
- Down + closing
- —
- Monthly P&I
- —
- Monthly cashflow
- —
- DSCR
- —
- Eligible?
- —
Short-term bridge; refi at stabilization.
Rent comps 8 comps
| Address | Beds | Baths | Sqft | Rent | $/sqft | DOM | Units | Dist |
|---|---|---|---|---|---|---|---|---|
| 768 Flower City Park Rochester, NY | 3.0 | 1.0 | 1995 | $1,995 | $1.00 | 11d | 1 | 0.29mi |
| 287 Electric Ave Rochester, NY | 3.0 | 1.5 | 1297 | $1,500 | $1.16 | 3d | 1 | 0.53mi |
| 248 Flower City Park Rochester, NY | 3.0 | 1.0 | 1350 | $1,800 | $1.33 | 4d | 1 | 0.88mi |
| 235 Flower City Park Rochester, NY | 3.0 | 1.0 | 2000 | $1,360 | $0.68 | 44d | 1 | 0.91mi |
| 98 Pierpont St Rochester, NY | 3.0 | 1.0 | 1973 | $1,295 | $0.66 | 44d | 1 | 1.22mi |
| 1016 Lake Ave Unit 1 Rochester, NY | 3.0 | 1.0 | 1300 | $1,600 | $1.23 | 44d | 1 | 1.24mi |
| 60 Grand Teton St Greece, NY | 2.0–3.0 | 2.0 | 1833 | $2,673 | $1.46 | 3d | 3 | 1.24mi |
| 327 Glenwood Ave Rochester, NY | 3.0 | 1.0 | 2012 | $1,690 | $0.84 | 3d | 1 | 1.49mi |
Listing history 4 events
-
2026-05-08status Pending 624-char remark
-
2026-05-06historical Active Under Contract 624-char remark
-
2026-04-29$149,900 Active 624-char remark
-
1997-12-31soldstatus $60,000
ⓘ Source: listings_history table (triggers on properties + properties_extension) + one-shot
backfill from property_details.listing_events for pre-trigger history.
Tax reassessment forecast NY · Partial reset (capped growth)
- Current annual tax
- $1,051 · $88/mo
- Projected year-2 tax
- $1,792 · $149/mo
- Expected delta
- +$741/yr (+$62/mo · 70.5%)
ⓘ Screening estimate from a state-policy table — verify with the county assessor before closing.
Climate risk First Street
- Flood 1/10 Low FEMA zone X (unshaded) · 0% chance over 30 yrs
- Wildfire 4/10 Moderate
- Heat 2/10 Low 7 d/yr ≥95°F today · 15 d/yr by 30 yrs out
- Wind 1/10 Low
- Air quality 2/10 Low 1 unhealthy d/yr today · 2 by 30 yrs out
Nearby sold comps map
Loading sold comps map…
Walkable amenities ~0.75 mi
Loading nearby amenities…
Taxation est. · year 1
- Rental income
- $22,063
- − Mortgage interest
- −$8,397
- − Property taxes
- −$1,051
- − Insurance
- −$750
- − Repairs & maintenance
- −$1,765
- − Management
- −$1,765
- − Depreciation
- −$4,361
- Taxable income
- $3,975
- Est. tax owed @ 24.0%
- −$954
- After-tax cash flow
- $5,242/yr
For passive investors: Depreciation is non-cash, so a rental often shows a tax loss while cash-flowing — sheltering income. Rental losses are passive: they offset passive income freely, and up to $25,000/yr can offset ordinary (W-2) income if you actively participate and your MAGI is under $100k (phasing out to $0 by $150k); unused losses carry forward. On sale, claimed depreciation is recaptured at up to 25%, and gains may owe capital-gains tax (a 1031 exchange can defer both). Figures are a year-1 estimate at your 24.0% rate — not tax advice; consult a CPA.
Schools (NCES district)
- District
- Rochester City School District
- NCES district ID
- 3624750
- Math proficiency
- 21% ▬ 0.00%
- Reading proficiency
- 26% ▲ 4.00%
- Median HH income
- $30,923
- Composite
- 18.98/100
- National rank
- #8850
- State rank
- #589 of 590 in NY
Livability — Rochester
- Score
- 76/100
- State rank
- #222
- US rank
- #3482
Category grades
Schools grade is shown separately in the Schools card above.
Census & demographics
- Census place
- Rochester, NY
- County
- Monroe County · 674,131 people
- City population
- 432,803
- Metro
- Rochester, NY
- Population (ZIP)
- 17,884
- Household income
- $51,262
- Rent vs Own
- Severe rent burden
- 1245.0
Population outlook (Monroe County) Hauer SSP2
- Today (2025)
- 759,460 people
- By 2030
- 757,154 · -0.3%
- By 2040
- 740,644 · -2.5%
- By 2050
- 714,443 · -5.9%
- By 2075
- 645,883 · -15.0%
- By 2100
- 547,084 · -28.0%
Race, ethnicity, and origin ACS 2023
- Neighborhood character
- Diverse neighborhood (Simpson 0.68)
- Race & ethnicity
- White 45% Black 27% Hispanic / Latino 20% Two or more races 9% Asian 3%
- Hispanic origin (detail)
- Puerto Rican 16% Cuban 2%
- Common ancestry
- Arab 3% Romanian 2% Subsaharan African 2%
- Foreign-born
- 10% · Canada, India, Vietnam
- Languages at home
- 81% English-only · Spanish 11% Arabic 2% Other Indo-European 2%
Political lean MEDSL · Monroe
- 2024 margin
- D (+19.1) · D 59.5% · R 40.5%
- 2008→2024 swing
- +1.4pp toward D · 2008: 17.7pp · 2024: 19.1pp
- All cycles
- 2024: D+19.1 2020: D+21.0 2016: D+14.1 2012: D+17.4 2008: D+17.7
Not yet ingested
- Civics
- —
Market trends
- HPI YoY
- ▼ -31.81%
- Current HPI
- 240.6896
- Rent YoY
- —
- Metro
- Rochester, NY
- State GDP YoY
- ▲ 2.60%
- F500 in state
- 92
Industry mix (Fortune 500 HQ in NY)
| Industry | F500 HQs | Revenue |
|---|---|---|
| Financial Services | 10 | $950B |
|
||
| Consumer Goods | 9 | $162B |
|
||
| Insurance | 4 | $225B |
|
||
| Telecommunications | 2 | $144B |
|
||
| Pharmaceuticals | 2 | $112B |
|
||
| Media / Entertainment | 2 | $69B |
|
||
Price history
+149.8% since first listed4 events — show timeline
- 2026-05-08 Pending — UNYREIS
- 2026-05-06 Contingent — UNYREIS
- 2026-04-29 Listed $149,900 UNYREIS
- 1997-12-31 Sold (Public Records) $60,000 Public Records
Property tax history
+2.4%/yrLatest (2025): $1,051 · -1.7% YoY. Source: county tax records.
Cash-flow waterfall
monthlySold comps — $/sqft
last 12 mo · ≤1 miLoading sold comps…