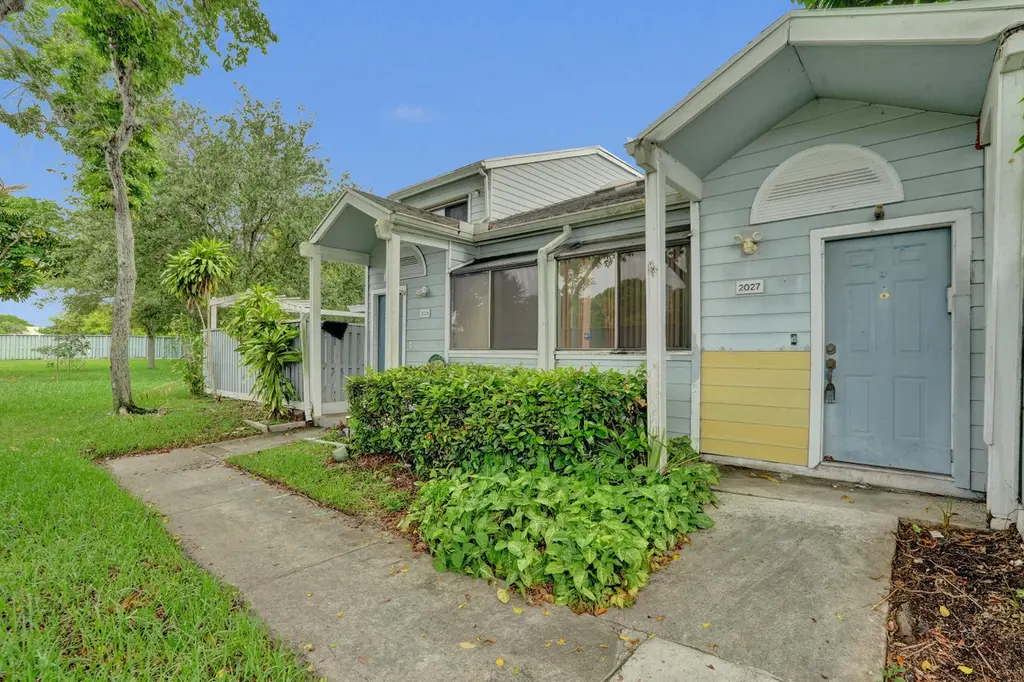
2027 Winners Cir · North Lauderdale, FL
Flood risk 1/10 · Minimal
- FEMA flood zone
- X (shaded)
- Chance of flooding over 30 yrs
- 0.0%
- Est. flood insurance / yr
- $507 – $1,088
Fire risk 1/10 · Minimal
- Est. fire insurance / yr
- $947 – $1,759
Heat risk 9/10 · Severe
- Hot days now (above 106°F)
- 6 days/yr
- Hot days in 30 yrs
- 20 days/yr
Wind risk 10/10 · Severe
- Chance of severe wind over 30 yrs
- 99.0%
Air-quality risk 3/10 · Minor
- Unhealthy air days now
- 3 days/yr
- Unhealthy air days in 30 yrs
- 3 days/yr
Risk factors via First Street. Map © Google.
Why this score? — see what drove the C+ grade
The composite is a weighted blend of 9 inputs, each scored 0–100. Each bar is that input's sub-score; the figure is the points it added to the 100-point composite (weight × sub-score).
- Cash flow +22.3/30.0
- ARV discount +15.0/15.0
- DSCR +7.1/10.0
- 1% rule +6.5/10.0
- Schools +4.1/10.0
- Livability +3.8/5.0
- Condition / age +2.5/5.0
- Rent growth +2.3/5.0
- Appreciation +0.0/10.0
$199,000
🖨 Deal sheet 📄 Offer letter ✓ Due diligence
Listing remarks
Investor Special! Priced below market value. Don't miss this opportunity to secure this 2-bedroom, 2-bath townhome in North Lauderdale. This spacious townhome offers a flexible layout with one bedroom on the main level and a loft area that leads to the private upstairs primary suite. The primary bedroom has access to a private balcony/patio. This home is a true blank canvas for investors or buyers looking to renovate and add value. Located in a pet-friendly community with a pool and tennis courts, and a convenient location to shopping and highways.
Key facts
- Private balcony
- Flexible layout
- Tennis courts
Tags
Property features AI
Finance
- Financial info: Pets allowed with breed restrictions
- HOA & community: Monthly HOA of $270; HOA covers grounds maintenance, common areas, and legal/accounting
Exterior
- Parking: Two parking spaces; Concrete, guest and open parking
- Security: Smoke detector(s)
- Utilities: Public water; Public sewer; Cable available
- Home design: Townhouse; Two stories; North-facing; Resale property
- Construction: Block construction; Shingle roof; Assessor-reported living area
- Exterior features: Not waterfront; Maintained community
Interior
- Kitchen: Dishwasher; Electric range; Refrigerator
- Bedrooms: One main-level bedroom
- Flooring: Carpet; Tile; Wood
- Bathrooms: Two full bathrooms; One bathroom on the main level
- Heating & cooling: Heat pump heating; Ceiling fans; Ductless cooling; Heat pump cooling
- Interior features: High ceilings; Vaulted ceilings; Skylight(s)
Neighborhood map
What this means for you Summary
Snapshot
- This is a 2-bed/2.0-bath townhouse listed at $199k.
Deal economics
- At list price, monthly cash flow is $327 ($4k/yr) — positive.
- The deal already cash-flows at list — no discount required.
- Meets the 1% rule at list price ($2k rent vs $199k).
- Cap rate 8.3% vs local median 4.3% in North Lauderdale — top-decile yield for the area; either an underpriced asset or a hidden risk that comps aren't pricing in. Stress-test before assuming the spread holds.
Location & tenants
- Location reads 76/100 on livability (#230 in FL, #3,635 nationally) — a middle-class / working-renter tenant base. Strengths: housing A+, health & safety A+, cost of living A; Watch: commute C-, employment D, amenities F.
- Broward (suburban): math 42% / reading 53% proficiency, ranked #46 of 73 in FL (top 63%) — families likely to look elsewhere, expect single-tenant / working-renter base with shorter leases.
- Zoned schools: Broadview Elementary School (math 29% / reading 38%, grade F, #1,758 of 2,144 statewide, top 83%, 742 students, 86% FRL); Lauderdale Lakes Middle School (math 21% / reading 26%, grade F, #536 of 571 statewide, top 95%, 816 students, 79% FRL); Boyd H. Anderson High School (math 10% / reading 14%, grade F, #622 of 667 statewide, top 93%, 2,038 students, 72% FRL) — zoned schools average 79% FRL vs 51% district-wide (28 pts higher); higher-poverty schools than district average — tighter screening recommended.
- Zoned-school proficiency averages 23% at this address vs 48% district-wide (-24 pts) — the specific schools serving this property underperform the Broward average; the district grade overstates school quality for this exact location.
- Market conditions: Rents soft (-0.7%/yr); 298 active listings in the ZIP; 40 comparable units currently listed for rent nearby; rentals at typical pace (median 25d on market — plan ~3-4 weeks tenant-placement turnaround); 2,111 units permitted in Broward County in 2024 (1,265 in 5+ unit buildings).
- This rent runs 43% of the median local income ($64k/yr) — at the standard rent-burdened threshold; future hikes will face affordability resistance.
Forward outlook
- Local home prices are declining (-3.0%/yr); year-one equity from $1k of loan paydown is wiped out by about $6k of value loss. Plan a longer hold.
- Broward County population projected at +34% by 2050 — long-run rental-demand tailwind backs the buy-and-hold thesis.
Negotiation context
- Only 12 days on market — expect competitive offers; lowballing is unlikely to land.
- Current owner paid $76k; list at $199k implies a 161% gain — meaningful room to come down on a strong offer.
Risks & watch-outs
- Climate carrying-cost: severe wind risk, 99% chance of damaging wind over 30y; extreme-heat days projected 6→20/yr by 2055 (HVAC capex compounding) — expect insurance premiums to compound above CPI over the hold.
Questions for the listing agent
- What does the HOA fee cover, when was the last increase, and are there any pending special assessments or reserve-fund shortfalls?
- Is there a deadline driving the sale (1031 exchange, divorce, estate, relocation)? That informs how much negotiation room exists.
- What's the average days-on-market for RENTAL listings here right now (not sales)? A rising rental-DOM trend means longer vacancies and softer asking-rent achievability than the comps imply.
- What's the recent tenant-quality profile in this submarket — average credit score on applications, eviction rate, late-payment / NSF rate, and stable-employment percentage? A property-management company in the area should have these aggregated.
- How much new for-sale + rental construction is in the pipeline within 1–3 miles? Heavy new supply typically softens prices + rents 12–24 months out; constrained supply supports both.
Investment metrics
- 1% rule
- 1.15% ✓
- Cap rate
- 8.26%
- Cash-on-cash
- 7.04%
- DSCR
- 1.31
- GRM
- 7.2
CMA / ARV
- ARV (on-the-fly)
- $269,180
- Comps found
- 7
Show comp detail 7 sales within ~0.75 mi
| Address | Dist | Beds/Ba | Sqft | Sold | Price | $/sf | Match |
|---|---|---|---|---|---|---|---|
| 6026 Woodlands Blvd | 0.14mi | 2/2.0 | 1,224 (-2%) | 2mo | $277,000 | $226 | 88 |
| 7184 Sportsmans Dr #7184 | 0.27mi | 2/2.0 | 1,186 (-5%) | 21mo | $309,000 | $261 | 61 |
| 5740 Rock Island Rd #297 | 0.47mi | 2/2.0 | 1,140 (-9%) | 3mo | $173,000 | $152 | 61 |
| 4940 E Sabal Palm Blvd #303 | 0.62mi | 2/2.0 | 1,270 (+1%) | 17mo | $260,000 | $205 | 55 |
| 1801 Belmont Ln #1801 | 0.68mi | 2/2.0 | 1,162 (-7%) | 3mo | $250,000 | $215 | 54 |
| 6980 SW 19th Ct | 0.36mi | 2/1.5 | 1,178 (-6%) | 23mo | $350,000 | $297 | 52 |
| 1805 Belmont Ln #1805 | 0.68mi | 2/2.0 | 1,162 (-7%) | 14mo | $218,000 | $188 | 45 |
Match score weights: distance 35% · size 25% · config 20% · recency 20%. Top-matched comps best support the ARV.
Projected returns pro-forma
-3.0% appreciation · 0.0% rent growth · sell at horizon
- IRR
- -9.1%
- Equity multiple
- 0.68×
- Total profit
- $-18,033
- Equity at exit
- $29,672
- IRR
- -4.6%
- Equity multiple
- 0.74×
- Total profit
- $-14,422
- Equity at exit
- $17,206
Cash invested: $55,720 (down + closing). Projections, not guarantees.
Landlord ↔ Tenant lean methodology
- Overall (STATE)
- 87 Strongly Landlord-Friendly
- State Florida
- 87 Strongly Landlord-Friendly · R+3
- County
- — inherits STATE
- City
- — inherits STATE
ZIP-level market 33068
- Rents YoY
- -0.7%
- Active inventory
- 298
- Price-to-rent
- 7.2×
Monthly cashflow live
- Estimated rent
- $2,291 high interval (Pro) →
- Mortgage (P&I)
- −$1,044
- Tax from tax record
- −$86 /mo · $1,035/yr
- Insurance
- −$83
- HOA
- −$270
- Vacancy / Maint / Mgmt
- −$481
- Net cashflow
- $327
Break-even live
UW: 25.0% down · 7.5% · 30yr · 1.5% tax · 5.0% vac · 8.0% maint · 8.0% mgmt
Financing live
Cash to close
- Down payment
- $49,750
- Closing costs
- $5,970
- Reserves months
- —
- Total cash needed
- —
Loan-product check · same deal, 3 products live
Conventional
25% down · 7.5% · 30yr
- Down + closing
- —
- Monthly P&I
- —
- Monthly cashflow
- —
- DSCR
- —
- Eligible?
- —
Personal DTI + credit; lowest rate.
DSCR
20% down · 8.5% · 30yr
- Down + closing
- —
- Monthly P&I
- —
- Monthly cashflow
- —
- DSCR
- —
- Eligible?
- —
No personal income docs; deal must DSCR.
Hard money
10% down · 12.0% · 12mo
- Down + closing
- —
- Monthly P&I
- —
- Monthly cashflow
- —
- DSCR
- —
- Eligible?
- —
Short-term bridge; refi at stabilization.
Rent comps 40 comps
| Address | Beds | Baths | Sqft | Rent | $/sqft | DOM | Units | Dist |
|---|---|---|---|---|---|---|---|---|
| 1908 Players Pl North Lauderdale, FL | 3.0 | 2.0 | 1336 | $1,150 | $0.86 | 24d | 1 | 0.17mi |
| 1953 Players Pl #1953 North Lauderdale, FL | 3.0 | 2.0 | 1186 | $2,400 | $2.02 | 24d | 1 | 0.18mi |
| 33 Spinning Wheel Ln Tamarac, FL | 3.0 | 2.5 | 1865 | $2,750 | $1.47 | 24d | 1 | 0.19mi |
| 5584 NW 59th Pl Tamarac, FL | 3.0 | 2.5 | 1488 | $2,700 | $1.81 | 24d | 1 | 0.22mi |
| 2024 Champions Way North Lauderdale, FL | 2.0 | 2.0 | 948 | $2,500 | $2.64 | 24d | 1 | 0.23mi |
| 5476 Gate Lake Rd #5476 Tamarac, FL | 3.0 | 2.5 | 1811 | $2,900 | $1.60 | 2d | 1 | 0.24mi |
| 5424 Gate Lake Rd #5424 Tamarac, FL | 3.0 | 2.5 | 1811 | $3,000 | $1.66 | 24d | 1 | 0.27mi |
| 1812 Adventure Pl #1812 North Lauderdale, FL | 2.0 | 1.0 | 955 | $2,200 | $2.30 | 24d | 1 | 0.28mi |
| 7174 Sportsmans Dr North Lauderdale, FL | 2.0 | 2.0 | 1186 | $2,400 | $2.02 | 24d | 1 | 0.29mi |
| 5843 Woodlands Blvd Unit 5843 Tamarac, FL | 3.0 | 2.5 | 1373 | $2,900 | $2.11 | 24d | 1 | 0.31mi |
| 1850 Adventure Pl North Lauderdale, FL | 3.0 | 2.0 | 1336 | $2,750 | $2.06 | 24d | 1 | 0.32mi |
| 5821 Swordfish Ct Unit B Tamarac, FL | 2.0 | 2.5 | 1380 | $2,250 | $1.63 | 24d | 1 | 0.36mi |
| 5780 Rock Island Rd #362 Tamarac, FL | 2.0 | 2.0 | 1030 | $1,900 | $1.84 | 24d | 1 | 0.41mi |
| 6075 N Sabal Palm Blvd #210 Tamarac, FL | 2.0 | 2.0 | 970 | $1,900 | $1.96 | 21d | 1 | 0.41mi |
| 6963 SW 19th St Pompano Beach, FL | 2.0 | 1.0 | 1054 | $1,700 | $1.61 | 24d | 1 | 0.46mi |
| 5628 Rock Island Rd Tamarac, FL | 1.0–2.0 | 1.0–2.0 | 867 | $2,000 | $2.31 | 5d | 2 | 0.57mi |
| 5903 NW 57th Ct Tamarac, FL | 1.0–3.0 | 1.0–2.0 | 1080 | $2,330 | $2.16 | 3d | 30 | 0.58mi |
| 5646 Rock Island Rd #198 Tamarac, FL | 2.0 | 2.0 | 1030 | $2,150 | $2.09 | 24d | 1 | 0.58mi |
| 6051 NW 61st Ave Tamarac, FL | 2.0 | 2.0 | 965 | $1,675 | $1.74 | 15d | 2 | 0.60mi |
| 1400 Avon Ln North Lauderdale, FL | 1.0–3.0 | 1.0–2.0 | 1070 | $2,256 | $2.11 | 2d | 58 | 0.63mi |
| 6161 NW 57th Ct #103 Tamarac, FL | 2.0 | 2.0 | 880 | $2,200 | $2.50 | 24d | 1 | 0.63mi |
| 6070 NW 64th Ave #204 Fort Lauderdale, FL | 2.0 | 2.0 | 880 | $1,700 | $1.93 | 3d | 1 | 0.65mi |
| 2303 Belmont Ln #2303 North Lauderdale, FL | 2.0 | 2.0 | 1154 | $1,900 | $1.65 | 24d | 1 | 0.67mi |
| 2202 Belmont Ln Unit 2202 North Lauderdale, FL | 1.0 | 1.0 | 878 | $2,150 | $2.45 | 15d | 1 | 0.67mi |
| 2008 Belmont Ln #2008 North Lauderdale, FL | 3.0 | 2.0 | 1480 | $2,400 | $1.62 | 24d | 1 | 0.67mi |
| 1204 Belmont Ln Unit 1204 North Lauderdale, FL | 1.0 | 1.0 | 878 | $1,800 | $2.05 | 24d | 1 | 0.67mi |
| 1302 Belmont Ln #1302 North Lauderdale, FL | 1.0 | 1.0 | 878 | $1,850 | $2.11 | 24d | 1 | 0.67mi |
| 1308 Belmont Ln #1308 North Lauderdale, FL | 2.0 | 2.0 | 1035 | $2,000 | $1.93 | 8d | 1 | 0.67mi |
| 1002 Belmont Ln #1002 North Lauderdale, FL | 1.0 | 1.0 | 878 | $1,900 | $2.16 | 24d | 1 | 0.67mi |
| 2707 Belmont Ln Unit 1 North Lauderdale, FL | 3.0 | 2.0 | 1553 | $2,250 | $1.45 | 24d | 1 | 0.67mi |
| 1308 Belmont Ln #1308 North Lauderdale, FL | 2.0 | 2.0 | 1035 | $2,000 | $1.93 | 17d | 1 | 0.67mi |
| 1307 Belmont Ln #1307 North Lauderdale, FL | 3.0 | 2.0 | 1480 | $2,350 | $1.59 | 24d | 1 | 0.67mi |
| 1507 Belmont Ln #1507 North Lauderdale, FL | 3.0 | 2.0 | 1553 | $2,300 | $1.48 | 21d | 1 | 0.68mi |
| 1507 Belmont Ln #1507 North Lauderdale, FL | 3.0 | 2.0 | 1553 | $2,300 | $1.48 | 24d | 1 | 0.68mi |
| 6300 NW 62nd St Tamarac, FL | 1.0–2.0 | 1.0–2.0 | 770 | $1,700 | $2.21 | 2d | 3 | 0.68mi |
| 6020 NW 64th Ave Tamarac, FL | 1.0–2.0 | 1.0–2.0 | 770 | $1,700 | $2.21 | 24d | 4 | 0.70mi |
| 6020 NW 64th Ave Tamarac, FL | 1.0–2.0 | 1.0–2.0 | 770 | $1,700 | $2.21 | 4d | 3 | 0.70mi |
| 1820 N Lauderdale Ave #3117 North Lauderdale, FL | 2.0 | 2.0 | 1000 | $1,850 | $1.85 | 24d | 1 | 0.71mi |
| 1820 N Lauderdale Ave #3416 North Lauderdale, FL | 2.0 | 2.0 | 1000 | $2,000 | $2.00 | 22d | 1 | 0.71mi |
| 6872 SW 15th St Pompano Beach, FL | 2.0 | 1.0 | 919 | $2,400 | $2.61 | 14d | 1 | 0.71mi |
HOA detail
- Monthly dues
- $270 · $3,240/yr
- Likely covers
- pool
Listing history 9 events
-
2026-06-18days on market $199,000 Active 12 DOM
-
2026-06-17days on market $199,000 Active 11 DOM
-
2026-06-16days on market $199,000 Active 10 DOM
-
2026-06-15days on market $199,000 Active 9 DOM
-
2026-06-13days on market $199,000 Active 7 DOM
-
2026-06-09days on market $199,000 Active 3 DOM
-
2026-06-08days on market $199,000 Active 2 DOM
-
2026-06-07remarks 554-char remark
-
2026-06-07$199,000 Active 1 DOM
ⓘ Source: listings_history table (triggers on properties + properties_extension) + one-shot
backfill from property_details.listing_events for pre-trigger history.
Tax reassessment forecast FL · Resets to sale price
- Current annual tax
- $1,035 · $86/mo
- Projected year-2 tax
- $1,652 · $138/mo
- Expected delta
- +$617/yr (+$51/mo · 59.6%)
ⓘ Screening estimate from a state-policy table — verify with the county assessor before closing.
Climate risk First Street
- Flood 1/10 Low FEMA zone X (shaded) · 0% chance over 30 yrs
- Wildfire 1/10 Low
- Heat 9/10 Extreme 6 d/yr ≥106°F today · 20 d/yr by 30 yrs out
- Wind 10/10 Extreme 99% chance of damaging wind over 30 yrs
- Air quality 3/10 Moderate 3 unhealthy d/yr today · 3 by 30 yrs out
Nearby sold comps map
Loading sold comps map…
Walkable amenities ~0.75 mi
Loading nearby amenities…
Taxation est. · year 1
- Rental income
- $27,489
- − Mortgage interest
- −$11,147
- − Property taxes
- −$1,035
- − Insurance
- −$995
- − Repairs & maintenance
- −$2,199
- − Management
- −$2,199
- − HOA
- −$3,240
- − Depreciation
- −$5,789
- Taxable income
- $885
- Est. tax owed @ 24.0%
- −$212
- After-tax cash flow
- $3,711/yr
For passive investors: Depreciation is non-cash, so a rental often shows a tax loss while cash-flowing — sheltering income. Rental losses are passive: they offset passive income freely, and up to $25,000/yr can offset ordinary (W-2) income if you actively participate and your MAGI is under $100k (phasing out to $0 by $150k); unused losses carry forward. On sale, claimed depreciation is recaptured at up to 25%, and gains may owe capital-gains tax (a 1031 exchange can defer both). Figures are a year-1 estimate at your 24.0% rate — not tax advice; consult a CPA.
Schools (NCES district)
- District
- Broward
- NCES district ID
- 1200180
- Math proficiency
- 42% ▼ -18.00%
- Reading proficiency
- 53% ▼ -5.00%
- Median HH income
- $52,139
- Composite
- 40.88/100
- National rank
- #3621
- State rank
- #46 of 73 in FL
Livability — North Lauderdale
- Score
- 76/100
- State rank
- #230
- US rank
- #3635
Category grades
Schools grade is shown separately in the Schools card above.
Census & demographics
- Census place
- North Lauderdale, FL
- County
- Broward County · 1,963,430 people
- City population
- 54,439
- Metro
- Miami-Fort Lauderdale-Pompano Beach, FL
- Population (ZIP)
- 54,439
- Household income
- $64,051
- Rent vs Own
- Severe rent burden
- 3073.0
Population outlook (Broward County) Hauer SSP2
- Today (2025)
- 2,207,033 people
- By 2030
- 2,360,704 · +7.0%
- By 2040
- 2,661,208 · +20.6%
- By 2050
- 2,946,698 · +33.5%
- By 2075
- 3,602,273 · +63.2%
- By 2100
- 3,970,984 · +79.9%
Race, ethnicity, and origin ACS 2023
- Neighborhood character
- Diverse neighborhood (Simpson 0.61)
- Race & ethnicity
- Black 58% Hispanic / Latino 21% Two or more races 13% White 11% Asian 4%
- Hispanic origin (detail)
- Mexican 3% Puerto Rican 4% Cuban 1% Dominican 3%
- Common ancestry
- Hispanic 17% Estonian 1% Lithuanian 1%
- Foreign-born
- 47% · Canada, Jamaica, Vietnam
- Languages at home
- 59% English-only · Spanish 19% French/Haitian/Cajun 15% Other Indo-European 2%
Political lean MEDSL · Broward
- 2024 margin
- D (+17.0) · D 58.0% · R 41.0%
- 2008→2024 swing
- -17.8pp toward R · 2008: 34.7pp · 2024: 17.0pp
- All cycles
- 2024: D+17.0 2020: D+29.8 2016: D+35.0 2012: D+34.9 2008: D+34.7
Not yet ingested
- Civics
- —
Market trends
- HPI YoY
- ▼ -317.60%
- Current HPI
- 426.2972
- Rent YoY
- ▼ -0.74%
- Metro
- Miami-Fort Lauderdale-Pompano Beach, FL
- State GDP YoY
- ▲ 3.28%
- F500 in state
- 36
Industry mix (Fortune 500 HQ in FL)
| Industry | F500 HQs | Revenue |
|---|---|---|
| Industrial Technology | 2 | $29B |
|
||
| Insurance | 2 | $17B |
|
||
| Retail | 1 | $60B |
|
||
| Technology Distribution | 1 | $58B |
|
||
| Homebuilding | 1 | $35B |
|
||
| Technology Manufacturing | 1 | $35B |
|
||
Price history
+161.2% since first listed2 events — show timeline
- 2026-06-06 Listed $199,000 Beaches MLS
- 1987-05-20 Sold (Public Records) $76,200 Public Records
Property tax history
+3.6%/yrLatest (2025): $1,035 · +1.2% YoY. Source: county tax records.
Cash-flow waterfall
monthlySold comps — $/sqft
last 12 mo · ≤1 miLoading sold comps…