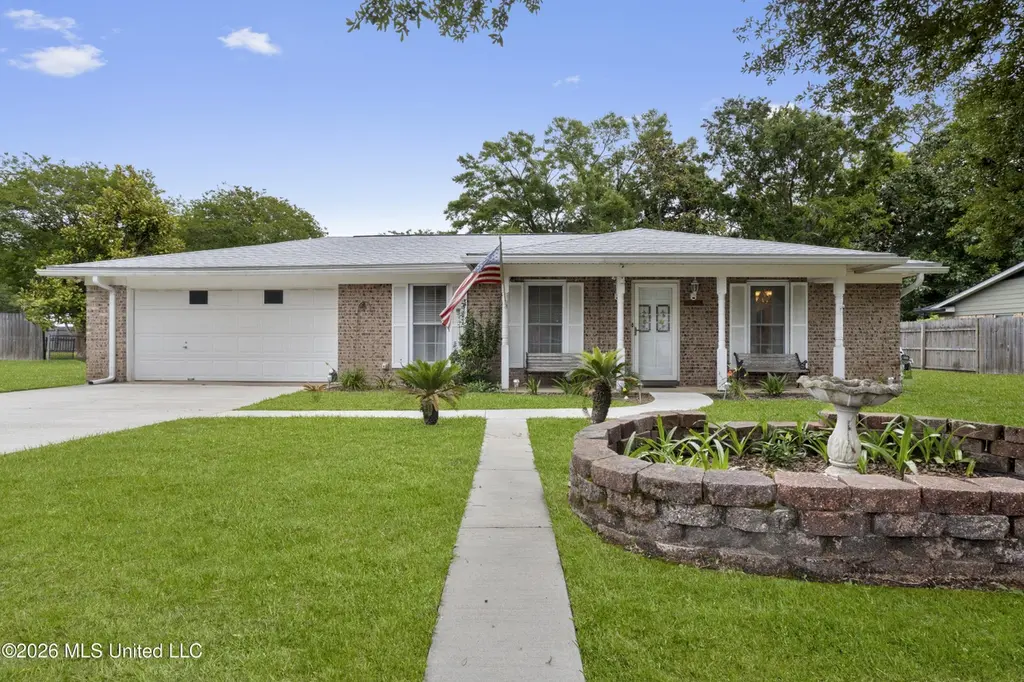
3412 Nottingham Rd · Ocean Springs, MS
Flood risk 1/10 · Minimal
- FEMA flood zone
- X (unshaded)
- Chance of flooding over 30 yrs
- 0.0%
- Est. flood insurance / yr
- $507 – $1,088
Fire risk 4/10 · Minor
- Est. fire insurance / yr
- $1,241 – $2,305
Heat risk 10/10 · Severe
- Hot days now (above 107°F)
- 7 days/yr
- Hot days in 30 yrs
- 22 days/yr
Wind risk 9/10 · Severe
- Chance of severe wind over 30 yrs
- 99.0%
Air-quality risk 2/10 · Minimal
- Unhealthy air days now
- 1 days/yr
- Unhealthy air days in 30 yrs
- 2 days/yr
Risk factors via First Street. Map © Google.
Why this score? — see what drove the D grade
The composite is a weighted blend of 9 inputs, each scored 0–100. Each bar is that input's sub-score; the figure is the points it added to the 100-point composite (weight × sub-score).
- ARV discount +13.2/15.0
- Cash flow +7.9/30.0
- Schools +5.3/10.0
- Livability +4.3/5.0
- Rent growth +2.8/5.0
- Condition / age +2.5/5.0
- 1% rule +2.4/10.0
- DSCR +1.9/10.0
- Appreciation +0.0/10.0
$264,000
🖨 Deal sheet (PDF) 📄 Offer letter ✓ Due diligence
Listing remarks
Golf Cart Living in Fort Bayou Estates - Solid Brick Home with Brand New Roof & Subroof, Large Yard & Endless Potential! Welcome to 3412 Nottingham Drive in the heart of Fort Bayou Estates - one of Ocean Springs' most loved neighborhoods and part of the highly sought-after Golf Cart District! This solid brick 3-bedroom, 2-bath home sits on a large, beautiful lot in an X flood zone, meaning flood insurance is not typically required by lenders. Enjoy sidewalks, a neighborhood park, boat launch access, and the ability to golf cart to downtown Ocean Springs and all of its restaurants, festivals, art, and coastal charm. Inside, you'll find a spacious open living and dining area just
Key facts
- Large yard
- Boat launch access
- Bar seating
Tags
Property features AI
Finance
- HOA & community: Community offers boating and fishing; Near entertainment; Playground; Sidewalks and street lights; See remarks
Exterior
- Parking: 2-car garage; Driveway; Garage faces front with direct access; Concrete driveway
- Utilities: Public water; Public sewer; Electricity connected; Water connected
- Home design: Single-family house; One story; Move-in ready
- Construction: Brick construction; Slab foundation; Built (year source: public records)
- Exterior features: Shingle roof; Exterior lighting; Rain gutters; Fenced lot; See remarks
Interior
- Kitchen: Appliances: See remarks
- Flooring: Luxury vinyl flooring; Ceramic tile flooring
- Bathrooms: 2 full bathrooms
- Heating & cooling: Central electric heating; Central electric air conditioning
- Interior features: Breakfast bar; Ceiling fans; Eat-in kitchen
- Laundry & utility: Laundry located in garage
Neighborhood map
What this means for you Summary
Snapshot
- This is a 3-bed/2.0-bath single-family listed at $264k.
Deal economics
- At list price, monthly cash flow is $-286 ($-3k/yr) — negative.
- To cash-flow at today's rent, offer at most $223k (15.7% below list).
- To meet the 1% rule (rent ≥ 1% of price), the offer needs to be $195k (26.3% below list).
- Recommended offer: $195k (26.3% below list) — sets the bar for 1% rule.
Location & tenants
- Location reads 86/100 on livability (#2 in MS, #420 nationally) — a professional / high-income tenant draw. Strengths: crime A+, amenities A+, cost of living A+; Watch: commute F.
- Ocean Springs School District (suburban): math 64% / reading 59% proficiency, ranked #1 of 130 in MS (top 1%) — acceptable for families but not a draw, mixed tenant base, ~2y average lease.
- Zoned schools: Oak Park Elementary School (math 67% / reading 57%, grade B, #18 of 375 statewide, top 5%, 498 students, 99% FRL); Ocean Springs Upper Elementary Scho (math 59% / reading 56%, grade B, #12 of 179 statewide, top 6%, 1,332 students, 100% FRL); Ocean Springs High School (math 77% / reading 64%, grade B+, #1 of 197 statewide, top 0%, 1,899 students, 100% FRL) — zoned schools average 100% FRL vs 33% district-wide (67 pts higher); higher-poverty schools than district average — tighter screening recommended.
- Market conditions: Rents rising (+1.3%/yr); 723 active listings in the ZIP; 20 comparable units currently listed for rent nearby; rentals at typical pace (median 23d on market — plan ~3-4 weeks tenant-placement turnaround); solid renter incomes; 516 units permitted in Jackson County in 2024 (6 in 5+ unit buildings).
Forward outlook
- Local home prices are declining (-3.0%/yr); year-one equity from $2k of loan paydown is wiped out by about $8k of value loss. Plan a longer hold.
Negotiation context
- It's been on market 39 days — a 3% lower offer ($256k) is reasonable based on typical stale-listing flexibility.
Risks & watch-outs
- Climate carrying-cost: severe wind risk, 99% chance of damaging wind over 30y; extreme-heat days projected 7→22/yr by 2055 (HVAC capex compounding) — expect insurance premiums to compound above CPI over the hold.
Questions for the listing agent
- What do current leases actually rent for vs. the listed asking? Can we see a recent rent roll and the last 12 months of T-12 income?
- It's been on market 39 days. Have you received any prior offers? Is the seller open to a 26% concession, seller financing, or rate buy-down credit?
- Built in 1973 — when were the roof, HVAC, electrical panel, plumbing, and water heater last replaced?
- Is there a deadline driving the sale (1031 exchange, divorce, estate, relocation)? That informs how much negotiation room exists.
- Schools are B-rated — typically a magnet for longer-tenancy family renters. What's the average tenant stay here, and is there a school-zone premium baked into asking?
- The area grade is low — what's the realistic commute time and amenity access for the typical tenant pool here? Any planned neighborhood developments (good or bad) we should know about?
- What's the average days-on-market for RENTAL listings here right now (not sales)? A rising rental-DOM trend means longer vacancies and softer asking-rent achievability than the comps imply.
- What's the recent tenant-quality profile in this submarket — average credit score on applications, eviction rate, late-payment / NSF rate, and stable-employment percentage? A property-management company in the area should have these aggregated.
- How much new for-sale + rental construction is in the pipeline within 1–3 miles? Heavy new supply typically softens prices + rents 12–24 months out; constrained supply supports both.
Investment metrics
- 1% rule
- 0.74% ✗
- Cap rate
- 4.99%
- Cash-on-cash
- -4.65%
- DSCR
- 0.79
- GRM
- 11.3
CMA / ARV
- ARV (median comp)
- $302,312
- List price
- $264,000
- Delta
- -12.67%
- Verdict
- UNDERPRICED
- Comps
- 20 within 1.0 mi
Show comp detail 12 sales within ~0.75 mi
| Address | Dist | Beds/Ba | Sqft | Sold | Price | $/sf | Match |
|---|---|---|---|---|---|---|---|
| 1334 Diller Rd | 0.17mi | 3/2.0 | 1,725 (+7%) | 7mo | $219,000 | $127 | 74 |
| 3231 Nottingham Rd | 0.42mi | 3/2.0 | 1,634 (+1%) | 5mo | $245,000 | $150 | 74 |
| 5513 Sioux Dr | 0.38mi | 3/2.0 | 1,700 (+6%) | 1mo | $270,000 | $159 | 72 |
| 127 Clear Springs Cir | 0.44mi | 3/2.0 | 1,676 (+4%) | 5mo | $292,000 | $174 | 68 |
| 5316 Culeoka Dr | 0.52mi | 3/2.0 | 1,582 (-2%) | 6mo | $215,000 | $136 | 68 |
| 1210 Lancelot Ln | 0.62mi | 3/2.0 | 1,545 (-4%) | 4mo | $309,000 | $200 | 61 |
| 1204 Londonderry Ln | 0.47mi | 3/2.0 | 1,743 (+8%) | 4mo | $234,900 | $135 | 61 |
| 145 Clear Springs Cir | 0.52mi | 4/2.0 (+1) | 1,680 (+4%) | 3mo | $288,000 | $171 | 61 |
| 1209 Hammersmith Ln | 0.72mi | 3/2.0 | 1,575 (-2%) | 2mo | $285,000 | $181 | 61 |
| 5401 Culeoka Dr | 0.46mi | 4/2.0 (+1) | 1,480 (-8%) | 3mo | $209,900 | $142 | 58 |
| 10100 Iroquois Ave | 0.58mi | 4/3.0 (+1) | 1,739 (+8%) | 7mo | $269,900 | $155 | 45 |
| 92 Hunter Dr | 0.70mi | 3/2.0 | 1,770 (+10%) | 8mo | $249,900 | $141 | 44 |
Match score weights: distance 35% · size 25% · config 20% · recency 20%. Top-matched comps best support the ARV.
Projected returns pro-forma
-3.0% appreciation · 1.31% rent growth · sell at horizon
- IRR
- -26.1%
- Equity multiple
- 0.13×
- Total profit
- $-64,251
- Equity at exit
- $39,363
- IRR
- -29.4%
- Equity multiple
- -0.25×
- Total profit
- $-92,236
- Equity at exit
- $22,826
Cash invested: $73,920 (down + closing). Projections, not guarantees.
Landlord ↔ Tenant lean methodology
- Overall (STATE)
- 90 Strongly Landlord-Friendly
- State Mississippi
- 90 Strongly Landlord-Friendly · R+11
- County
- — inherits STATE
- City
- — inherits STATE
ZIP-level market 39564
- Home prices YoY
- -26.8%
- Rents YoY
- 1.3%
- Active inventory
- 723
- Price-to-rent
- 11.3×
Monthly cashflow live
- Estimated rent
- $1,947 high interval (Pro) →
- Mortgage (P&I)
- −$1,384
- Tax est. 1.5%
- −$330 /mo · $3,960/yr
- Insurance
- −$110
- HOA
- −$0
- Vacancy / Maint / Mgmt
- −$409
- Net cashflow
- $-286
Break-even live
Sensitivity live
| Price | -10% $-104 | -5% $-195 | +0% $-286 | +5% $-378 | +10% $-469 |
|---|---|---|---|---|---|
| Rent | -10% $-440 | -5% $-363 | +0% $-286 | +5% $-210 | +10% $-133 |
| Rate | -1.0pp $-154 | -0.5pp $-219 | base $-286 | +0.5pp $-355 | +1.0pp $-424 |
UW: 25.0% down · 7.5% · 30yr · 1.5% tax · 5.0% vac · 8.0% maint · 8.0% mgmt
Financing live
Cash to close
- Down payment
- $66,000
- Closing costs
- $7,920
- Reserves months
- —
- Total cash needed
- —
Loan-product check · same deal, 3 products live
Conventional
25% down · 7.5% · 30yr
- Down + closing
- —
- Monthly P&I
- —
- Monthly cashflow
- —
- DSCR
- —
- Eligible?
- —
Personal DTI + credit; lowest rate.
DSCR
20% down · 8.5% · 30yr
- Down + closing
- —
- Monthly P&I
- —
- Monthly cashflow
- —
- DSCR
- —
- Eligible?
- —
No personal income docs; deal must DSCR.
Hard money
10% down · 12.0% · 12mo
- Down + closing
- —
- Monthly P&I
- —
- Monthly cashflow
- —
- DSCR
- —
- Eligible?
- —
Short-term bridge; refi at stabilization.
Rent comps 20 comps
| Address | Beds | Baths | Sqft | Rent | $/sqft | DOM | Units | Dist |
|---|---|---|---|---|---|---|---|---|
| 1221 King Henry Dr Ocean Springs, MS | 3.0 | 2.0 | 1599 | $1,800 | $1.13 | 45d | 1 | 0.12mi |
| 3500 Groveland Rd Ocean Springs, MS | 2.0–3.0 | 2.0 | 1173 | $1,750 | $1.49 | 15d | 1 | 0.38mi |
| 7003 Ute Ct Ocean Springs, MS | 4.0 | 2.0 | 2000 | $2,195 | $1.10 | 22d | 1 | 0.77mi |
| 3825 Timberlake Dr Ocean Springs, MS | 3.0 | 2.0 | 1640 | $2,200 | $1.34 | 22d | 1 | 0.80mi |
| 2718 Government St Ocean Springs, MS | 3.0 | 2.0 | 1516 | $1,800 | $1.19 | 45d | 1 | 0.89mi |
| 3910 Yosemite Dr Ocean Springs, MS | 3.0 | 2.0 | 1070 | $1,595 | $1.49 | 45d | 1 | 1.05mi |
| 156 Lafayette Cir Ocean Springs, MS | 3.0 | 2.0 | 1700 | $1,800 | $1.06 | 22d | 1 | 1.05mi |
| 1200 Deana Rd Ocean Springs, MS | 2.0 | 2.0 | 1063 | $1,296 | $1.22 | 22d | 1 | 1.08mi |
| 1200 Deana Rd Ocean Springs, MS | 2.0 | 2.0 | 1063 | $1,405 | $1.32 | 15d | 1 | 1.08mi |
| 1200 Deana Rd Ocean Springs, MS | 2.0 | 2.0 | 1063 | $1,337 | $1.26 | 45d | 1 | 1.08mi |
| 2501 Bienville Blvd Unit 432 Ocean Springs, MS | 2.0 | 2.0 | 1095 | $2,300 | $2.10 | 45d | 1 | 1.21mi |
| 132 Gettysburg Cir Ocean Springs, MS | 4.0 | 3.0 | 1689 | $2,195 | $1.30 | 22d | 1 | 1.24mi |
| 4008 Breezy Hill Ln Ocean Springs, MS | 4.0 | 3.0 | 1600 | $3,200 | $2.00 | 15d | 1 | 1.27mi |
| 2501 Bienville Blvd Ocean Springs, MS | 2.0 | 2.0 | 1156 | $2,000 | $1.73 | 45d | 1 | 1.28mi |
| 230 Saratoga Dr Ocean Springs, MS | 3.0 | 2.0 | 1450 | $1,800 | $1.24 | 45d | 1 | 1.28mi |
| 230 Saratoga Dr Ocean Springs, MS | 3.0 | 2.0 | 1380 | $1,850 | $1.34 | 15d | 1 | 1.28mi |
| 237 Saratoga Dr Ocean Springs, MS | 3.0 | 2.0 | 1295 | $2,150 | $1.66 | 15d | 1 | 1.30mi |
| 212 Maple Dr Ocean Springs, MS | 3.0 | 1.5 | 1092 | $1,475 | $1.35 | 15d | 1 | 1.30mi |
| 106 Booth Cir Ocean Springs, MS | 4.0 | 2.0 | 2100 | $2,500 | $1.19 | 15d | 1 | 1.32mi |
| 422 Whispering Pine Dr Ocean Springs, MS | 3.0 | 2.0 | 1075 | $1,795 | $1.67 | 15d | 1 | 1.32mi |
Listing history 16 events
-
2026-06-21days on market $264,000 Active 39 DOM
-
2026-06-18days on market $264,000 Active 36 DOM
-
2026-06-17days on market $264,000 Active 35 DOM
-
2026-06-16days on market $264,000 Active 34 DOM
-
2026-06-15days on market $264,000 Active 33 DOM
-
2026-06-14days on market $264,000 Active 31 DOM
-
2026-06-13pricedays on market $264,000 Active 30 DOM
-
2026-06-10days on market $266,500 Active 28 DOM
-
2026-06-09days on market $266,500 Active 27 DOM
-
2026-06-08days on market $266,500 Active 26 DOM
-
2026-06-07days on market $266,500 Active 25 DOM
-
2026-06-02days on market $266,500 Active 20 DOM
-
2026-06-01days on market $266,500 Active 19 DOM
-
2026-05-31days on market $266,500 Active 18 DOM
-
2026-05-30days on market $266,500 Active 17 DOM
-
2026-05-13$269,000 Active 2669-char remark
ⓘ Source: listings_history table (triggers on properties + properties_extension) + one-shot
backfill from property_details.listing_events for pre-trigger history.
Climate risk First Street
- Flood 1/10 Low FEMA zone X (unshaded) · 0% chance over 30 yrs
- Wildfire 4/10 Moderate
- Heat 10/10 Extreme 7 d/yr ≥107°F today · 22 d/yr by 30 yrs out
- Wind 9/10 Extreme 99% chance of damaging wind over 30 yrs
- Air quality 2/10 Low 1 unhealthy d/yr today · 2 by 30 yrs out
Nearby sold comps map
Loading sold comps map…
Walkable amenities ~0.75 mi
Loading nearby amenities…
Taxation est. · year 1
- Rental income
- $23,362
- − Mortgage interest
- −$14,788
- − Property taxes
- −$3,960
- − Insurance
- −$1,320
- − Repairs & maintenance
- −$1,869
- − Management
- −$1,869
- − Depreciation
- −$7,680
- Taxable loss
- −$8,124
- Est. tax savings @ 24.0%
- +$1,950
- After-tax cash flow
- $-1,488/yr
For passive investors: Depreciation is non-cash, so a rental often shows a tax loss while cash-flowing — sheltering income. Rental losses are passive: they offset passive income freely, and up to $25,000/yr can offset ordinary (W-2) income if you actively participate and your MAGI is under $100k (phasing out to $0 by $150k); unused losses carry forward. On sale, claimed depreciation is recaptured at up to 25%, and gains may owe capital-gains tax (a 1031 exchange can defer both). Figures are a year-1 estimate at your 24.0% rate — not tax advice; consult a CPA.
Schools (NCES district)
- District
- Ocean Springs School District
- NCES district ID
- 2803360
- Math proficiency
- 64% ▼ -3.00%
- Reading proficiency
- 59% ▲ 1.00%
- Median HH income
- $60,485
- Composite
- 53.35/100
- National rank
- #1477
- State rank
- #1 of 130 in MS
Livability — Ocean Springs
- Score
- 86/100
- State rank
- #2
- US rank
- #420
Category grades
Schools grade is shown separately in the Schools card above.
Census & demographics
- Census place
- Ocean Springs, MS
- County
- Jackson County · 82,196 people
- City population
- 43,240
- Metro
- Gulfport-Biloxi, MS
- Population (ZIP)
- 43,240
- Household income
- $78,596
- Rent vs Own
- Severe rent burden
- 734.0
Population outlook (Jackson County) Hauer SSP2
- Today (2025)
- 146,926 people
- By 2030
- 148,442 · +1.0%
- By 2040
- 149,631 · +1.8%
- By 2050
- 148,723 · +1.2%
- By 2075
- 147,845 · +0.6%
- By 2100
- 144,510 · -1.6%
Race, ethnicity, and origin ACS 2023
- Neighborhood character
- Predominantly White (74%)
- Race & ethnicity
- White 74% Black 10% Hispanic / Latino 8% Two or more races 7% Asian 4%
- Hispanic origin (detail)
- Mexican 3% Puerto Rican 2%
- Common ancestry
- Lithuanian 5% Slovak 4% Romanian 2%
- Foreign-born
- 5% · Canada, South Korea, Vietnam
- Languages at home
- 93% English-only · Spanish 3% Vietnamese 2% Tagalog/Filipino 1%
Political lean MEDSL · Jackson
- 2024 margin
- Solid R (+39.9) · D 29.5% · R 69.4% · Other 1.1%
- 2008→2024 swing
- -6.4pp toward R · 2008: -33.5pp · 2024: -39.9pp
- All cycles
- 2024: R+39.9 2020: R+34.6 2016: R+39.9 2012: R+36.1 2008: R+33.5
Not yet ingested
- Civics
- —
Market trends
- HPI YoY
- ▼ -74.77%
- Current HPI
- 204.2244
- Rent YoY
- ▲ 1.31%
- Metro
- Gulfport-Biloxi, MS
- State GDP YoY
- —
- F500 in state
- 0
Price history
-1.9% since first listed3 events — show timeline
- 2026-06-11 Price Changed $264,000 MLSU
- 2026-05-28 Price Changed $266,500 MLSU
- 2026-05-13 Listed $269,000 MLSU
Property tax history
+2.8%/yrLatest (2025): $379 · +0.6% YoY. Source: county tax records.
Cash-flow waterfall
monthlySold comps — $/sqft
last 12 mo · ≤1 miLoading sold comps…