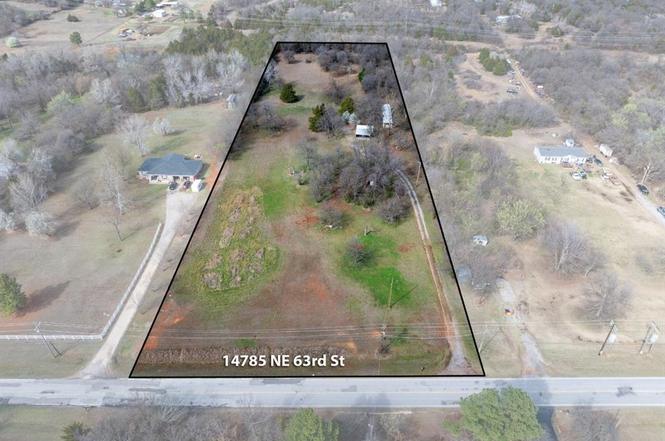
14785 NE 63rd St · Jones, OK
Flood risk 1/10 · Minimal
- FEMA flood zone
- X (unshaded)
- Chance of flooding over 30 yrs
- 0.0%
- Est. flood insurance / yr
- $507 – $1,088
Fire risk 5/10 · Moderate
- Est. fire insurance / yr
- $2,463 – $4,575
Heat risk 5/10 · Moderate
- Hot days now (above 108°F)
- 7 days/yr
- Hot days in 30 yrs
- 18 days/yr
Wind risk 3/10 · Minor
- Chance of severe wind over 30 yrs
- 4.0%
Air-quality risk 2/10 · Minimal
- Unhealthy air days now
- 1 days/yr
- Unhealthy air days in 30 yrs
- 2 days/yr
Risk factors via First Street. Map © Google.
Why this score? — see what drove the D+ grade
The composite is a weighted blend of 9 inputs, each scored 0–100. Each bar is that input's sub-score; the figure is the points it added to the 100-point composite (weight × sub-score).
- Cash flow +19.3/30.0
- ARV discount +7.5/15.0
- DSCR +6.1/10.0
- 1% rule +5.1/10.0
- Livability +3.2/5.0
- Rent growth +2.5/5.0
- Condition / age +2.5/5.0
- Schools +2.3/10.0
- Appreciation +0.0/10.0
$175,000
🖨 Deal sheet (PDF) 📄 Offer letter ✓ Due diligence
Listing remarks
Beautiful 5.33 acres of well-maintained land ready for your next home site! This gorgeous property offers the perfect opportunity to place a new manufactured home, build a custom home, or create the barndo you’ve been dreaming of. The land is open, usable, and ready to go with a functioning water well already in place along with the propane tank set up, helping simplify the process for future improvements. A dump truck load of gravel is currently on the property and may be useful for driveway or site preparation. Additionally, there are 20+ steel anger, iron beams (20 ft ea) located on the property that could potentially be repurposed for future building projects. There is also a trai
Key facts
- Propane tank set up
- Iron beams
- 5.33 acres of land
Tags
Property features AI
Finance
- Other: Property sits on approximately 5.33 acres
- Financial info: Loan qualification possible; Not assumable
- HOA & community: No mandatory association dues
Exterior
- Parking: No parking details provided
- Security: No security details provided
- Utilities: No utility provider details provided
- Home design: Single-family residence; Residential property; One-level; Existing property
- Construction: Mobile construction; Metal roof; Conventional foundation; Homestead exempt
- Exterior features: Covered deck; Rural lot setting; Below-ground and outdoor storm shelter
Interior
- Kitchen: No kitchen appliance details provided
- Bedrooms: 3 bedrooms
- Flooring: No flooring details provided
- Bathrooms: 2 full bathrooms
- Heating & cooling: Floor furnace heating; Window unit(s) for cooling
- Interior features: One living area; Free-standing fireplace
- Laundry & utility: No laundry details provided
Neighborhood map
What this means for you Summary
Snapshot
- This is a 3-bed/2.0-bath manufactured listed at $175k.
Deal economics
- At list price, monthly cash flow is $192 ($2k/yr) — positive.
- The deal already cash-flows at list — no discount required.
- Meets the 1% rule at list price ($2k rent vs $175k).
- Recommended offer: $159k (9.0% below list) — sets the bar for market timing.
Location & tenants
- Location reads 64/100 on livability (#189 in OK) — a middle-class / working-renter tenant base. Strengths: cost of living A+, housing A+, crime A; Watch: amenities F, commute F, health & safety F.
- Jones (rural): math 25% / reading 26% proficiency, ranked #85 of 270 in OK (top 32%) — low school quality limits family demand, transient renter base, plan for 1-2y turnover.
- Zoned schools: Jones Es (math 30% / reading 28%, grade F, #301 of 845 statewide, top 36%, 539 students, 0% FRL); Jones Hs (math 27% / reading 37%, grade F, #67 of 447 statewide, top 16%, 335 students, 0% FRL) — zoned schools average 0% FRL vs 41% district-wide (41 pts lower); this property's tenant base skews higher-income than the district average.
- Market conditions: 333 active listings in the ZIP; solid renter incomes; 5,365 units permitted in Oklahoma County in 2024 (569 in 5+ unit buildings).
Forward outlook
- Local home prices are declining (-3.0%/yr); year-one equity from $1k of loan paydown is wiped out by about $5k of value loss. Plan a longer hold.
- Oklahoma County population projected at +41% by 2050 — long-run rental-demand tailwind backs the buy-and-hold thesis.
Negotiation context
- It's been on market 104 days — a 9% lower offer ($159k) is reasonable based on typical stale-listing flexibility.
Risks & watch-outs
- Climate carrying-cost: moderate wildfire risk; extreme-heat days projected 7→18/yr by 2055 (HVAC capex compounding) — expect insurance premiums to compound above CPI over the hold.
Questions for the listing agent
- It's been on market 104 days. Have you received any prior offers? Is the seller open to a 9% concession, seller financing, or rate buy-down credit?
- Built in 1978 — when were the roof, HVAC, electrical panel, plumbing, and water heater last replaced?
- Why hasn't it sold? Are there any deal-killer items the seller is aware of (foundation, flood, title, zoning, code violations)?
- Is there a deadline driving the sale (1031 exchange, divorce, estate, relocation)? That informs how much negotiation room exists.
- Schools are D-rated, which usually means shorter tenancies and higher turnover. Who's the typical renter profile here, and what's been the actual vacancy rate?
- The area grade is low — what's the realistic commute time and amenity access for the typical tenant pool here? Any planned neighborhood developments (good or bad) we should know about?
- What's the average days-on-market for RENTAL listings here right now (not sales)? A rising rental-DOM trend means longer vacancies and softer asking-rent achievability than the comps imply.
- What's the recent tenant-quality profile in this submarket — average credit score on applications, eviction rate, late-payment / NSF rate, and stable-employment percentage? A property-management company in the area should have these aggregated.
- How much new for-sale + rental construction is in the pipeline within 1–3 miles? Heavy new supply typically softens prices + rents 12–24 months out; constrained supply supports both.
Investment metrics
- 1% rule
- 1.01% ✓
- Cap rate
- 7.61%
- Cash-on-cash
- 4.69%
- DSCR
- 1.21
- GRM
- 8.2
CMA / ARV
No comps found within radius.
Projected returns pro-forma
-3.0% appreciation · 3.0% rent growth · sell at horizon
- IRR
- -9.0%
- Equity multiple
- 0.67×
- Total profit
- $-16,122
- Equity at exit
- $26,093
- IRR
- 0.5%
- Equity multiple
- 1.04×
- Total profit
- $1,792
- Equity at exit
- $15,131
Cash invested: $49,000 (down + closing). Projections, not guarantees.
Landlord ↔ Tenant lean methodology
- Overall (STATE)
- 83 Strongly Landlord-Friendly
- State Oklahoma
- 83 Strongly Landlord-Friendly · R+20
- County
- — inherits STATE
- City
- — inherits STATE
ZIP-level market 73020
- Active inventory
- 333
- Price-to-rent
- 8.2×
Monthly cashflow live
- Estimated rent
- $1,774 medium interval (Pro) →
- Mortgage (P&I)
- −$918
- Tax est. 1.5%
- −$219 /mo · $2,625/yr
- Insurance
- −$73
- HOA
- −$0
- Vacancy / Maint / Mgmt
- −$372
- Net cashflow
- $192
Break-even live
Sensitivity live
| Price | -10% $313 | -5% $252 | +0% $192 | +5% $131 | +10% $71 |
|---|---|---|---|---|---|
| Rent | -10% $52 | -5% $122 | +0% $192 | +5% $262 | +10% $332 |
| Rate | -1.0pp $280 | -0.5pp $236 | base $192 | +0.5pp $146 | +1.0pp $100 |
UW: 25.0% down · 7.5% · 30yr · 1.5% tax · 5.0% vac · 8.0% maint · 8.0% mgmt
Financing live
Cash to close
- Down payment
- $43,750
- Closing costs
- $5,250
- Reserves months
- —
- Total cash needed
- —
Loan-product check · same deal, 3 products live
Conventional
25% down · 7.5% · 30yr
- Down + closing
- —
- Monthly P&I
- —
- Monthly cashflow
- —
- DSCR
- —
- Eligible?
- —
Personal DTI + credit; lowest rate.
DSCR
20% down · 8.5% · 30yr
- Down + closing
- —
- Monthly P&I
- —
- Monthly cashflow
- —
- DSCR
- —
- Eligible?
- —
No personal income docs; deal must DSCR.
Hard money
10% down · 12.0% · 12mo
- Down + closing
- —
- Monthly P&I
- —
- Monthly cashflow
- —
- DSCR
- —
- Eligible?
- —
Short-term bridge; refi at stabilization.
Listing history 17 events
-
2026-06-21days on market $175,000 Active 104 DOM
-
2026-06-18days on market $175,000 Active 101 DOM
-
2026-06-17days on market $175,000 Active 100 DOM
-
2026-06-16days on market $175,000 Active 99 DOM
-
2026-06-15days on market $175,000 Active 98 DOM
-
2026-06-13days on market $175,000 Active 96 DOM
-
2026-06-13days on market $175,000 Active 95 DOM
-
2026-06-09days on market $175,000 Active 92 DOM
-
2026-06-08days on market $175,000 Active 91 DOM
-
2026-06-07days on market $175,000 Active 90 DOM
-
2026-06-05days on market $175,000 Active 87 DOM
-
2026-06-03days on market $175,000 Active 86 DOM
-
2026-06-02days on market $175,000 Active 85 DOM
-
2026-06-01days on market $175,000 Active 84 DOM
-
2026-05-31days on market $175,000 Active 83 DOM
-
2026-04-08price $175,000
-
2026-03-09$200,000 Active
ⓘ Source: listings_history table (triggers on properties + properties_extension) + one-shot
backfill from property_details.listing_events for pre-trigger history.
Climate risk First Street
- Flood 1/10 Low FEMA zone X (unshaded) · 0% chance over 30 yrs
- Wildfire 5/10 Major
- Heat 5/10 Major 7 d/yr ≥108°F today · 18 d/yr by 30 yrs out
- Wind 3/10 Moderate 4% chance of damaging wind over 30 yrs
- Air quality 2/10 Low 1 unhealthy d/yr today · 2 by 30 yrs out
Nearby sold comps map
Loading sold comps map…
Walkable amenities ~0.75 mi
Loading nearby amenities…
Taxation est. · year 1
- Rental income
- $21,282
- − Mortgage interest
- −$9,803
- − Property taxes
- −$2,625
- − Insurance
- −$875
- − Repairs & maintenance
- −$1,703
- − Management
- −$1,703
- − Depreciation
- −$5,091
- Taxable loss
- −$517
- Est. tax savings @ 24.0%
- +$124
- After-tax cash flow
- $2,424/yr
For passive investors: Depreciation is non-cash, so a rental often shows a tax loss while cash-flowing — sheltering income. Rental losses are passive: they offset passive income freely, and up to $25,000/yr can offset ordinary (W-2) income if you actively participate and your MAGI is under $100k (phasing out to $0 by $150k); unused losses carry forward. On sale, claimed depreciation is recaptured at up to 25%, and gains may owe capital-gains tax (a 1031 exchange can defer both). Figures are a year-1 estimate at your 24.0% rate — not tax advice; consult a CPA.
Schools (NCES district)
- District
- Jones
- NCES district ID
- 4015840
- Math proficiency
- 25% ▼ -16.00%
- Reading proficiency
- 26% ▼ -10.00%
- Median HH income
- $56,636
- Composite
- 23.11/100
- National rank
- #7962
- State rank
- #85 of 270 in OK
Livability — Jones
- Score
- 64/100
- State rank
- #189
- US rank
- #14829
Category grades
Schools grade is shown separately in the Schools card above.
Census & demographics
- Census place
- Jones, OK
- County
- Oklahoma County · 771,644 people
- City population
- 7,123
- Metro
- Oklahoma City, OK
- Population (ZIP)
- 25,645
- Household income
- $104,601
- Rent vs Own
- Severe rent burden
- 258.0
Population outlook (Oklahoma County) Hauer SSP2
- Today (2025)
- 911,875 people
- By 2030
- 982,413 · +7.7%
- By 2040
- 1,130,468 · +24.0%
- By 2050
- 1,288,422 · +41.3%
- By 2075
- 1,711,482 · +87.7%
- By 2100
- 2,088,448 · +129.0%
Race, ethnicity, and origin ACS 2023
- Neighborhood character
- Predominantly White (77%)
- Race & ethnicity
- White 77% Two or more races 8% Hispanic / Latino 6% Black 5% Native American 4% Asian 2%
- Hispanic origin (detail)
- Mexican 5%
- Common ancestry
- Lithuanian 2% Italian 2% Iranian 2%
- Foreign-born
- 3% · Canada, China
- Languages at home
- 96% English-only · Spanish 2%
Political lean MEDSL · Oklahoma
- 2024 margin
- Toss-up / Even · D 48.0% · R 49.7% · Other 2.3%
- 2008→2024 swing
- +15.1pp toward D · 2008: -16.8pp · 2024: -1.7pp
- All cycles
- 2024: R+1.7 2020: R+1.1 2016: R+10.5 2012: R+16.7 2008: R+16.8
Not yet ingested
- Civics
- —
Market trends
- HPI YoY
- ▼ -131.61%
- Current HPI
- 240.9989
- Rent YoY
- —
- Metro
- Oklahoma City, OK
- State GDP YoY
- ▲ 1.55%
- F500 in state
- 6
Industry mix (Fortune 500 HQ in OK)
| Industry | F500 HQs | Revenue |
|---|---|---|
| Energy | 3 | $48B |
|
||
Price history
-12.5% since first listed2 events — show timeline
- 2026-04-08 Price Changed $175,000 MLSOK
- 2026-03-09 Listed $200,000 MLSOK
Property tax history
+1.9%/yrLatest (2025): $154 · -0.4% YoY. Source: county tax records.
Cash-flow waterfall
monthlySold comps — $/sqft
last 12 mo · ≤1 miLoading sold comps…