 🏗️ New Construction
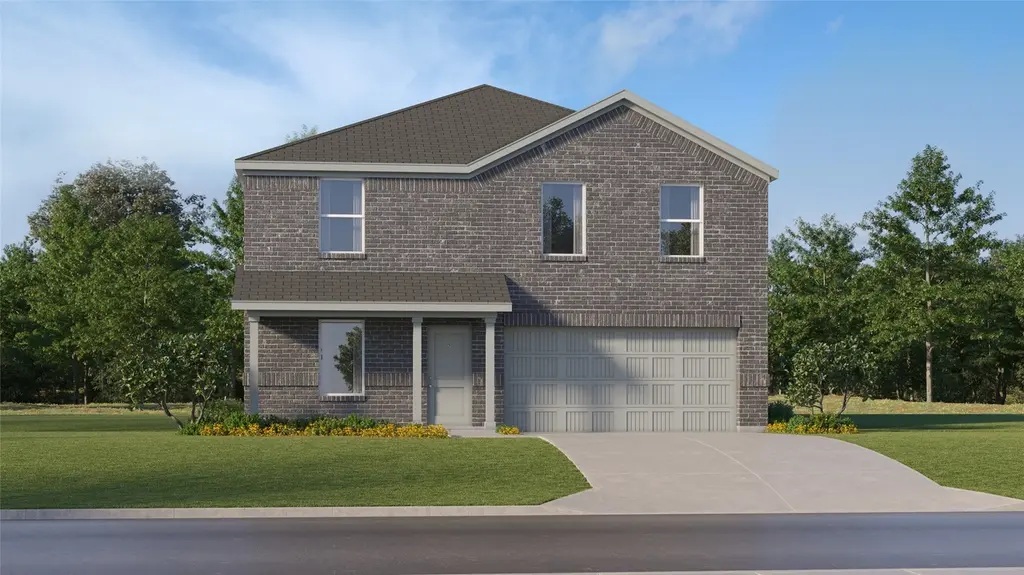
13514 Willow Fir Dr · Magnolia, TX
Flood risk 1/10 · Minimal
- FEMA flood zone
- X (unshaded)
- Chance of flooding over 30 yrs
- 0.0%
- Est. flood insurance / yr
- $507 – $1,088
Fire risk 5/10 · Moderate
- Est. fire insurance / yr
- $1,222 – $2,270
Heat risk 8/10 · Major
- Hot days now (above 111°F)
- 7 days/yr
- Hot days in 30 yrs
- 23 days/yr
Wind risk 8/10 · Major
- Chance of severe wind over 30 yrs
- 99.0%
Air-quality risk 2/10 · Minimal
- Unhealthy air days now
- 1 days/yr
- Unhealthy air days in 30 yrs
- 2 days/yr
Risk factors via First Street. Map © Google.
Why this score? — see what drove the F grade
The composite is a weighted blend of 9 inputs, each scored 0–100. Each bar is that input's sub-score; the figure is the points it added to the 100-point composite (weight × sub-score).
- Cash flow +7.7/30.0
- ARV discount +7.5/15.0
- Condition / age +4.8/5.0
- Schools +3.9/10.0
- Livability +3.7/5.0
- 1% rule +2.7/10.0
- Rent growth +2.6/5.0
- DSCR +1.8/10.0
- Appreciation +0.0/10.0
$286,990
🖨 Deal sheet (PDF) 📄 Offer letter ✓ Due diligence
Listing remarks
New Construction Lennar Houston Home - The Littleton Floor Plan - On the first floor of this spacious two-story home is a convenient and modern layout seamlessly connecting the kitchen, dining room and family room together. In a private corner is the tranquil owner’s suite with an attached bathroom and walk-in closet. Upstairs is a sprawling central game room made for gatherings of all sizes, along with three secondary bedrooms to provide sleeping accommodations to family members and guests. The completion date, prices and features may vary and are subject to change. Please verify with Lennar directly. Photos are for illustrative purposes only.
Key facts
- Central game room
- Attached bathroom
- Walk-in closet
Tags
Property features AI
Finance
- HOA & community: Community Solutions HOA; Playground, park, and trails within the community; Association fee $1,200 annually
Exterior
- Parking: Attached garage (2 spaces)
- Utilities: Public water; Public sewer
- Home design: Residential property; Under construction (new construction); Built by Lennar Homes; Slab foundation; Two-story design (primary suite on first floor)
- Construction: Brick construction; Year built: 2026
- Exterior features: Subdivision lot; Pond on lot; Composition roof
Interior
- Kitchen: Dishwasher; Electric oven; Electric range; Gas oven; Gas range
- Bedrooms: Primary bedroom on first floor (approx. 13 x 15); Additional bedrooms on second floor (approx. 10 x 11; 10 x 10; 10 x 10)
- Flooring: Carpet; Vinyl
- Bathrooms: 2 full bathrooms
- Heating & cooling: Central heating (electric and gas); Central air conditioning (electric and gas)
- Interior features: Breakfast bar; Kitchen/family room combo; Pantry; Separate shower; Tub with shower; Kitchen/dining combo
- Laundry & utility: Washer hookup; Electric dryer hookup; Gas dryer hookup
Neighborhood map
What this means for you Summary
Snapshot
- This is a 4-bed/2.0-bath single-family listed at $287k. Condition is rated excellent.
Deal economics
- At list price, monthly cash flow is $-341 ($-4k/yr) — negative.
- To cash-flow at today's rent, offer at most $248k (13.7% below list).
- To meet the 1% rule (rent ≥ 1% of price), the offer needs to be $229k (20.1% below list).
- Recommended offer: $229k (20.1% below list) — sets the bar for 1% rule.
- Cap rate 4.9% vs local median 3.4% in Magnolia — top-decile yield for the area; either an underpriced asset or a hidden risk that comps aren't pricing in. Stress-test before assuming the spread holds.
Location & tenants
- Location reads 73/100 on livability (#222 in TX) — a middle-class / working-renter tenant base. Strengths: crime A+, cost of living A+, housing A+; Watch: amenities F, commute F.
- Magnolia ISD (rural): math 42% / reading 45% proficiency, ranked #247 of 826 in TX (top 30%) — families likely to look elsewhere, expect single-tenant / working-renter base with shorter leases.
- Zoned schools: Magnolia West H S (math 41% / reading 53%, grade D-, #591 of 1,632 statewide, top 38%, 2,208 students, 52% FRL).
- Market conditions: Rents flat; 2300 active listings in the ZIP; high-income renter base; 13,259 units permitted in Montgomery County in 2024 (1,402 in 5+ unit buildings).
Forward outlook
- Local home prices are declining (-3.0%/yr); year-one equity from $2k of loan paydown is wiped out by about $9k of value loss. Plan a longer hold.
- Montgomery County population projected at +65% by 2050 — long-run rental-demand tailwind backs the buy-and-hold thesis.
Negotiation context
- It's been on market 18 days — a 2% lower offer ($283k) is reasonable based on typical stale-listing flexibility.
Risks & watch-outs
- Climate carrying-cost: severe wind risk, 99% chance of damaging wind over 30y; moderate wildfire risk; extreme-heat days projected 7→23/yr by 2055 (HVAC capex compounding) — expect insurance premiums to compound above CPI over the hold.
Questions for the listing agent
- What do current leases actually rent for vs. the listed asking? Can we see a recent rent roll and the last 12 months of T-12 income?
- What does the HOA fee cover, when was the last increase, and are there any pending special assessments or reserve-fund shortfalls?
- Is there a deadline driving the sale (1031 exchange, divorce, estate, relocation)? That informs how much negotiation room exists.
- Schools are D-rated, which usually means shorter tenancies and higher turnover. Who's the typical renter profile here, and what's been the actual vacancy rate?
- The area grade is low — what's the realistic commute time and amenity access for the typical tenant pool here? Any planned neighborhood developments (good or bad) we should know about?
- This sits on a lake — are riparian / water-frontage rights deeded with the parcel? Any dock permits, shoreline easements, or HOA water-use restrictions?
- What's the documented flood / surge / shoreline-erosion history here (FEMA AND non-FEMA — e.g., storm surge, creek backup, septic-field saturation)?
- Any water-quality or seasonal algae-bloom issues that affect tenant satisfaction or short-term-rental demand?
- What's the average days-on-market for RENTAL listings here right now (not sales)? A rising rental-DOM trend means longer vacancies and softer asking-rent achievability than the comps imply.
- What's the recent tenant-quality profile in this submarket — average credit score on applications, eviction rate, late-payment / NSF rate, and stable-employment percentage? A property-management company in the area should have these aggregated.
- How much new for-sale + rental construction is in the pipeline within 1–3 miles? Heavy new supply typically softens prices + rents 12–24 months out; constrained supply supports both.
Investment metrics
- 1% rule
- 0.77% ✗
- Cap rate
- 4.91%
- Cash-on-cash
- -4.92%
- DSCR
- 0.78
- GRM
- 10.8
CMA / ARV
- ARV (on-the-fly)
- $297,168
- Comps found
- 12
Show comp detail 12 sales within ~0.75 mi
| Address | Dist | Beds/Ba | Sqft | Sold | Price | $/sf | Match |
|---|---|---|---|---|---|---|---|
| 6043 Ash Willow Ct | 0.12mi | 4/2.0 | 1,968 (0%) | 0mo | $248,745 | $126 | 94 |
| 6051 Ash Willow Ct | 0.12mi | 4/2.5 | 1,968 (0%) | 0mo | $297,990 | $151 | 92 |
| 6034 Ash Willow Ct | 0.10mi | 4/2.5 | 1,968 (0%) | 2mo | $293,990 | $149 | 92 |
| 6225 Alder Creek Dr | 0.06mi | 4/2.5 | 2,039 (+4%) | 1mo | $272,990 | $134 | 89 |
| 13079 Pine Trace St | 0.06mi | 4/2.5 | 2,083 (+6%) | 1mo | $343,990 | $165 | 85 |
| 13043 Pine Trace St | 0.07mi | 3/2.0 (-1) | 1,792 (-9%) | 1mo | $320,990 | $179 | 76 |
| 6039 Ash Willow Ct | 0.11mi | 4/2.0 | 1,720 (-13%) | 1mo | $276,990 | $161 | 73 |
| 6122 Daintree Ct | 0.54mi | 4/2.5 | 1,968 (0%) | 1mo | $293,990 | $149 | 72 |
| 13107 Pine Trace St | 0.31mi | 3/2.0 (-1) | 1,724 (-12%) | 0mo | $308,190 | $179 | 60 |
| 6253 Alder Creek Dr | 0.41mi | 4/2.5 | 2,254 (+14%) | 1mo | $278,990 | $124 | 54 |
| 13087 Pine Trace St | 0.54mi | 3/2.5 (-1) | 1,749 (-11%) | 1mo | $332,990 | $190 | 49 |
| 6242 Alder Creek Dr | 0.54mi | 4/2.5 | 2,254 (+14%) | 1mo | $274,990 | $122 | 48 |
Match score weights: distance 35% · size 25% · config 20% · recency 20%. Top-matched comps best support the ARV.
Projected returns pro-forma
-3.0% appreciation · 0.4% rent growth · sell at horizon
- IRR
- -27.7%
- Equity multiple
- 0.09×
- Total profit
- $-75,654
- Equity at exit
- $44,309
- IRR
- -40.4%
- Equity multiple
- -0.40×
- Total profit
- $-116,274
- Equity at exit
- $25,694
Cash invested: $83,207 (down + closing). Projections, not guarantees.
Landlord ↔ Tenant lean methodology
- Overall (STATE)
- 87 Strongly Landlord-Friendly
- State Texas
- 87 Strongly Landlord-Friendly · R+5
- County
- — inherits STATE
- City
- — inherits STATE
ZIP-level market 77316
- Home prices YoY
- -10.7%
- Rents YoY
- 0.4%
- Active inventory
- 2300
- Price-to-rent
- 10.4×
Monthly cashflow live
- Estimated rent
- $2,294 medium interval (Pro) →
- Mortgage (P&I)
- −$1,558
- Tax est. 1.5%
- −$371 /mo · $4,458/yr
- Insurance
- −$124
- HOA
- −$100
- Vacancy / Maint / Mgmt
- −$482
- Net cashflow
- $-341
Break-even live
Sensitivity live
| Price | -10% $-136 | -5% $-239 | +0% $-341 | +5% $-444 | +10% $-547 |
|---|---|---|---|---|---|
| Rent | -10% $-523 | -5% $-432 | +0% $-341 | +5% $-251 | +10% $-160 |
| Rate | -1.0pp $-192 | -0.5pp $-266 | base $-341 | +0.5pp $-418 | +1.0pp $-497 |
UW: 25.0% down · 7.5% · 30yr · 1.5% tax · 5.0% vac · 8.0% maint · 8.0% mgmt
Financing live
Cash to close
- Down payment
- $74,292
- Closing costs
- $8,915
- Reserves months
- —
- Total cash needed
- —
Loan-product check · same deal, 3 products live
Conventional
25% down · 7.5% · 30yr
- Down + closing
- —
- Monthly P&I
- —
- Monthly cashflow
- —
- DSCR
- —
- Eligible?
- —
Personal DTI + credit; lowest rate.
DSCR
20% down · 8.5% · 30yr
- Down + closing
- —
- Monthly P&I
- —
- Monthly cashflow
- —
- DSCR
- —
- Eligible?
- —
No personal income docs; deal must DSCR.
Hard money
10% down · 12.0% · 12mo
- Down + closing
- —
- Monthly P&I
- —
- Monthly cashflow
- —
- DSCR
- —
- Eligible?
- —
Short-term bridge; refi at stabilization.
HOA detail
- Monthly dues
- $100 · $1,200/yr
Listing history 12 events
-
2026-06-21pricedays on market $286,990 Active 18 DOM
-
2026-06-18days on market $264,990 Active 15 DOM
-
2026-06-18remarks 652-char remark
-
2026-06-17days on market $264,990 Active 14 DOM
-
2026-06-16days on market $264,990 Active 13 DOM
-
2026-06-15days on market $264,990 Active 12 DOM
-
2026-06-13days on market $264,990 Active 10 DOM
-
2026-06-09days on market $264,990 Active 6 DOM
-
2026-06-08days on market $264,990 Active 5 DOM
-
2026-06-07days on market $264,990 Active 4 DOM
-
2026-06-04remarks 613-char remark
-
2026-06-04$264,990 Active 1 DOM
ⓘ Source: listings_history table (triggers on properties + properties_extension) + one-shot
backfill from property_details.listing_events for pre-trigger history.
Climate risk First Street
- Flood 1/10 Low FEMA zone X (unshaded) · 0% chance over 30 yrs
- Wildfire 5/10 Major
- Heat 8/10 Severe 7 d/yr ≥111°F today · 23 d/yr by 30 yrs out
- Wind 8/10 Severe 99% chance of damaging wind over 30 yrs
- Air quality 2/10 Low 1 unhealthy d/yr today · 2 by 30 yrs out
Nearby sold comps map
Loading sold comps map…
Walkable amenities ~0.75 mi
Loading nearby amenities…
Taxation est. · year 1
- Rental income
- $27,527
- − Mortgage interest
- −$16,646
- − Property taxes
- −$4,458
- − Insurance
- −$1,486
- − Repairs & maintenance
- −$2,202
- − Management
- −$2,202
- − HOA
- −$1,200
- − Depreciation
- −$8,645
- Taxable loss
- −$9,311
- Est. tax savings @ 24.0%
- +$2,235
- After-tax cash flow
- $-1,863/yr
For passive investors: Depreciation is non-cash, so a rental often shows a tax loss while cash-flowing — sheltering income. Rental losses are passive: they offset passive income freely, and up to $25,000/yr can offset ordinary (W-2) income if you actively participate and your MAGI is under $100k (phasing out to $0 by $150k); unused losses carry forward. On sale, claimed depreciation is recaptured at up to 25%, and gains may owe capital-gains tax (a 1031 exchange can defer both). Figures are a year-1 estimate at your 24.0% rate — not tax advice; consult a CPA.
Condition & rehab AI · 14 photos
This two-story home is in excellent condition with a modern and well-maintained interior and exterior. It is move-in ready and would benefit from a fresh coat of paint and landscaping improvements to further enhance its value.
Value-add opportunities
- Both Painting the exterior and interior walls — Fresh paint can enhance the curb appeal and interior aesthetics, making the home more attractive to potential buyers and renters.
- Both Landscaping improvements — Enhancing the landscaping can improve the home's curb appeal and add value to the property.
Renovation cost estimate screening
Value-add ROI direction
- Both Painting the exterior and interior walls — Fresh paint can enhance the curb appeal and interior aesthetics, making the home more attractive to potential buyers and renters. ↑
- Both Landscaping improvements — Enhancing the landscaping can improve the home's curb appeal and add value to the property. ↑
ⓘ Cost ranges are severity-bucket heuristics (US national rule-of-thumb). Get contractor quotes + a written scope before underwriting a rehab budget.
Schools (NCES district)
- District
- Magnolia ISD
- NCES district ID
- 4828740
- Math proficiency
- 42% ▼ -7.00%
- Reading proficiency
- 45% ▼ -4.00%
- Median HH income
- $71,692
- Composite
- 39.46/100
- National rank
- #3958
- State rank
- #247 of 826 in TX
Livability — Magnolia
- Score
- 73/100
- State rank
- #222
- US rank
- #5442
Category grades
Schools grade is shown separately in the Schools card above.
Census & demographics
- County
- Montgomery County · 663,713 people
- City population
- 32,847
- Metro
- Houston-The Woodlands-Sugar Land, TX
- Population (ZIP)
- 34,694
- Household income
- $124,055
- Rent vs Own
- Severe rent burden
- 273.0
Population outlook (Montgomery County) Hauer SSP2
- Today (2025)
- 713,896 people
- By 2030
- 805,263 · +12.8%
- By 2040
- 992,708 · +39.1%
- By 2050
- 1,179,590 · +65.2%
- By 2075
- 1,628,084 · +128.1%
- By 2100
- 1,937,880 · +171.5%
Race, ethnicity, and origin ACS 2023
- Neighborhood character
- Predominantly White (80%)
- Race & ethnicity
- White 80% Hispanic / Latino 14% Two or more races 11% Black 1% Asian 1%
- Hispanic origin (detail)
- Mexican 9%
- Common ancestry
- Lithuanian 6% Slovak 3% Romanian 3%
- Foreign-born
- 6% · Canada
- Languages at home
- 90% English-only · Spanish 8%
Political lean MEDSL · Montgomery
- 2024 margin
- Solid R (+45.5) · D 26.8% · R 72.3%
- 2008→2024 swing
- +7.2pp toward D · 2008: -52.7pp · 2024: -45.5pp
- All cycles
- 2024: R+45.5 2020: R+43.8 2016: R+51.4 2012: R+60.7 2008: R+52.7
Not yet ingested
- Civics
- —
Market trends
- HPI YoY
- ▼ -31.44%
- Current HPI
- 262.6973
- Rent YoY
- ▲ 0.40%
- Metro
- Houston-The Woodlands-Sugar Land, TX
- State GDP YoY
- ▲ 3.95%
- F500 in state
- 110
Industry mix (Fortune 500 HQ in TX)
| Industry | F500 HQs | Revenue |
|---|---|---|
| Energy | 16 | $1,198B |
|
||
| Technology | 5 | $198B |
|
||
| Engineering / Construction | 4 | $72B |
|
||
| Energy Services | 3 | $60B |
|
||
| Utilities | 3 | $41B |
|
||
| Healthcare | 2 | $330B |
|
||
Price history
-9.2% since first listed2 events — show timeline
- 2026-06-03 Price Changed $264,990 HARMLS
- 2026-06-03 Listed $291,990 HARMLS
Cash-flow waterfall
monthlySold comps — $/sqft
last 12 mo · ≤1 miLoading sold comps…